
Stage Analysis Members Weekend Video – 19 June 2022 (1hr 24mins)
19 June, 2022The full post is available to view by members only. For immediate access:
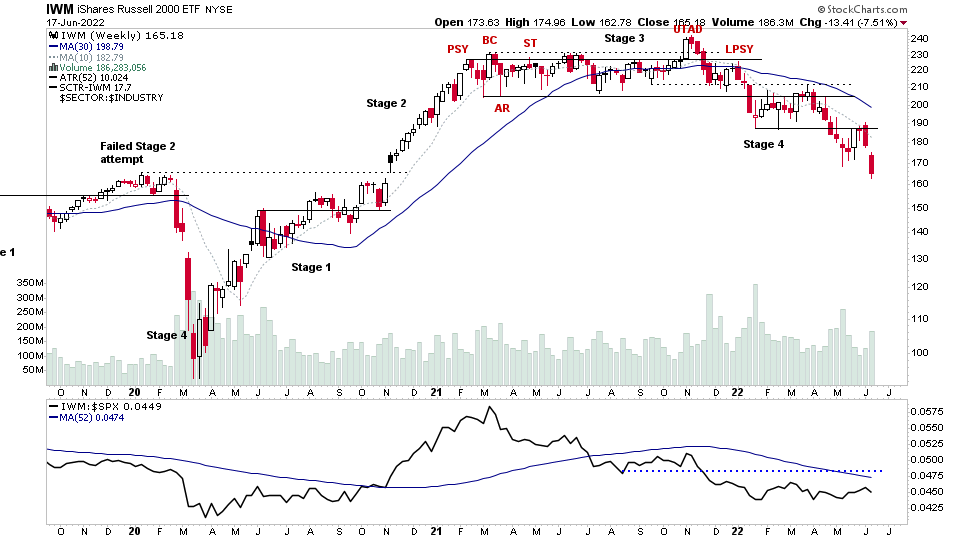
The Stage Analysis Members Weekend Video this week covers the Major Indexes with analysis of S&P 500, Nasdaq, Russell 2000 and more. Plus a look at futures charts of Oil, Copper, Treasuries & Gold.
Then in the members only content I do a deeper dive into the Industry Groups and Stage Analysis of multiple weekly group charts with tips on how to use the industry groups for determining the overall market stage. Following that I discuss the shifts in the IBD Industry Groups Bell Curve, and major market breadth charts to try to determine the Weight of Evidence. Then marking up multiple watchlist charts on the long and short side, and finally a look at the Stage 4 continuation in Bitcoin & Ethereum over the last week.
Become a Stage Analysis Member:
To see more like this – US Stocks watchlist posts, detailed videos each weekend, use our unique Stage Analysis tools, such as the US Stocks & ETFs Screener, Charts, Market Breadth, Group Relative Strength and more...
Join Today
Disclaimer: For educational purpose only. Not investment advice. Seek professional advice from a financial advisor before making any investing decisions.