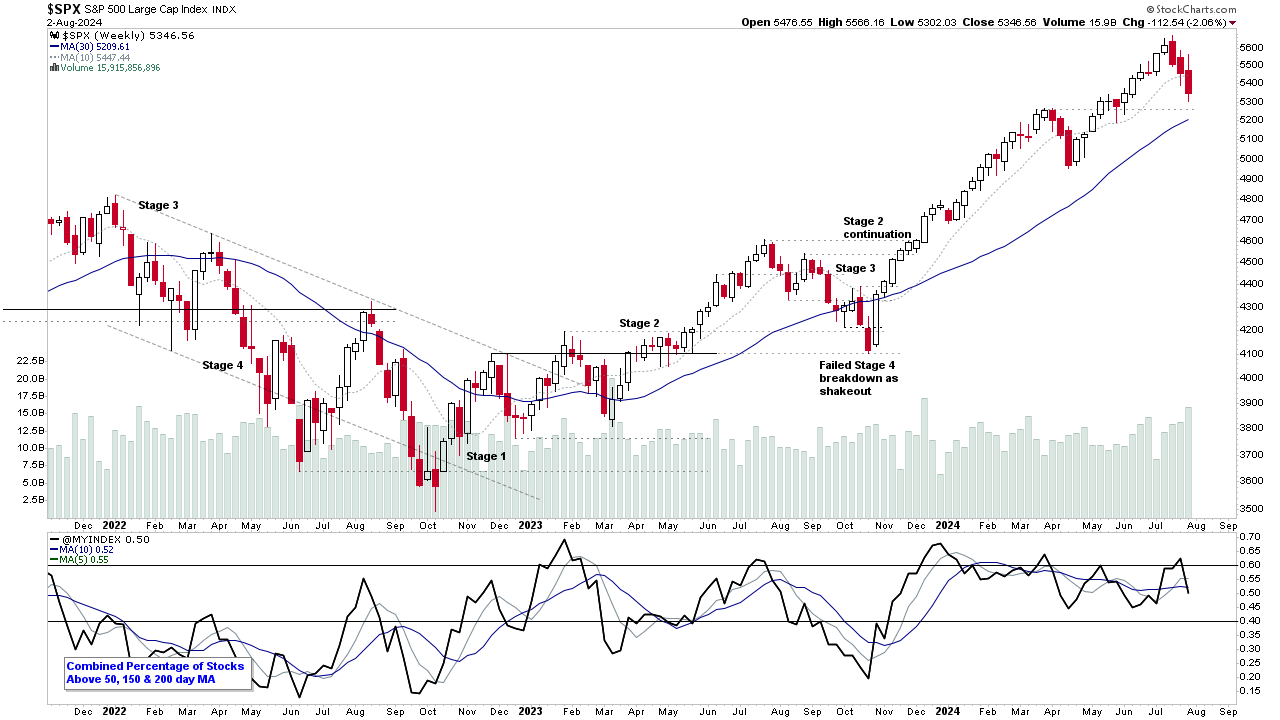
Stage Analysis members weekend video starting with a discussion about the Stage 4 breakdown attempt in Ethereum. Followed by the Major US Stock Market Indexes, the Sector Breadth and Sub-industry Bell Curve, the key Market Breadth Charts to determine the Weight of Evidence and a look at some of the stocks with upcoming earnings this coming week.
Read More

Blog
04 August, 2024
Stage Analysis Members Video – 4 August 2024 (45mins)
07 July, 2024
Stage Analysis Members Video – 7 July 2024 (1hr 1min)
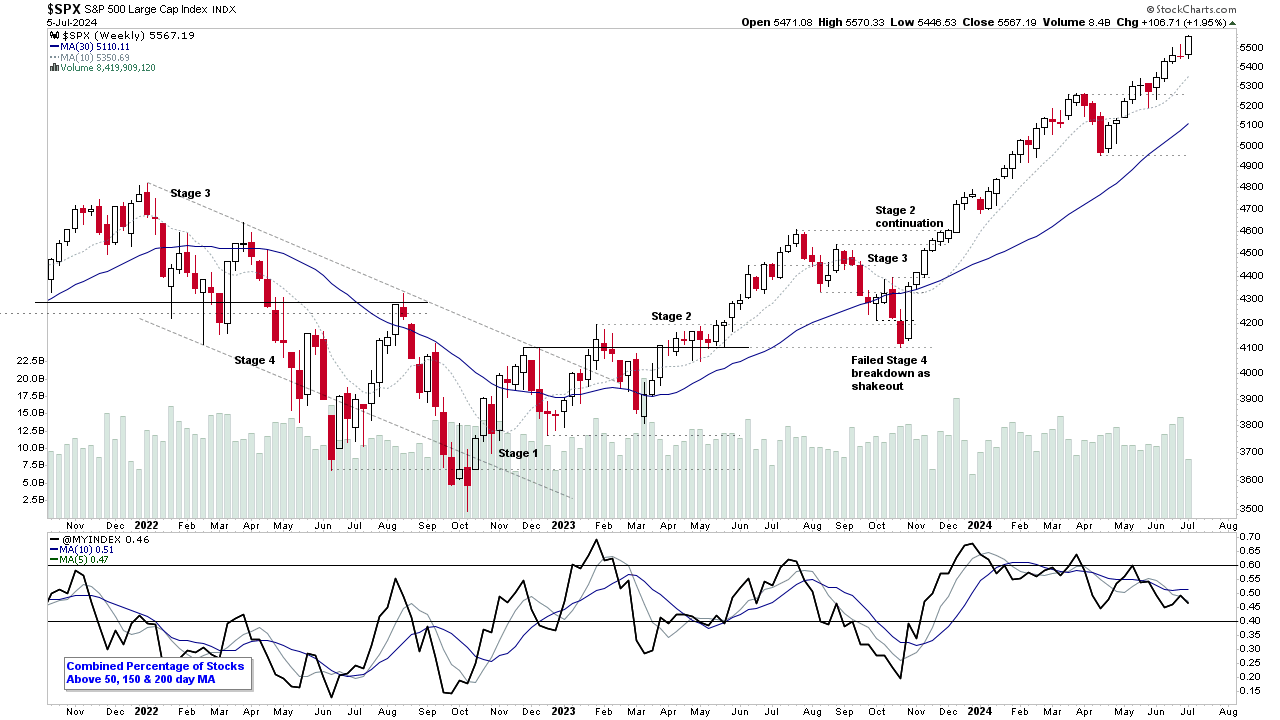
Stage Analysis members weekend video beginning with a discussion of Bitcoin & Ethereum as they both test their respective Stage 4 levels, followed by the US Watchlist Stocks in detail on multiple timeframes, the Industry Groups Relative Strength (RS) Rankings and GICS Group, Industry and Sub-industry Bell Curves with notable changes, the key Market Breadth Charts to determine the Weight of Evidence, Significant Weekly Bars, and the Major US Stock Market Indexes.
Read More
12 May, 2024
Stage Analysis Members Video – 12 May 2024 (1hr 3mins)
Stage Analysis members weekend video beginning with a look at some of this weeks Significant Bars, followed by the weekend US watchlist stocks, then the New Stage Analysis Screener options, the Industry Groups Relative Strength (RS) Rankings, the key Market Breadth Charts to determine the Weight of Evidence, and the Major US Stock Market Indexes.
Read More
28 April, 2024
Stage Analysis Members Video – 28 April 2024 (1hr 4mins)
Stage Analysis members weekend video beginning with a look at the most recent US watchlist stocks, Significant Weekly Bars moving on volume, the new interactive GICS Sub-industries Bell Curve improvements, the Industry Groups Relative Strength (RS) Rankings, the key Market Breadth Charts to determine the Weight of Evidence, and the Major US Stock Market Indexes.
Read More
21 April, 2024
Stage Analysis Members Video – 21 April 2024 (56mins)
Stage Analysis members weekend video discussing the US watchlist stocks, Significant Weekly Bars moving on volume, the new interactive GICS Sub-industries Bell Curve, the Industry Groups Relative Strength (RS) Rankings, the key Market Breadth Charts to determine the Weight of Evidence, and the Major US Stock Market Indexes.
Read More
07 April, 2024
Stage Analysis Members Video – 7 April 2024 (59mins)
Stage Analysis members weekend video discussing the US watchlist stocks in detail on multiple timeframes, the Industry Groups Relative Strength (RS) Rankings, IBD Industry Group Bell Curve – Bullish Percent and transitioning to the new GICS Sub-industries Bell Curve data, the key Market Breadth Charts to determine the Weight of Evidence, this weeks Significant Weekly Bars moving on volume, and the Major US Stock Market Indexes, and then finishing by discussing the new features added to the Stage Analysis Technical Attributes (SATA) Tool this week, including the ETF Summary.
Read More
31 March, 2024
Stage Analysis Members Video – 31 March 2024 (1hr 6mins)
Stage Analysis members weekend video starting with this weeks Significant Weekly Bars moving on volume, then a further look at new Stage Analysis Technical Attributes (SATA) tool, new features and how to use it, followed by the US watchlist stocks in detail on multiple timeframes, the Industry Groups Relative Strength (RS) Rankings, IBD Industry Group Bell Curve – Bullish Percent, the key Market Breadth Charts to determine the Weight of Evidence and the Major US Stock Market Indexes.
Read More
24 March, 2024
Stage Analysis Members Video – 24 March 2024 (56 mins)
Stage Analysis members weekend video starting with discussion of the US watchlist stocks in detail on multiple timeframes, then some of the weeks Significant Weekly Bars moving on volume, and a continued look at new Stage Analysis Technical Attributes (SATA) tool and how to use it, the Industry Groups Relative Strength (RS) Rankings, IBD Industry Group Bell Curve – Bullish Percent, the key Market Breadth Charts to determine the Weight of Evidence and the Major US Stock Market Indexes, and then finishing this week with analysis of the Bitcoin and Ethereum charts.
Read More
17 March, 2024
Stage Analysis Members Video – 17 March 2024 (1hr 1min)
Stage Analysis members weekend video beginning by discussing some of the weeks Significant Weekly Bars moving on volume, then US watchlist stocks in detail on multiple timeframes, a further look at new Stage Analysis Technical Attributes (SATA) tool and how to use it, the Industry Groups Relative Strength (RS) Rankings, IBD Industry Group Bell Curve – Bullish Percent, the key Market Breadth Charts to determine the Weight of Evidence and the Major US Stock Market Indexes.
Read More
10 March, 2024
Stage Analysis Members Video – 10 March 2024 (1hr 3mins)
Stage Analysis members weekend video discussing the Significant Weekly Bars moving on volume, the US watchlist stocks in detail on multiple timeframes, the new Stage Analysis Technical Attributes (SATA) tool and how to use it, the Industry Groups Relative Strength (RS) Rankings, IBD Industry Group Bell Curve – Bullish Percent, the key Market Breadth Charts to determine the Weight of Evidence, the Crypto Coins and the Major US Stock Market Indexes.
Read More