The Stage Analysis members video beginning with a discussion of the Major US Stock Market Indexes, and then a look at some of the biggest stocks with earnings this coming week on multiple timeframes, Stages Summary, the Sector breadth and Sub-industries Bell Curves, Relative Strength Rankings, the key Market Breadth Charts to determine the Weight of Evidence, Bitcoin & Ethereum and the ETF Summary.
Read More

Blog
26 July, 2026
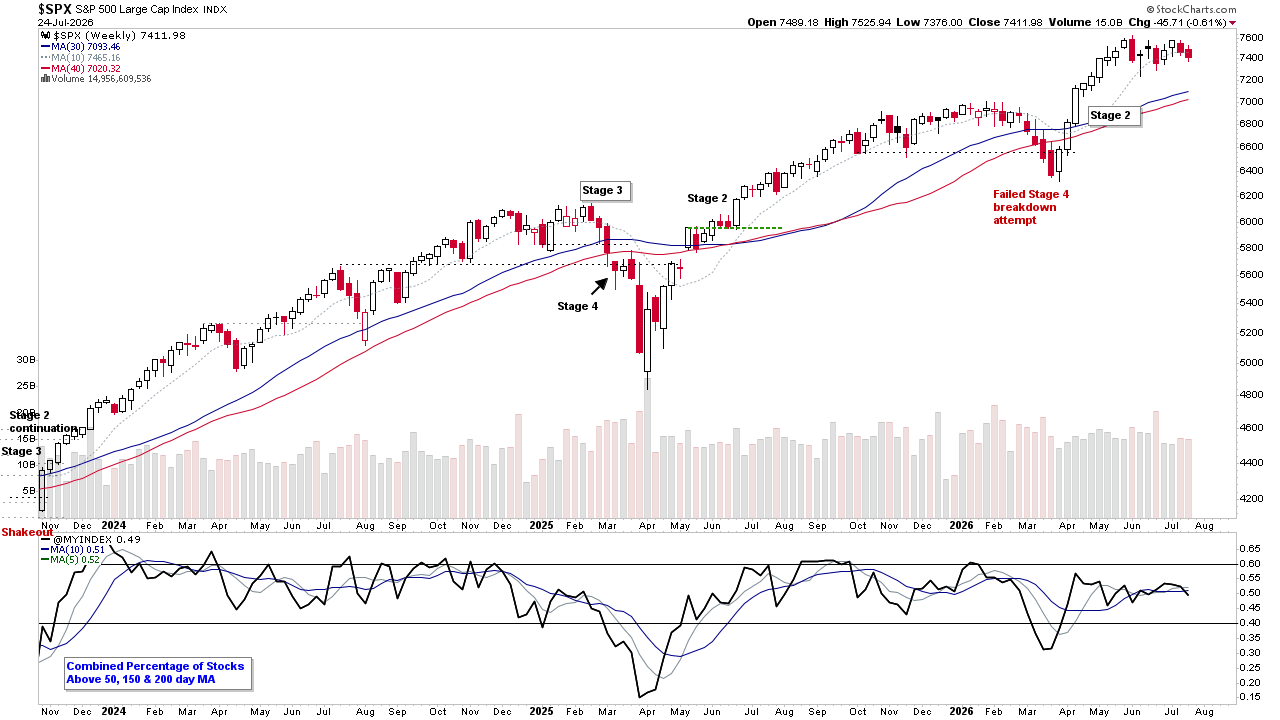
Stage Analysis Members Video – 26 July 2026 (52mins)
19 July, 2026
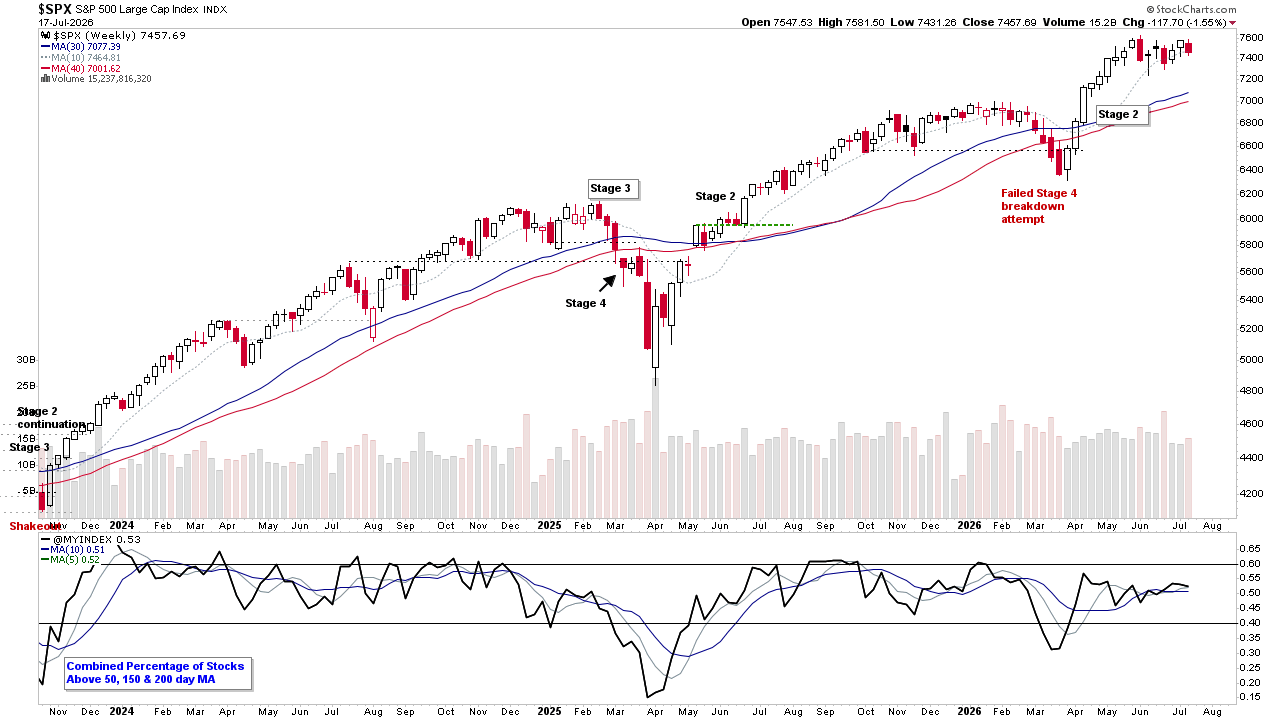
Stage Analysis Members Video – 19 July 2026 (59mins)
The Stage Analysis members video starts this week by discussing the Major US Stock Market Indexes, and then the current US Watchlist Stocks on multiple timeframes, Stage 2 Breakout & Stage 4 Breakdown attempts, Stages Summary, the Sector breadth and Sub-industries Bell Curves, Relative Strength Rankings, the key Market Breadth Charts to determine the Weight of Evidence, Bitcoin & Ethereum and the ETF Summary.
Read More

12 July, 2026
Stage Analysis Members Video – 12 July 2026 (50mins)
The Stage Analysis members video beginning with a discussion of the current US Watchlist Stocks on multiple timeframes, Stage 2 Breakout & Stage 4 Breakdown attempts, Stages Summary, the Sector breadth and Sub-industries Bell Curves, Relative Strength Rankings, the key Market Breadth Charts to determine the Weight of Evidence, Bitcoin & Ethereum, the Major US Stock Market Indexes and the ETF Summary.
Read More

05 July, 2026
Stage Analysis Members Video – 5 July 2026 (1hr 5mins)
The Stage Analysis members video this week begins with a discussion of the current US Watchlist Stocks on multiple timeframes, Stage 2 Breakout & Stage 4 Breakdown attempts, Stages Summary, the Sector breadth and Sub-industries Bell Curves, Relative Strength Rankings, the key Market Breadth Charts to determine the Weight of Evidence, Bitcoin & Ethereum, the Major US Stock Market Indexes and the ETF Summary.
Read More

21 June, 2026
Stage Analysis Members Video – 21 June 2026 (53mins)
The Stage Analysis members video beginning with a discussion of the current US Watchlist Stocks on multiple timeframes, Stage 2 Breakout & Stage 4 Breakdown attempts, Stages Summary, the Sector breadth and Sub-industries Bell Curves, Relative Strength Rankings, the key Market Breadth Charts to determine the Weight of Evidence, Bitcoin & Ethereum, the Major US Stock Market Indexes and the ETF Summary.
Read More

14 June, 2026
Stage Analysis Members Video – 14 June 2026 (53mins)
The Stage Analysis members video discussing the current US Watchlist Stocks on multiple timeframes, Stage 2 Breakout & Stage 4 Breakdown attempts, Stages Summary, the Sector breadth and Sub-industries Bell Curves, Relative Strength Rankings, the key Market Breadth Charts to determine the Weight of Evidence, Bitcoin & Ethereum, the Major US Stock Market Indexes and the ETF Summary.
Read More
07 June, 2026
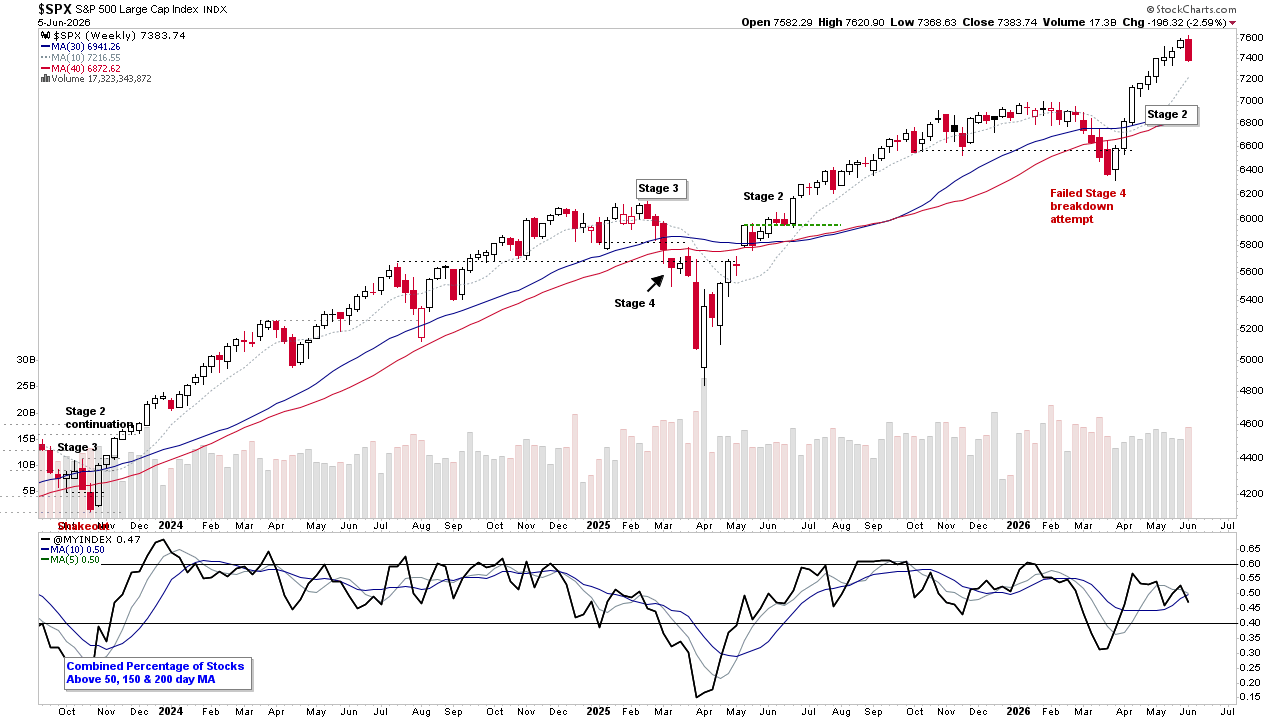
Stage Analysis Members Video – 7 June 2026 (1hr 1mins)
The Stage Analysis members video beginning with a discussion of the the Major US Stock Market Indexes, the ETF Summary, current US Watchlist Stocks on multiple timeframes, Stage 2 Breakout & Stage 4 Breakdown attempts, Stages Summary, the Sector breadth and Sub-industries Bell Curves, Relative Strength Rankings, the key Market Breadth Charts to determine the Weight of Evidence and Bitcoin & Ethereum.
Read More

31 May, 2026
Stage Analysis Members Video – 31 May 2026 (53mins)
The Stage Analysis members video beginning with a discussion of the current US Watchlist Stocks on multiple timeframes, Stage 2 Breakout & Stage 4 Breakdown attempts, Stages Summary, the Sector breadth and Sub-industries Bell Curves, Relative Strength Rankings, the key Market Breadth Charts to determine the Weight of Evidence, Bitcoin & Ethereum, the Major US Stock Market Indexes and ETF Summary.
Read More

24 May, 2026
Stage Analysis Members Video – 24 May 2026 (51 mins)
The Stage Analysis members video discussing the current US Watchlist Stocks on multiple timeframes, Stage 2 Breakout & Stage 4 Breakdown attempts, Stages Summary, the Sector breadth and Sub-industries Bell Curves, Relative Strength Rankings, the key Market Breadth Charts to determine the Weight of Evidence, Bitcoin & Ethereum, the Major US Stock Market Indexes and ETF Summary.
Read More

17 May, 2026
Stage Analysis Members Video – 17 May 2026 (1hr 10mins)
The Stage Analysis members video beginning with a discussion of the current US Watchlist Stocks on multiple timeframes, Stage 2 Breakout & Stage 4 Breakdown attempts, Stages Summary, the Sector breadth and Sub-industries Bell Curves, Relative Strength Rankings, the key Market Breadth Charts to determine the Weight of Evidence, Bitcoin & Ethereum, the Major US Stock Market Indexes and ETF Summary.
Read More