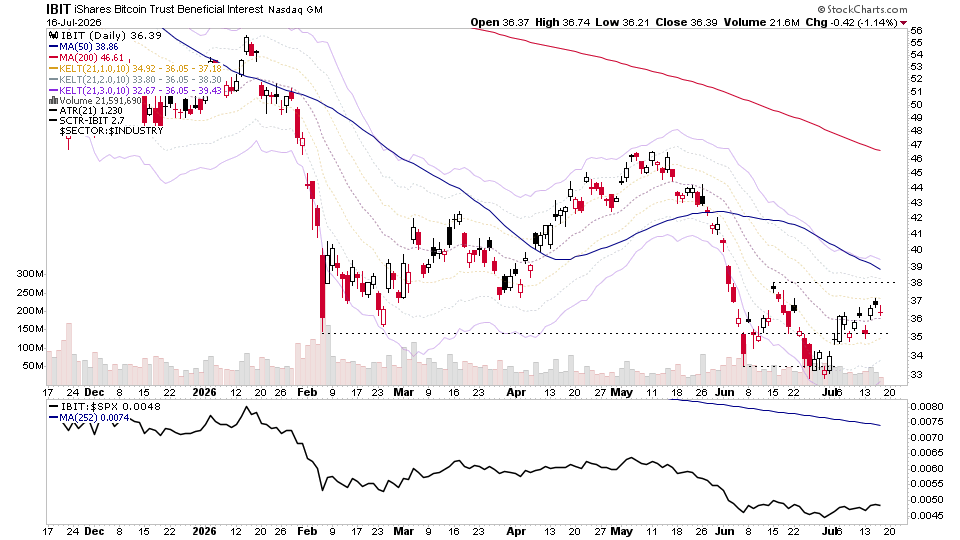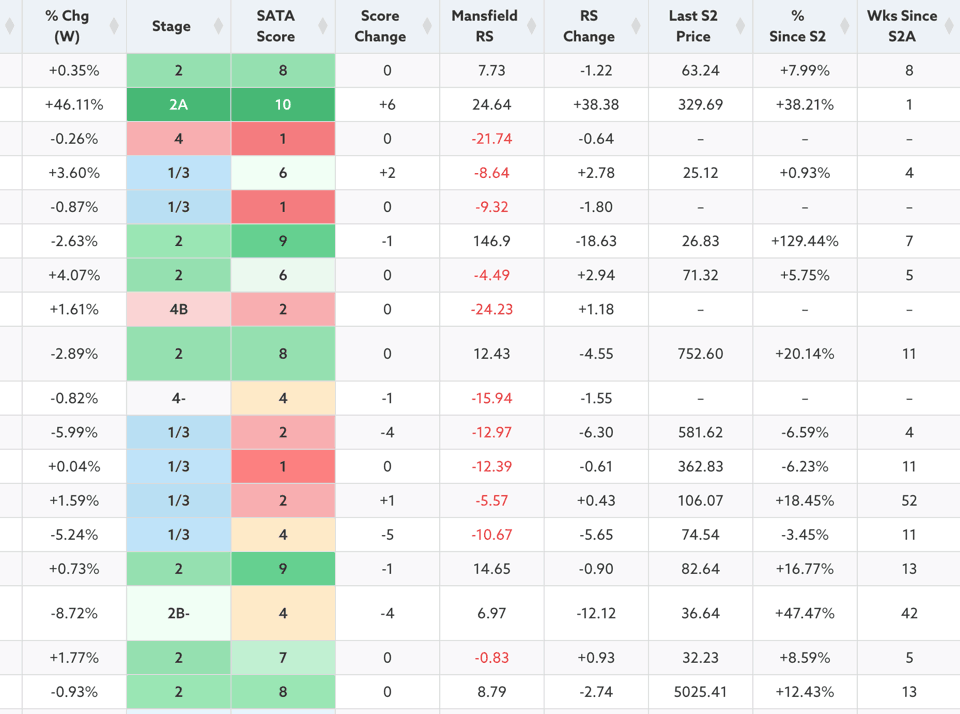
There are 20 stocks highlighted from the weekends US stocks watchlist scans...
Read More
02 August, 2026
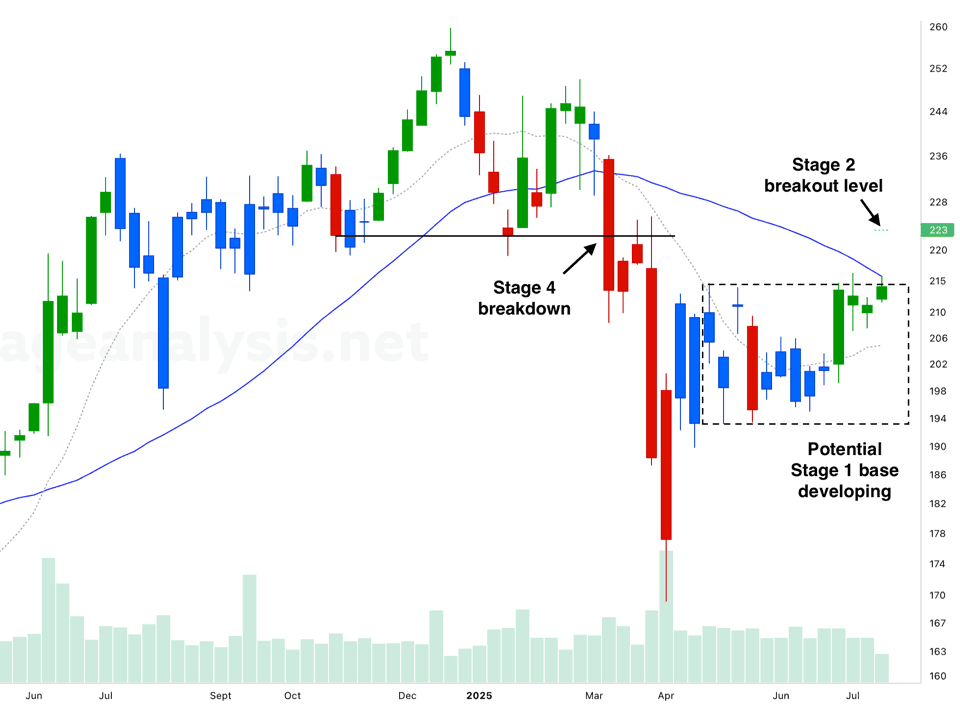
Trading and Investing using Stan Weinstein's Stage Analysis method from his classic book Secrets for Profiting in Bull and Bear Markets
Stage Analysis is a place for people who trade and invest in the US stock market with a focus on technical analysis, price action, volume, relative strength, support/resistance levels, market breadth and multiple other technical attributes, as described in Stan Weinstein’s 1988 book “Secrets for Profiting in Bull and Bear Markets“. Where he details his classic four stage breakout method for identifying the best quality stocks to buy and sell in any market environment.
Read moreStan Weinstein’s method has stood the test of time, with only relatively minor changes since the book was published, which we’ve managed to find out through many years of researching and applying the method. He continues to publish The Global Trend Alert (GTA) for institutional investors and high net worth individuals, but it is out of reach financially for most smaller retail traders and so this was one of the reasons that we originally created the Stage Analysis website – which started out as a forum in 2013, as a way for serious ordinary investors to be able to learn the method and collaborate with each other on ideas.
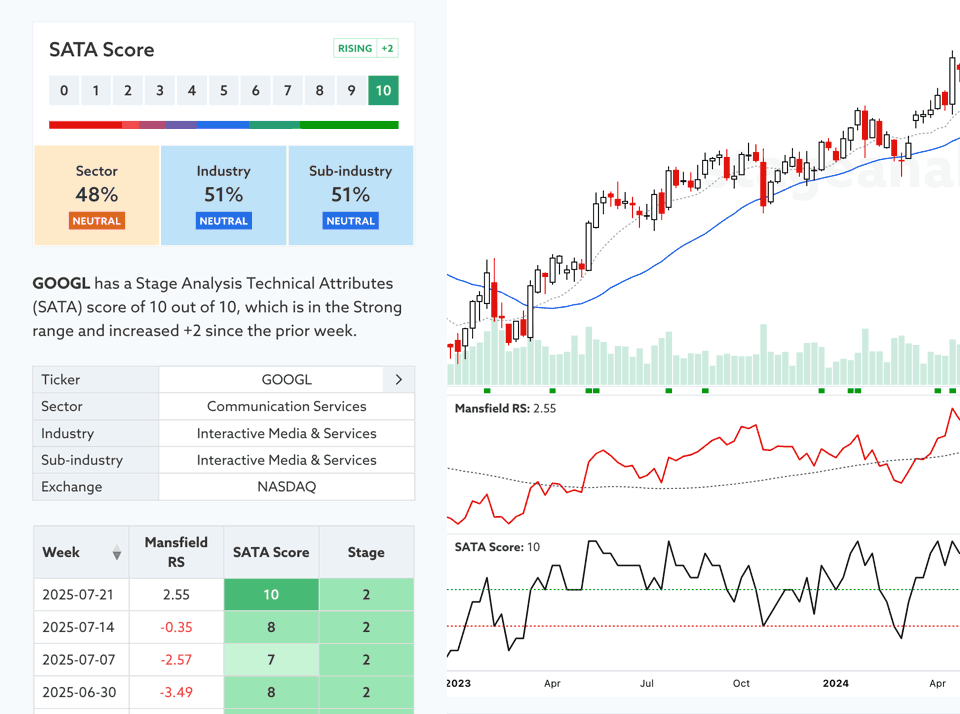
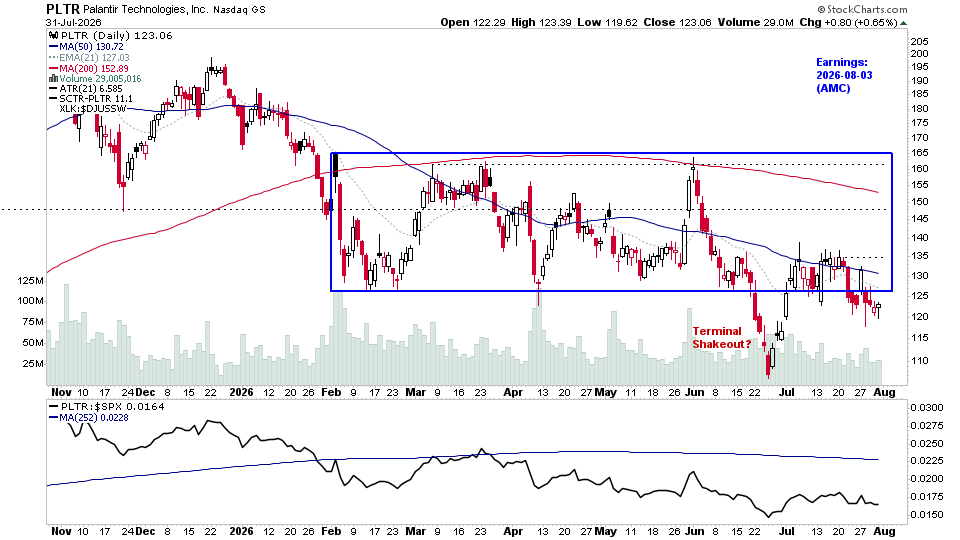
The Stage Analysis website has developed substantially over the years, with the forum being retired (but still accessible for reviewing old discussions on the method). But the member area now has a dedicated research platform, where you can easily scan daily for stocks that meet the Stage Analysis methods criteria. i.e. look for Stage 2 breakouts and Stage 4 breakdowns, stocks approaching their Stage 2 level and much more, with multiple unique filters that you won't find elsewhere.
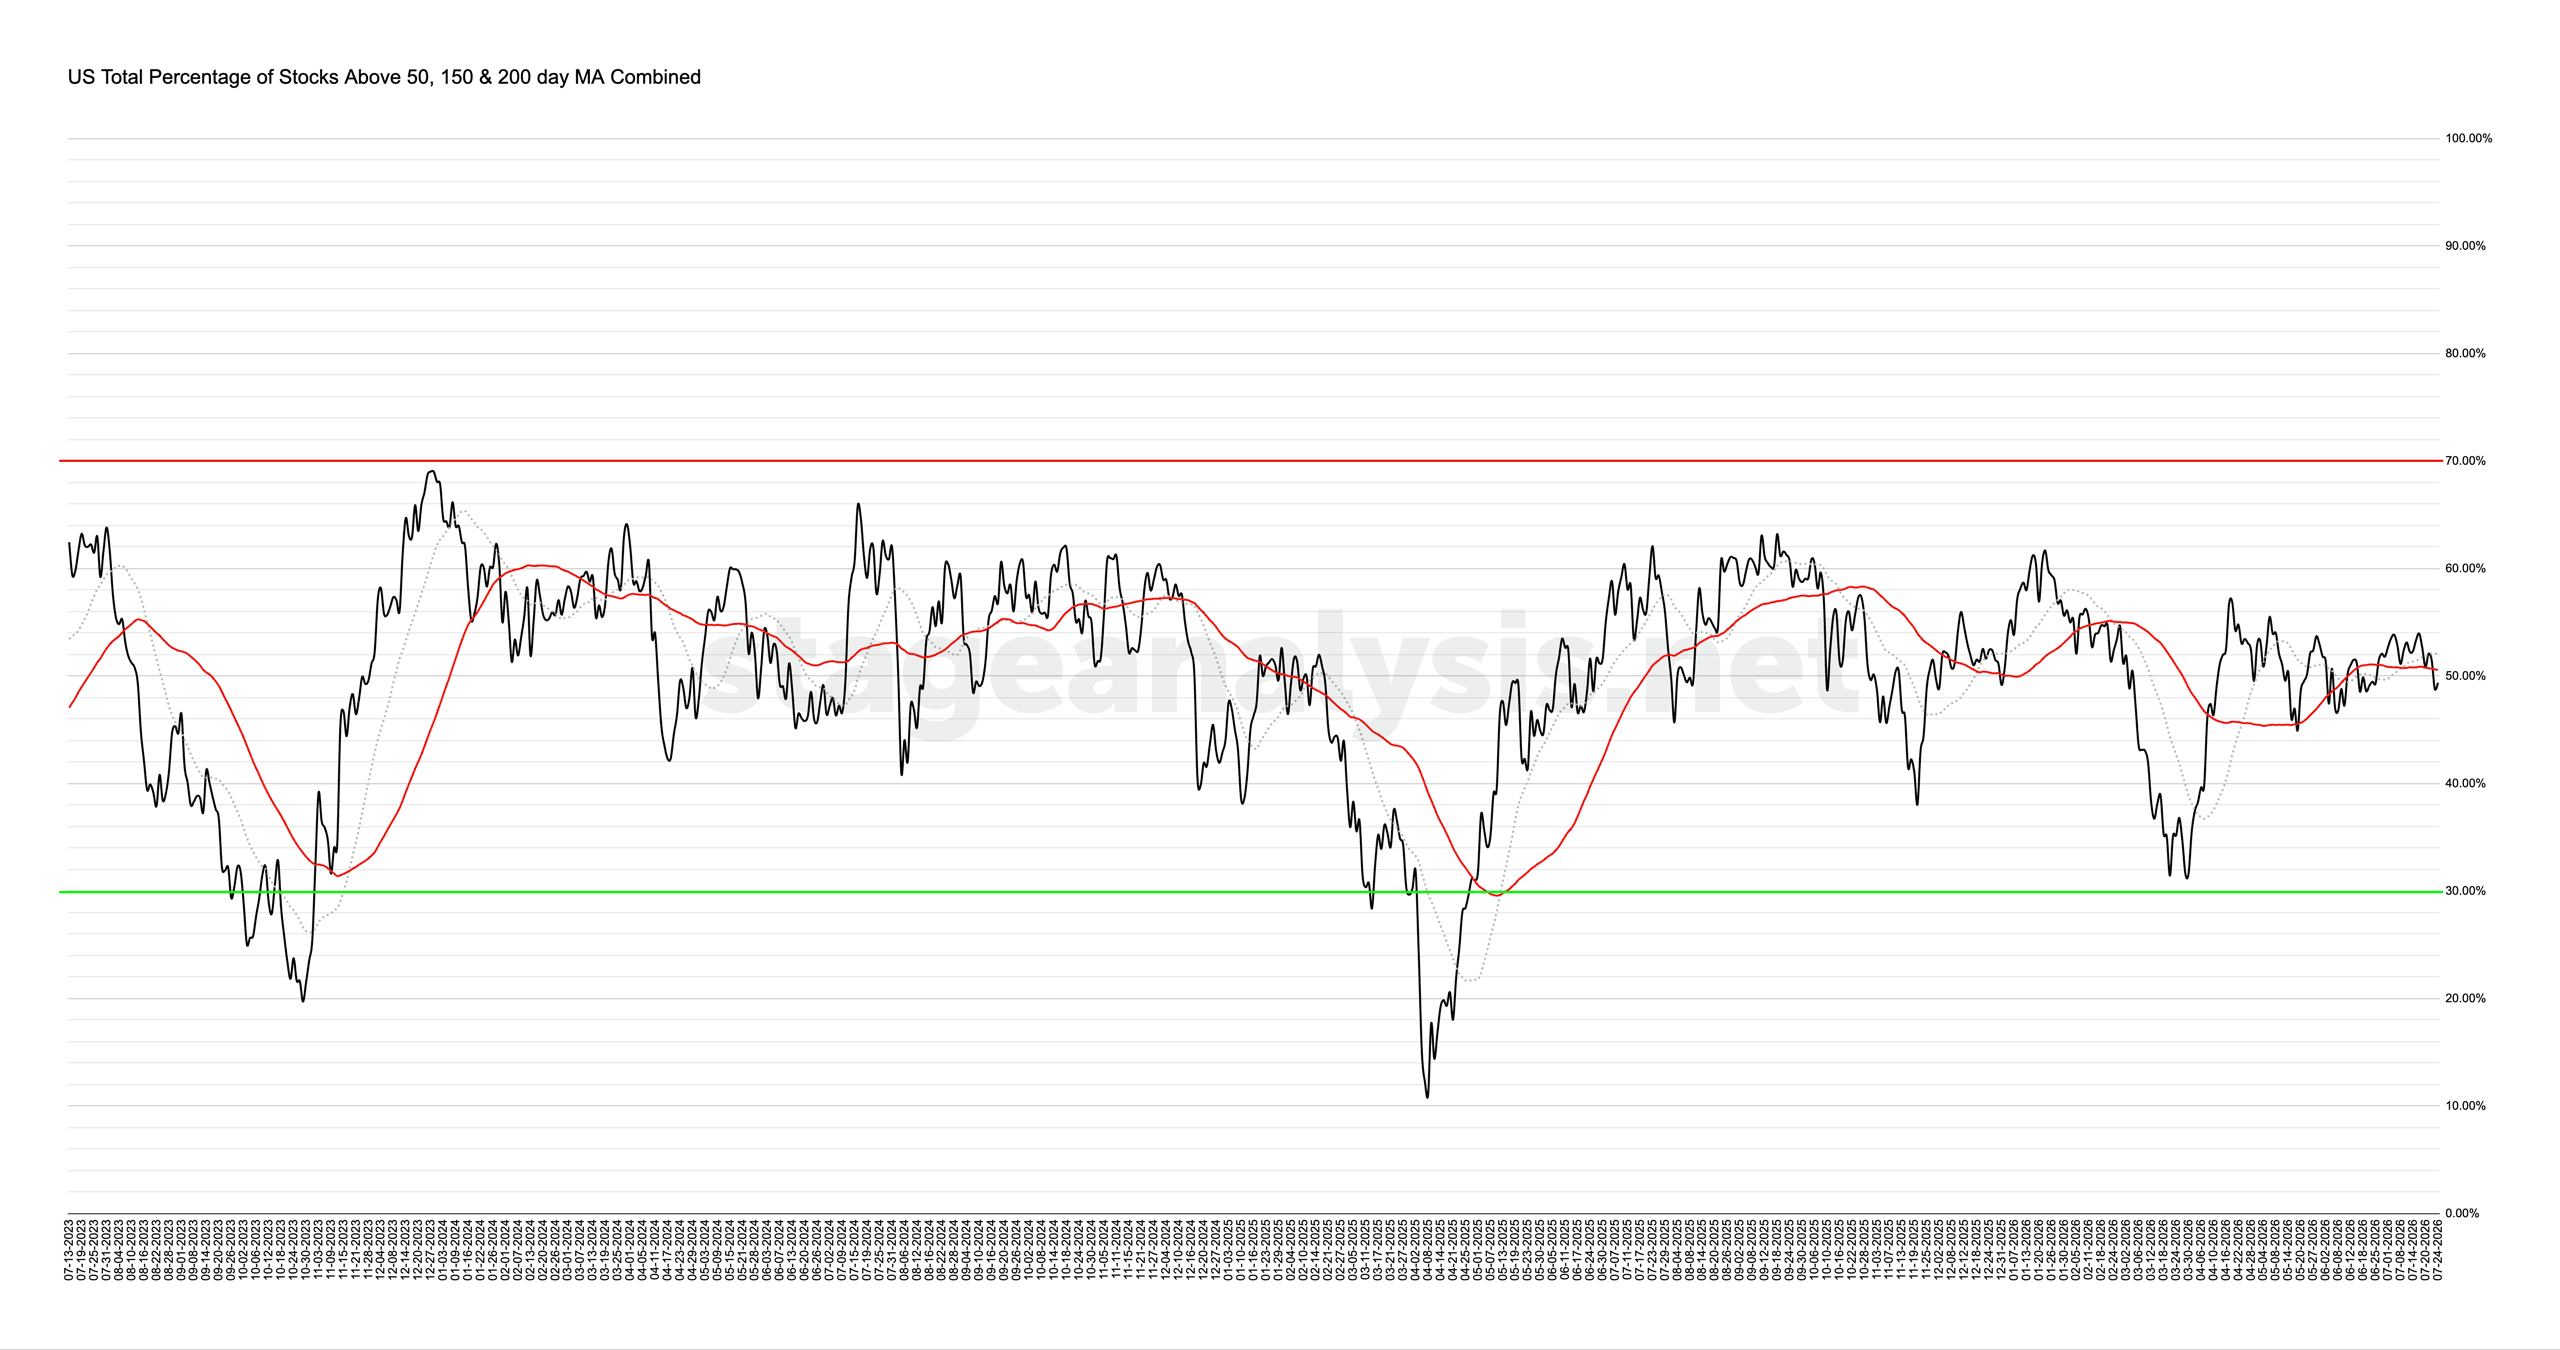
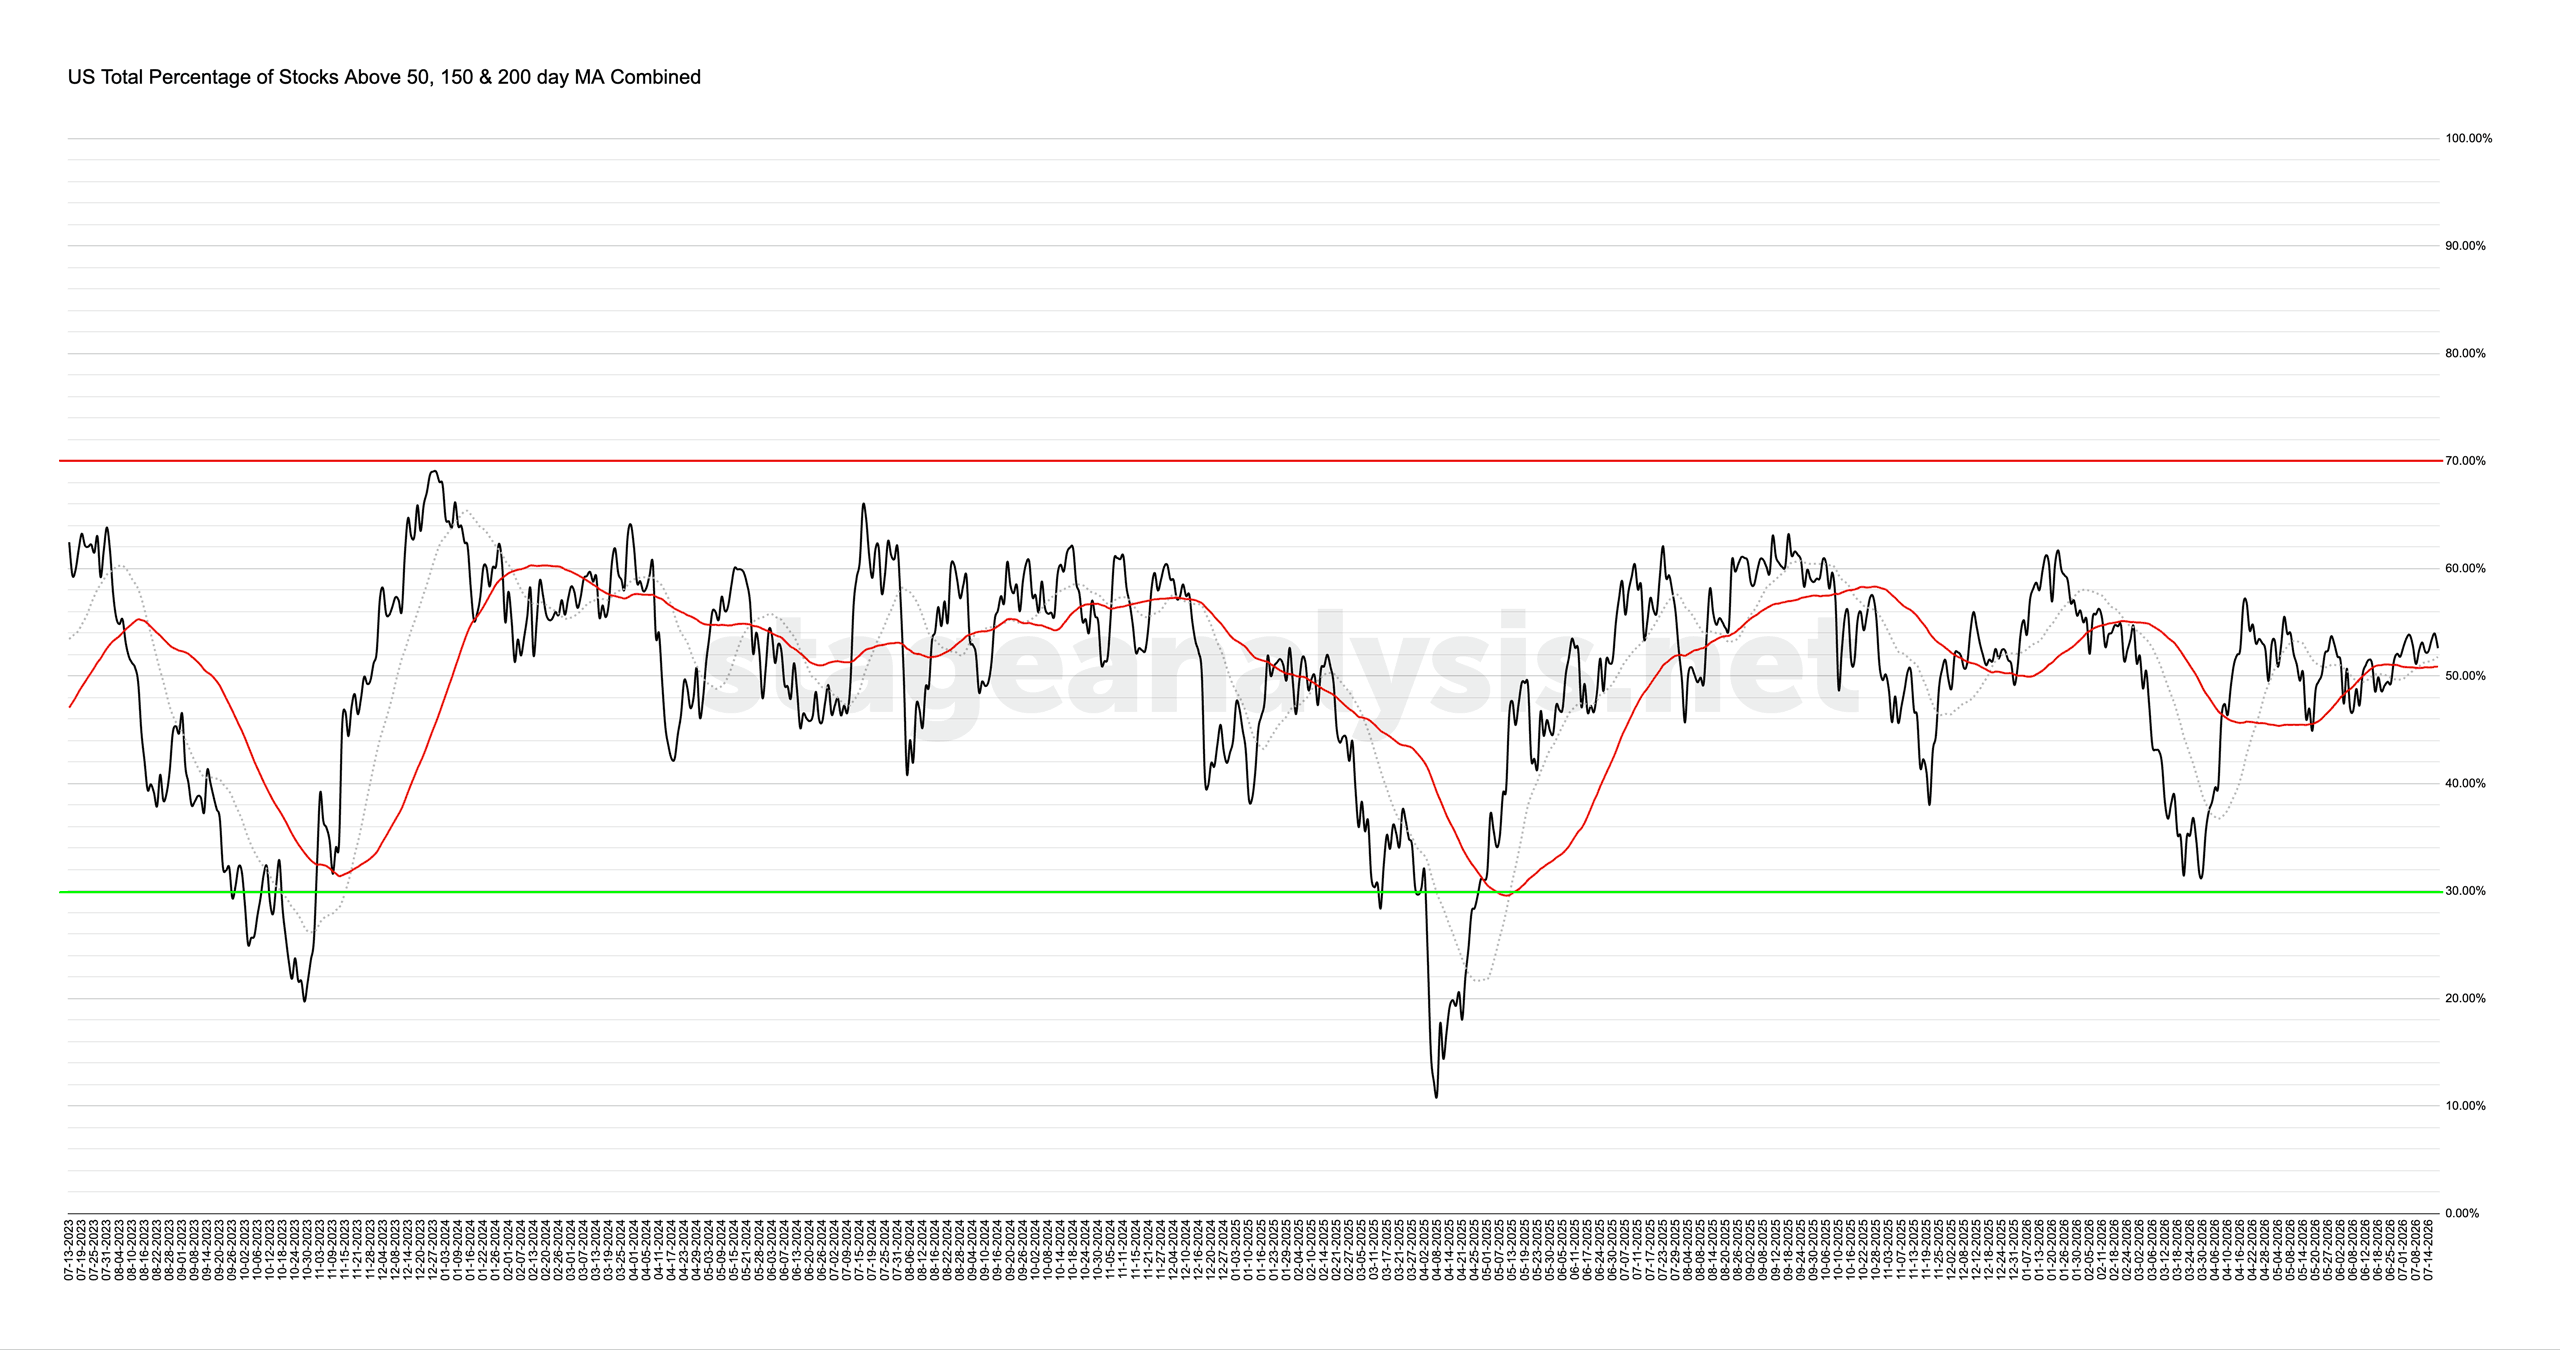
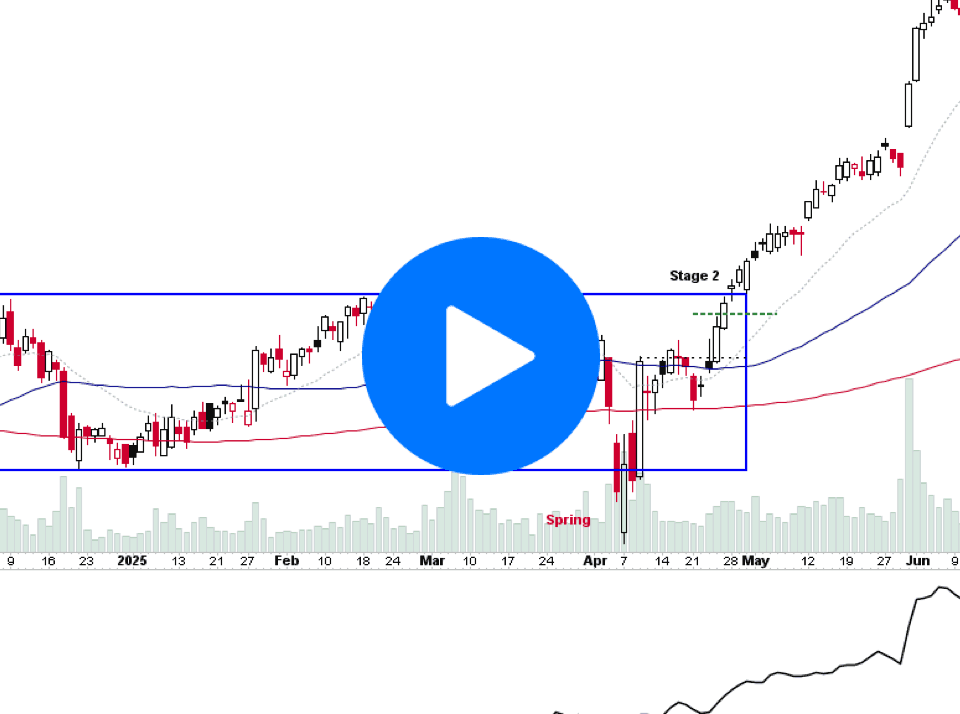
Apply the “Forest to The Trees Approach” from the book, via our unique market breadth tools and group pages to look for developing themes. Watch weekly detailed videos reviewing and analysing the major US indexes, Stage 2 breakouts and Stage 4 breakdowns, reviewing multiple market breadth indicators, discussing the relative strength emerging in the sub-industry groups and sectors, as well as multiple timeframe analysis of the stocks in the watchlist and more.
So if you are a swing/position trader or investor, and trade using the Stage Analysis method, or the Wyckoff method – then this is the platform for you. As it will save you time with your daily/weekly process, and help you to find/research leading stocks and group themes – before they make a powerful Stage 2 advance and become obvious to the crowd.
To see more Stage Analysis videos, subscribe to our youtube channel at https://www.youtube.com/StageAnalysis