Blog
Being able to identify the four Stages visually on individual stock charts is a crucial skill when using the Stage Analysis method. However, the major stock market index charts, such as the S&P 500, the Dow Jones Industrial Average, and the Nasdaq 100, are all just averages of the stocks within them, and are also distorted by the weighting of stocks.
For example, currently the top 10 stocks in the Nasdaq 100, make up 54% of the weighting. So over half of the Nasdaq 100s price action is determined by just 10% of the stocks. Therefore, you could have a scenario where 90% of stocks in the index are in Stage 4 declines, but the index chart could still look reasonably healthy in Stage 2, as the top 10 stocks are still in Stage 2 advances and holding the index up.
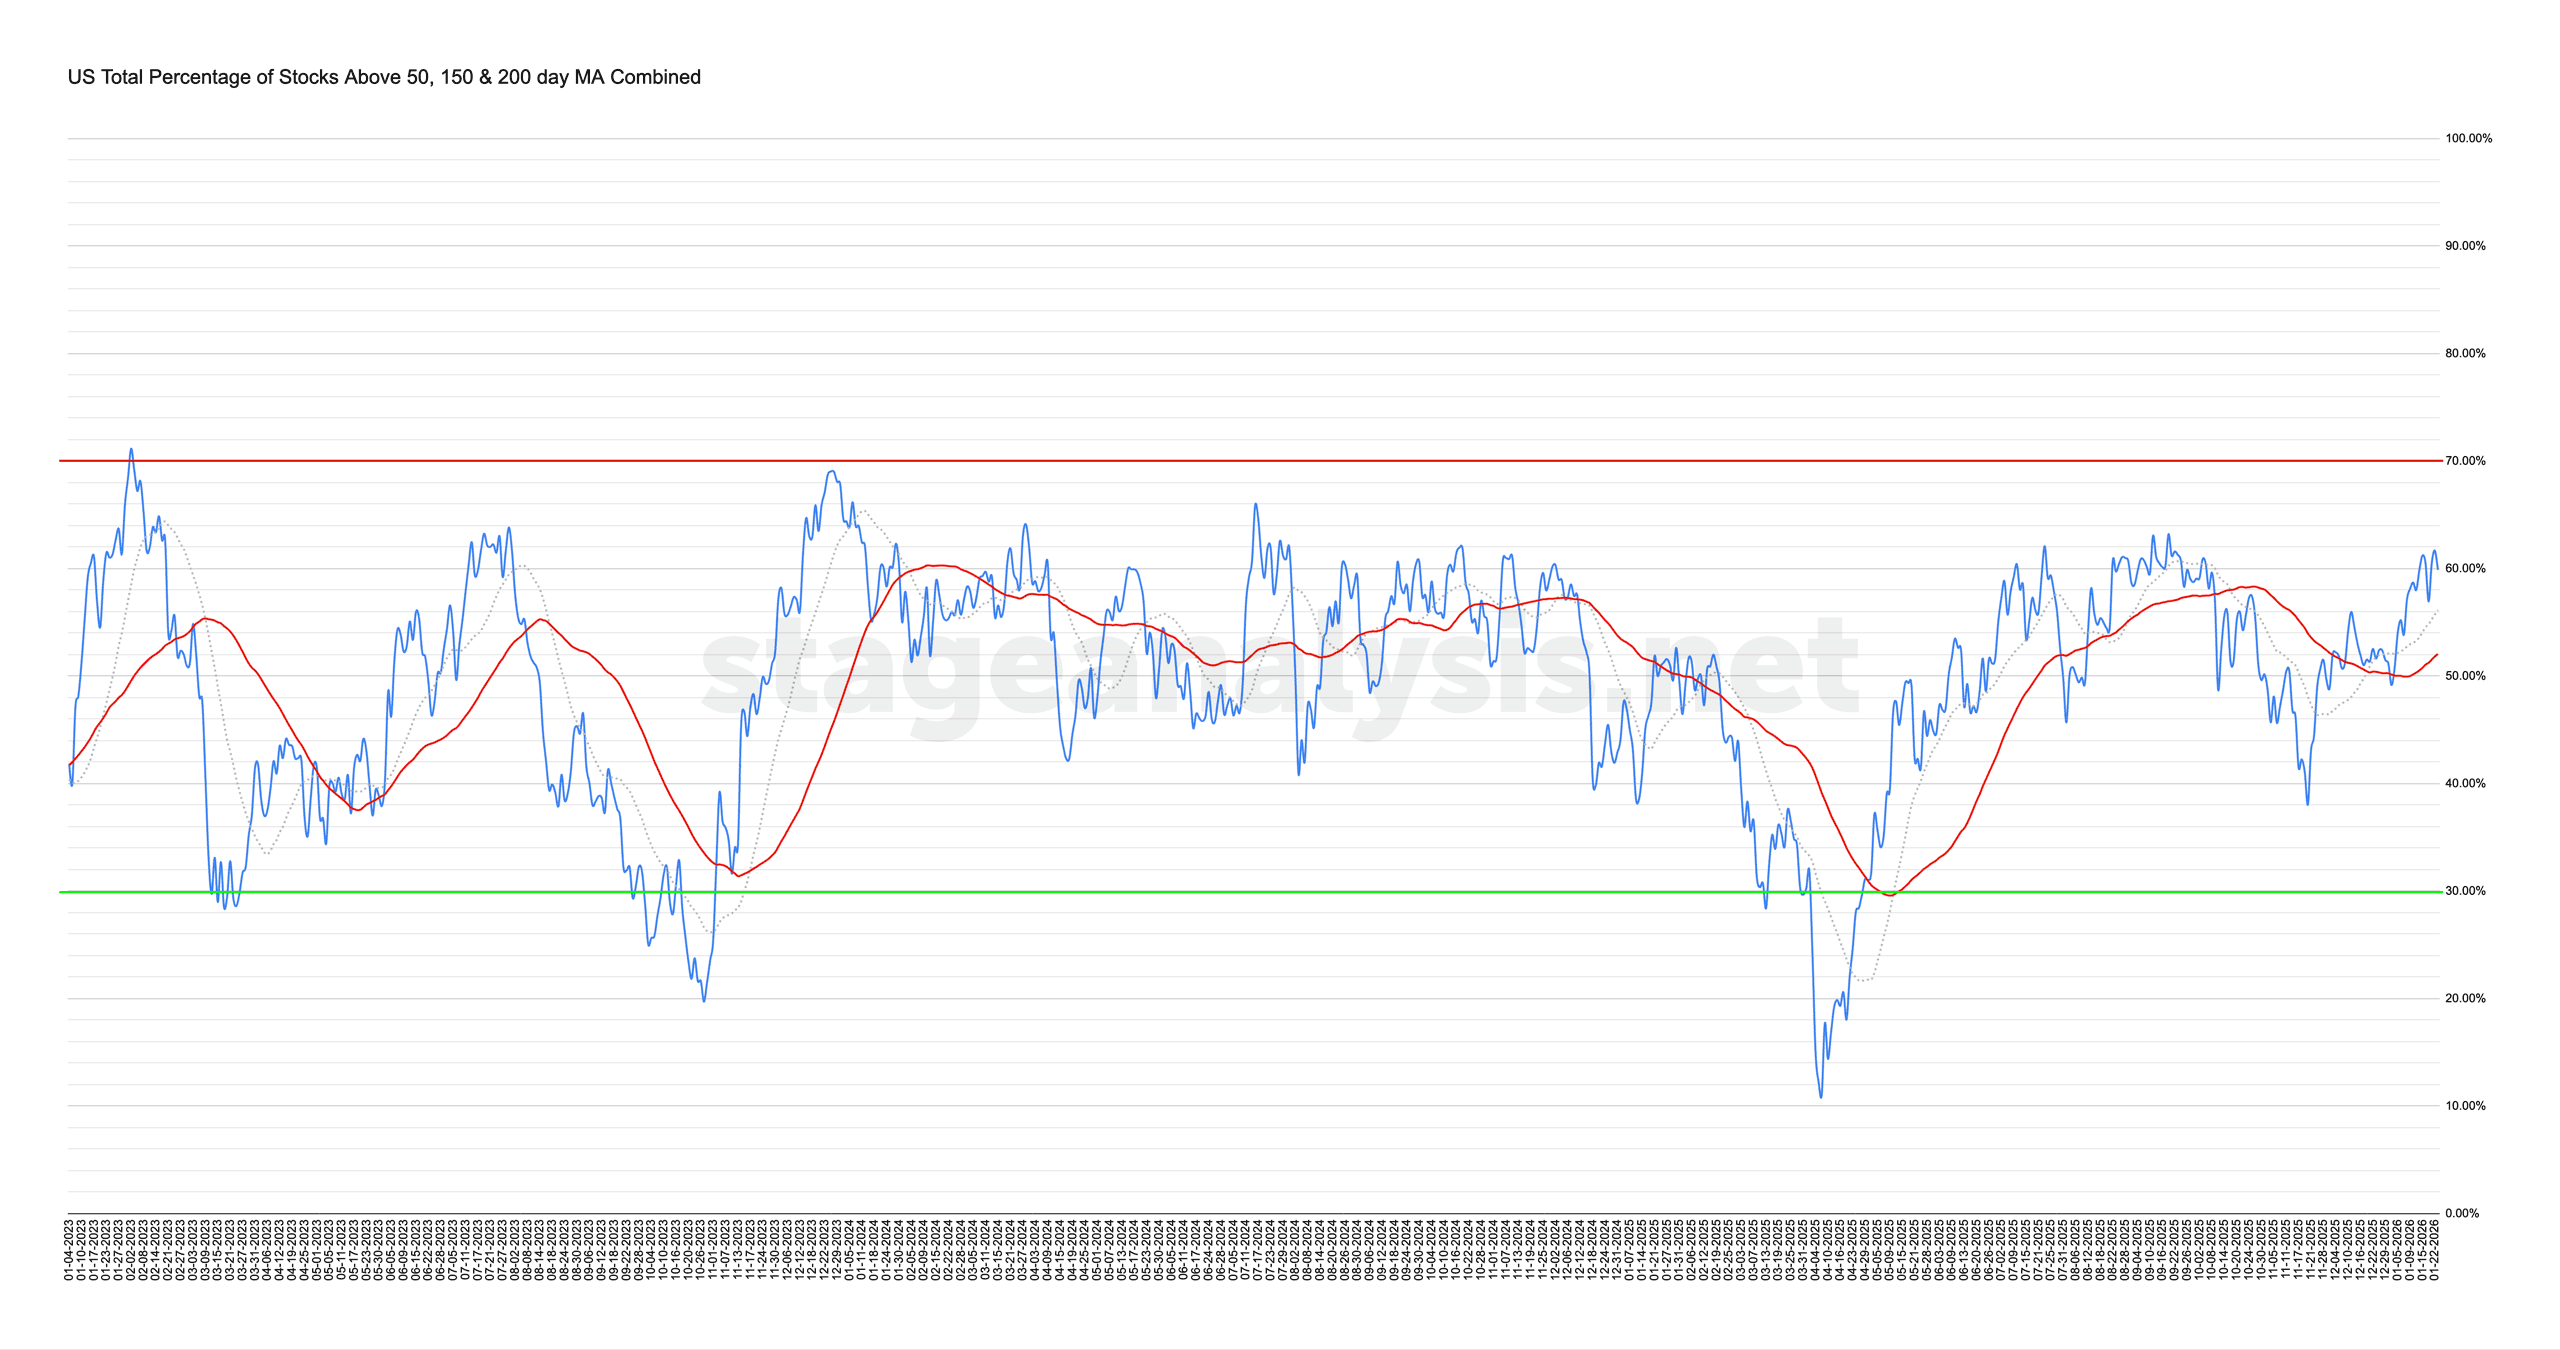
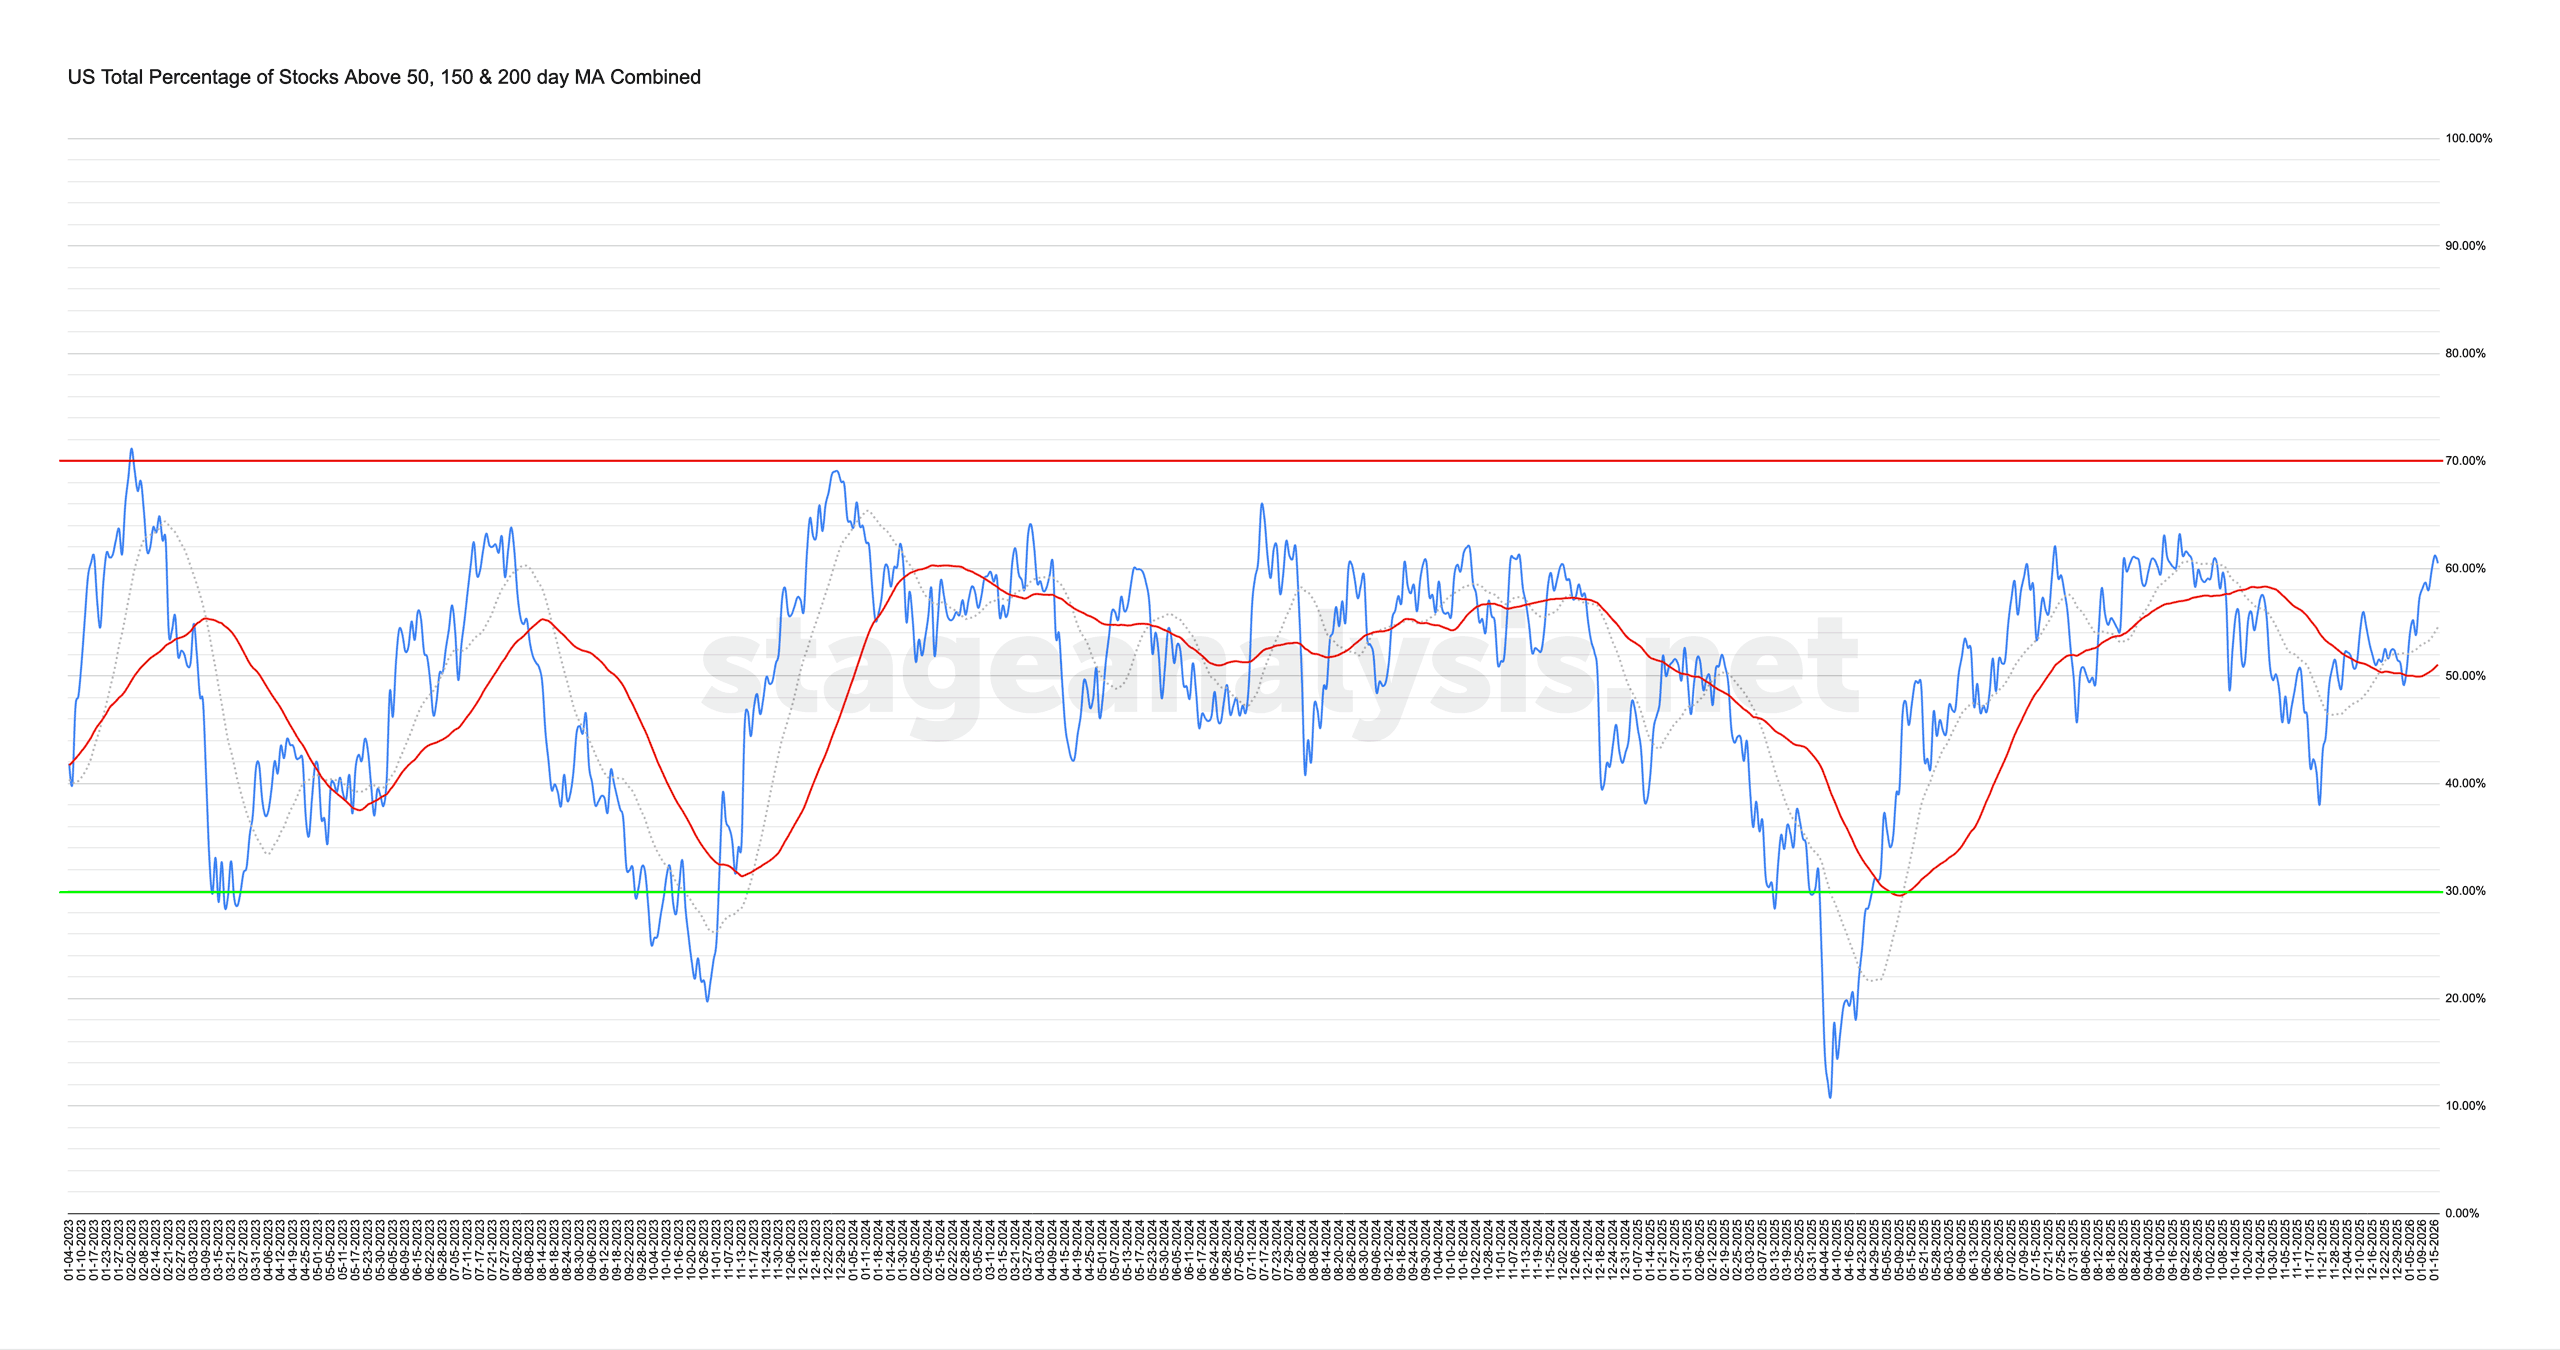
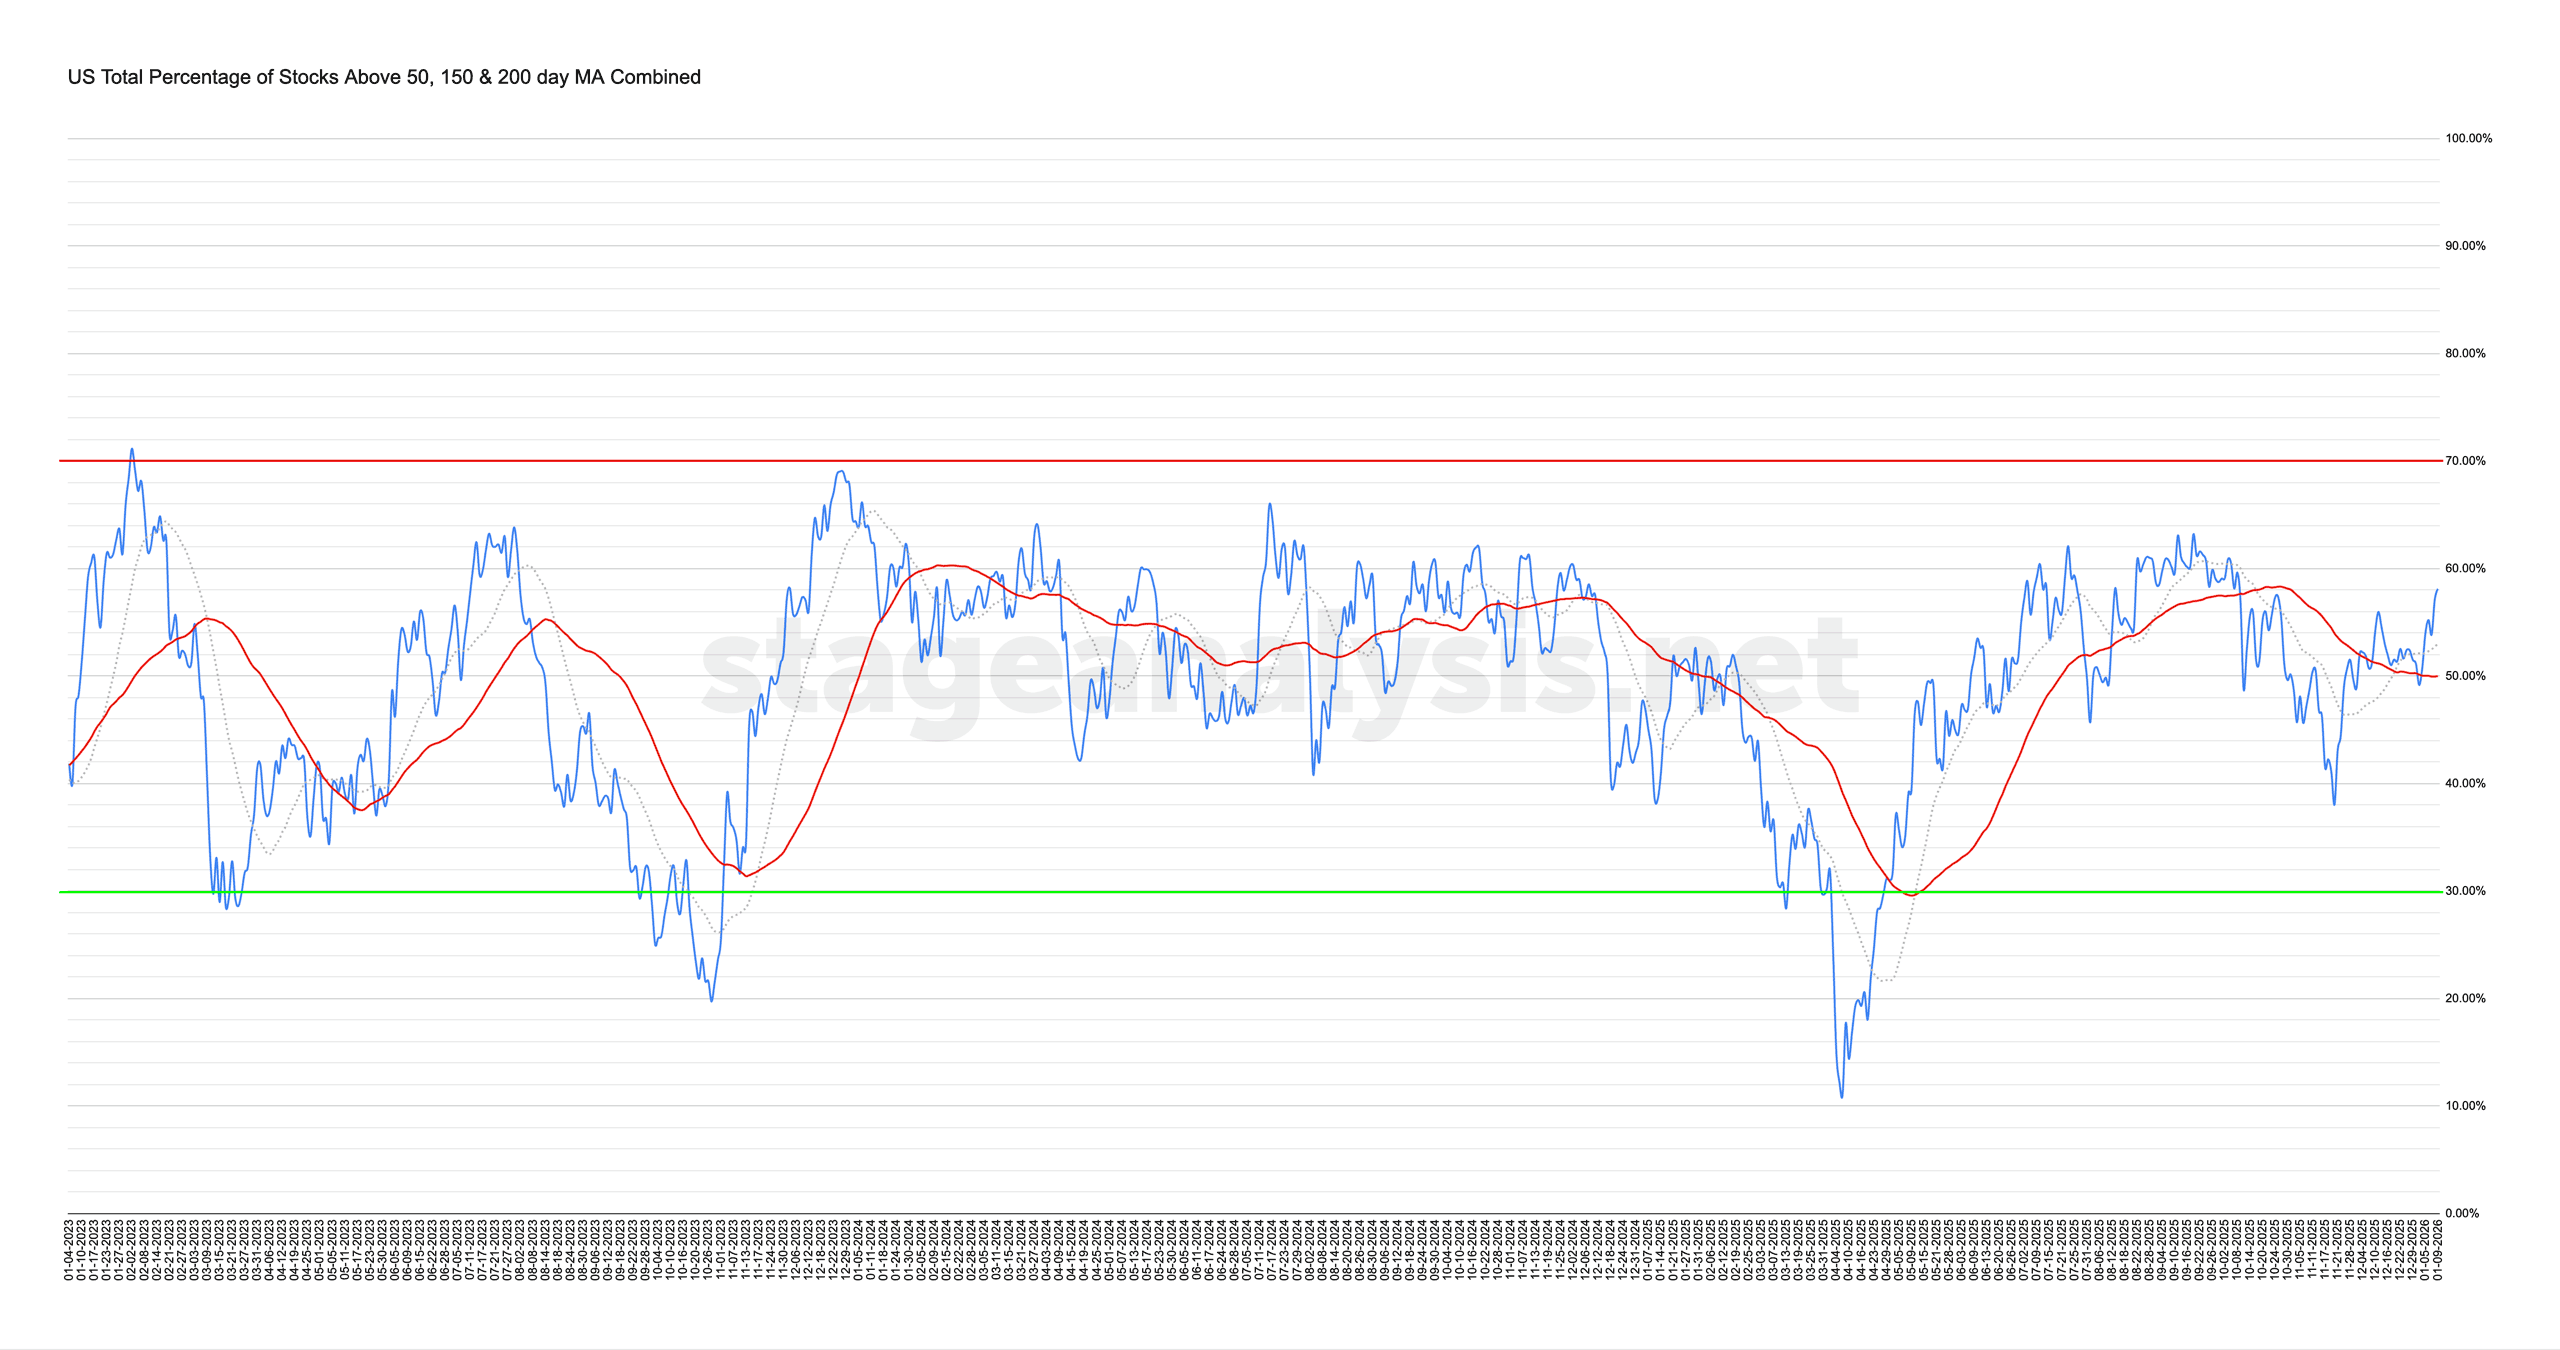
This is where market breadth indicators come into play. As they give you an unbiased look at what’s really going on under the surface of the stock market, and so can help you to determine the actual Stage that the market index is in.
There are many different data sources that you can use to get market breadth information, and each have their own strengths and weaknesses. But in the Stage Analysis method, no market breadth information is used in isolation. Instead, we use what is known as the Weight of Evidence approach, where all of the different market breadth information is combined to determine the overall strategy that should be used, and so can help you to determine whether you should be using a more cautious strategy or a more aggressive one.
Stan Weinstein was famous for using over 50 different indicators to determine the Weight of Evidence. But retail investors shouldn’t be put off, as you can achieve a similar effect by using a much smaller, core set of market breadth indicators, to create your own Weight of Evidence.


