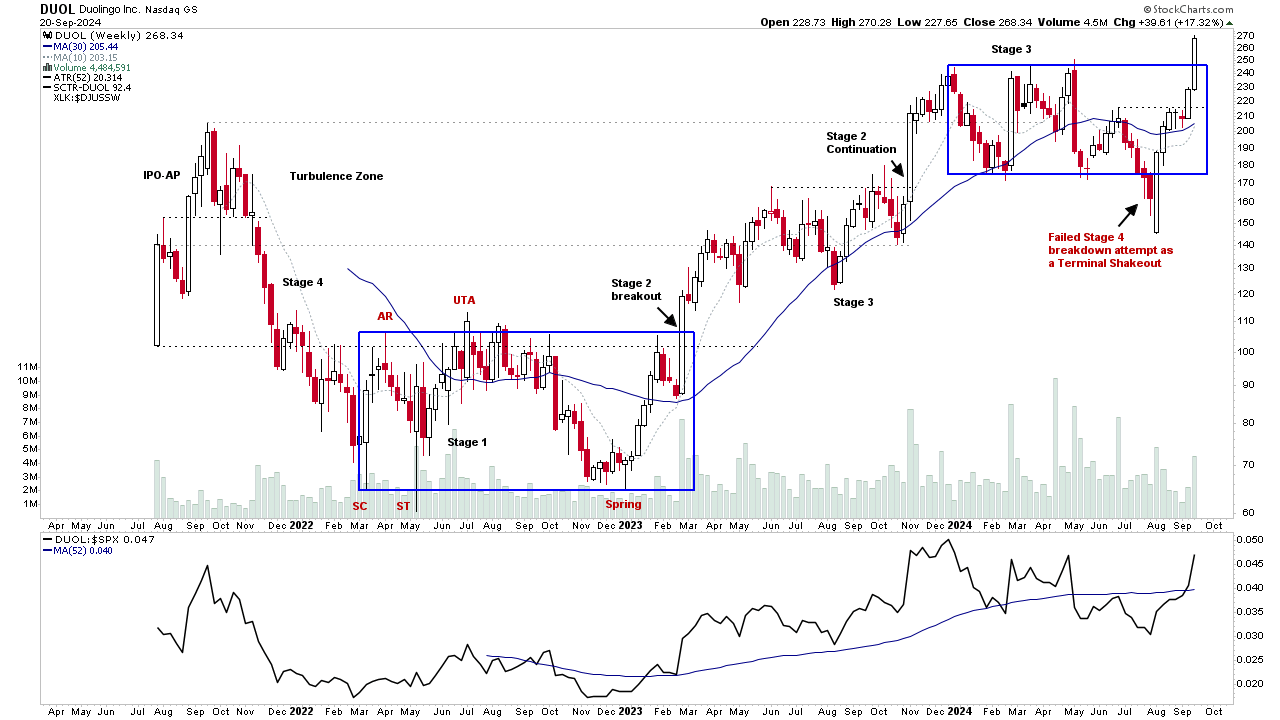
Detailed video walkthrough of the four Stages via the real world example of Duolingo (DUOL) from it's IPO in 2021 to late 2024 when it made a further Stage 2 continuation breakout to new all time highs at the time for the stock...
Read More

Blog
Learn the incredibly popular Stage Analysis method to gain an edge in your stock trading and investing. This video course makes no assumptions of prior experience of the Stage Analysis method or even any prior stock trading and investing knowledge.
We begin with the very basics and foundations of Stan Weinstein’s classic method, and introduce key concepts in a logical way, through detailed real life examples of stocks charts in the different stages. Taking you from complete beginner to some expert level Stage Analysis concepts. And so, by the end of the course you will be completely comfortable trading and investing using the Stage Analysis method and will never look at a stock chart in the same way again!
What you’ll learn
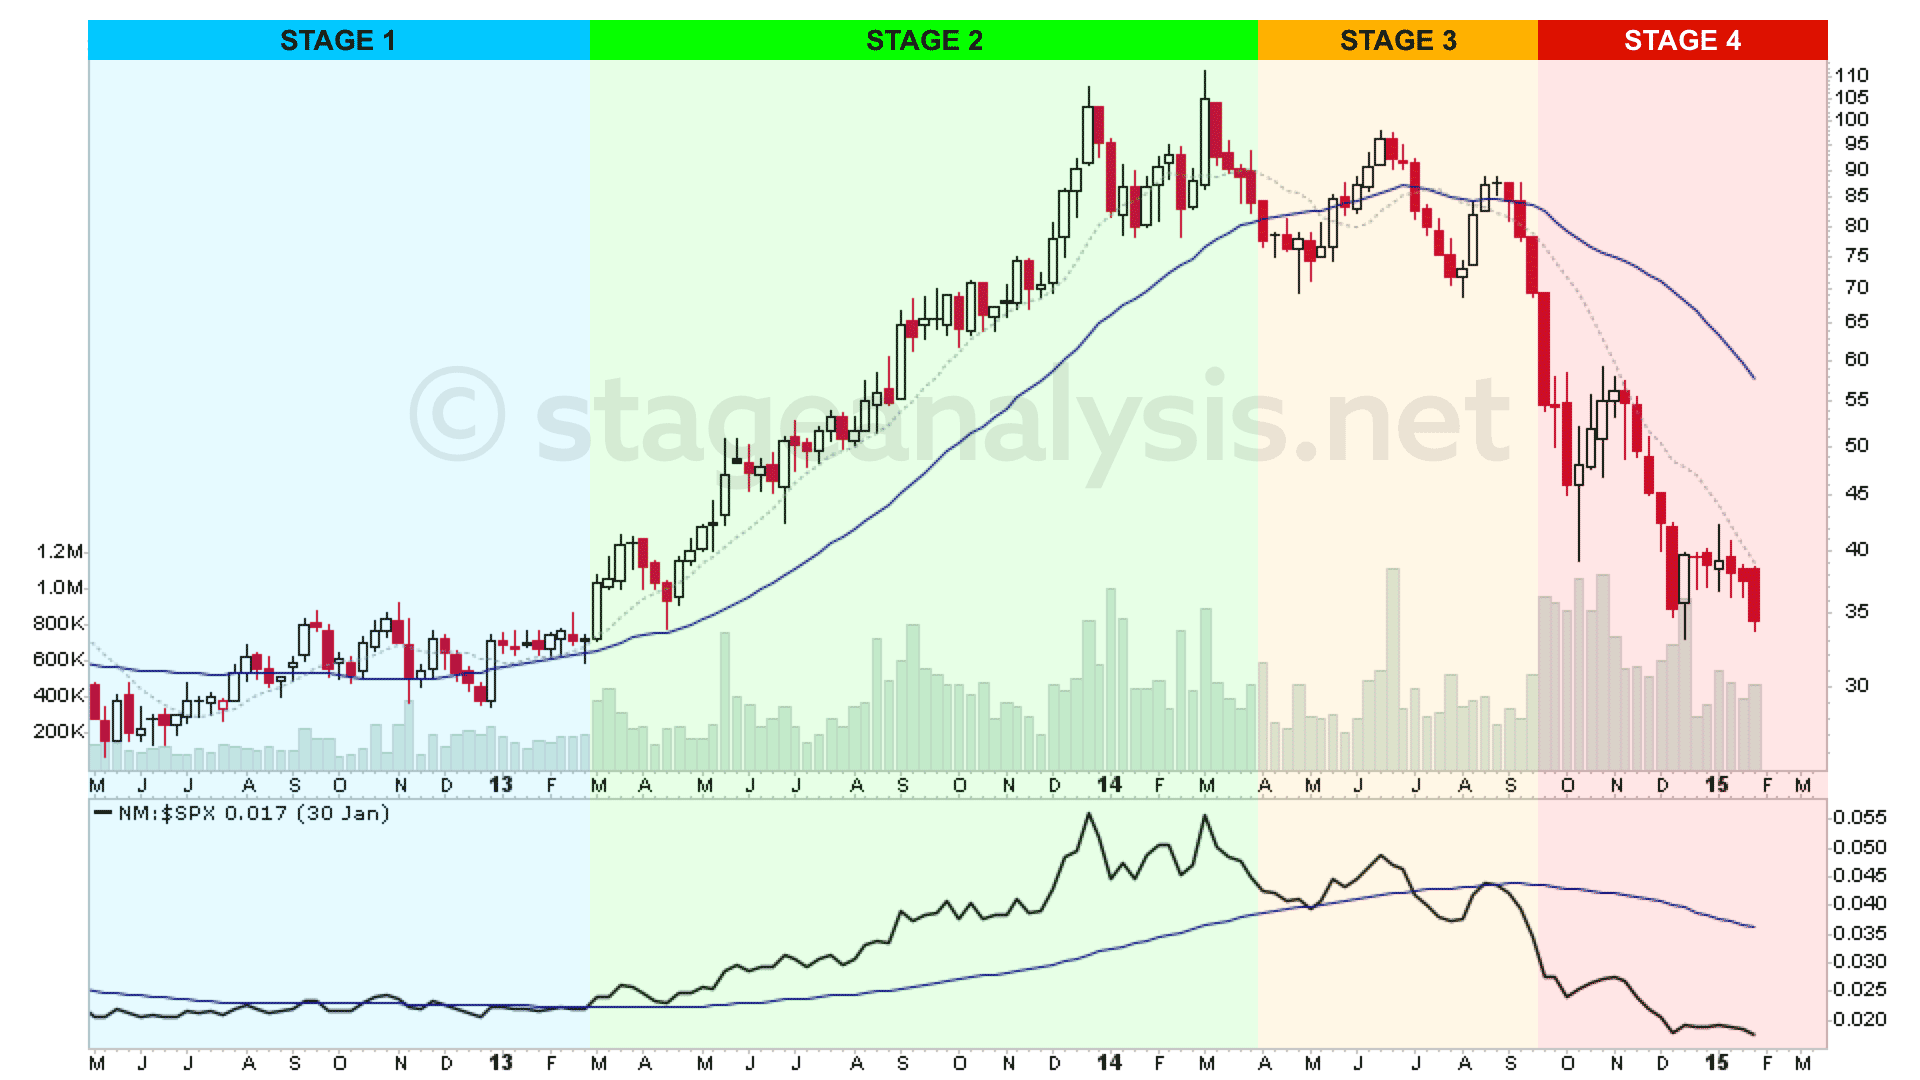
- Learn the Four Stages of the Stan Weinstein’s Stage Analysis Method
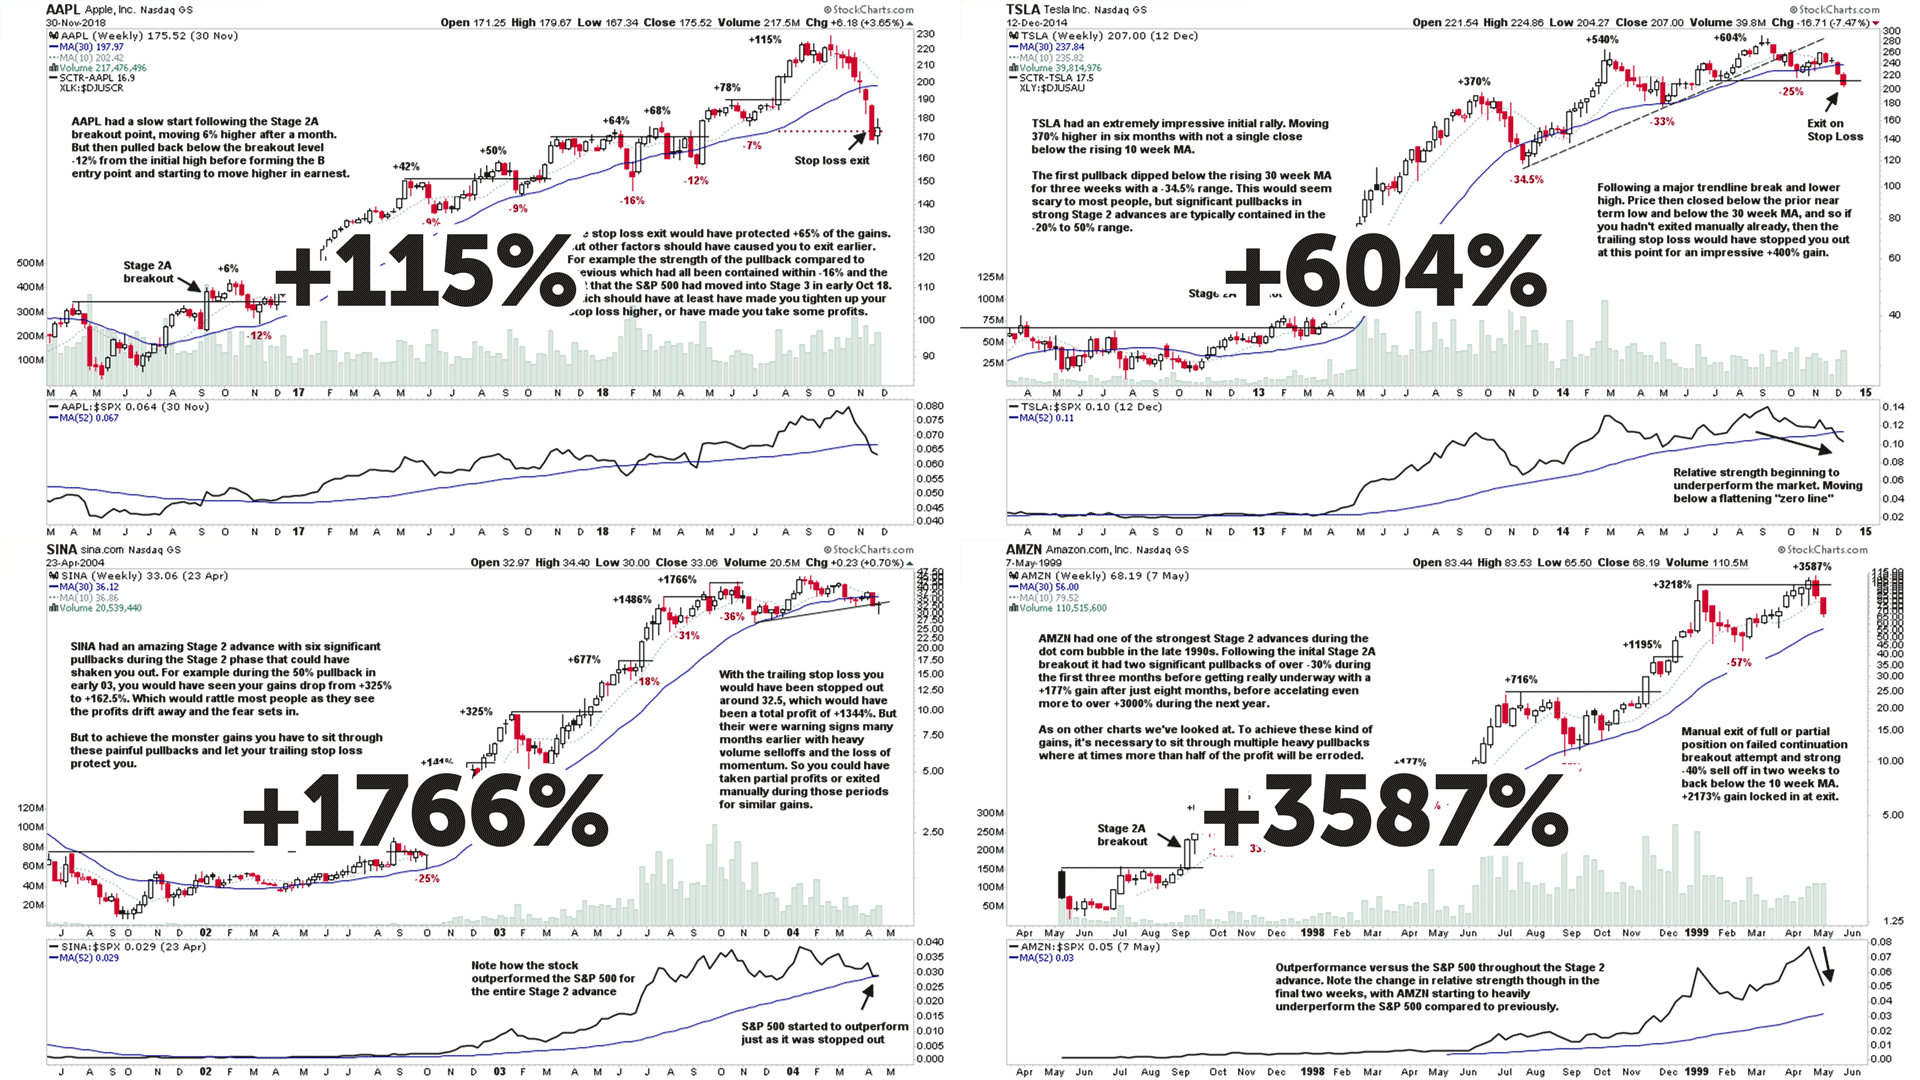
- The Stage Analysis Investor & Trader Methods – When to Buy, and When to Sell for Maximum Gains
- The Key Components of the Stage Analysis Method to Find the Stocks With the A+ Potential
- A Classic Technical Analysis Method That Will Let You Enter and Exit Stock Trades With Confidence
- Learn the Ideal Stage 2 Entry Points to Maximise Profit Potential and Minimise Risk
Start learning today: https://www.udemy.com/course/l...
23 September, 2025
Learn Stage Analysis: DUOL – IPO to Late 2024
03 March, 2025
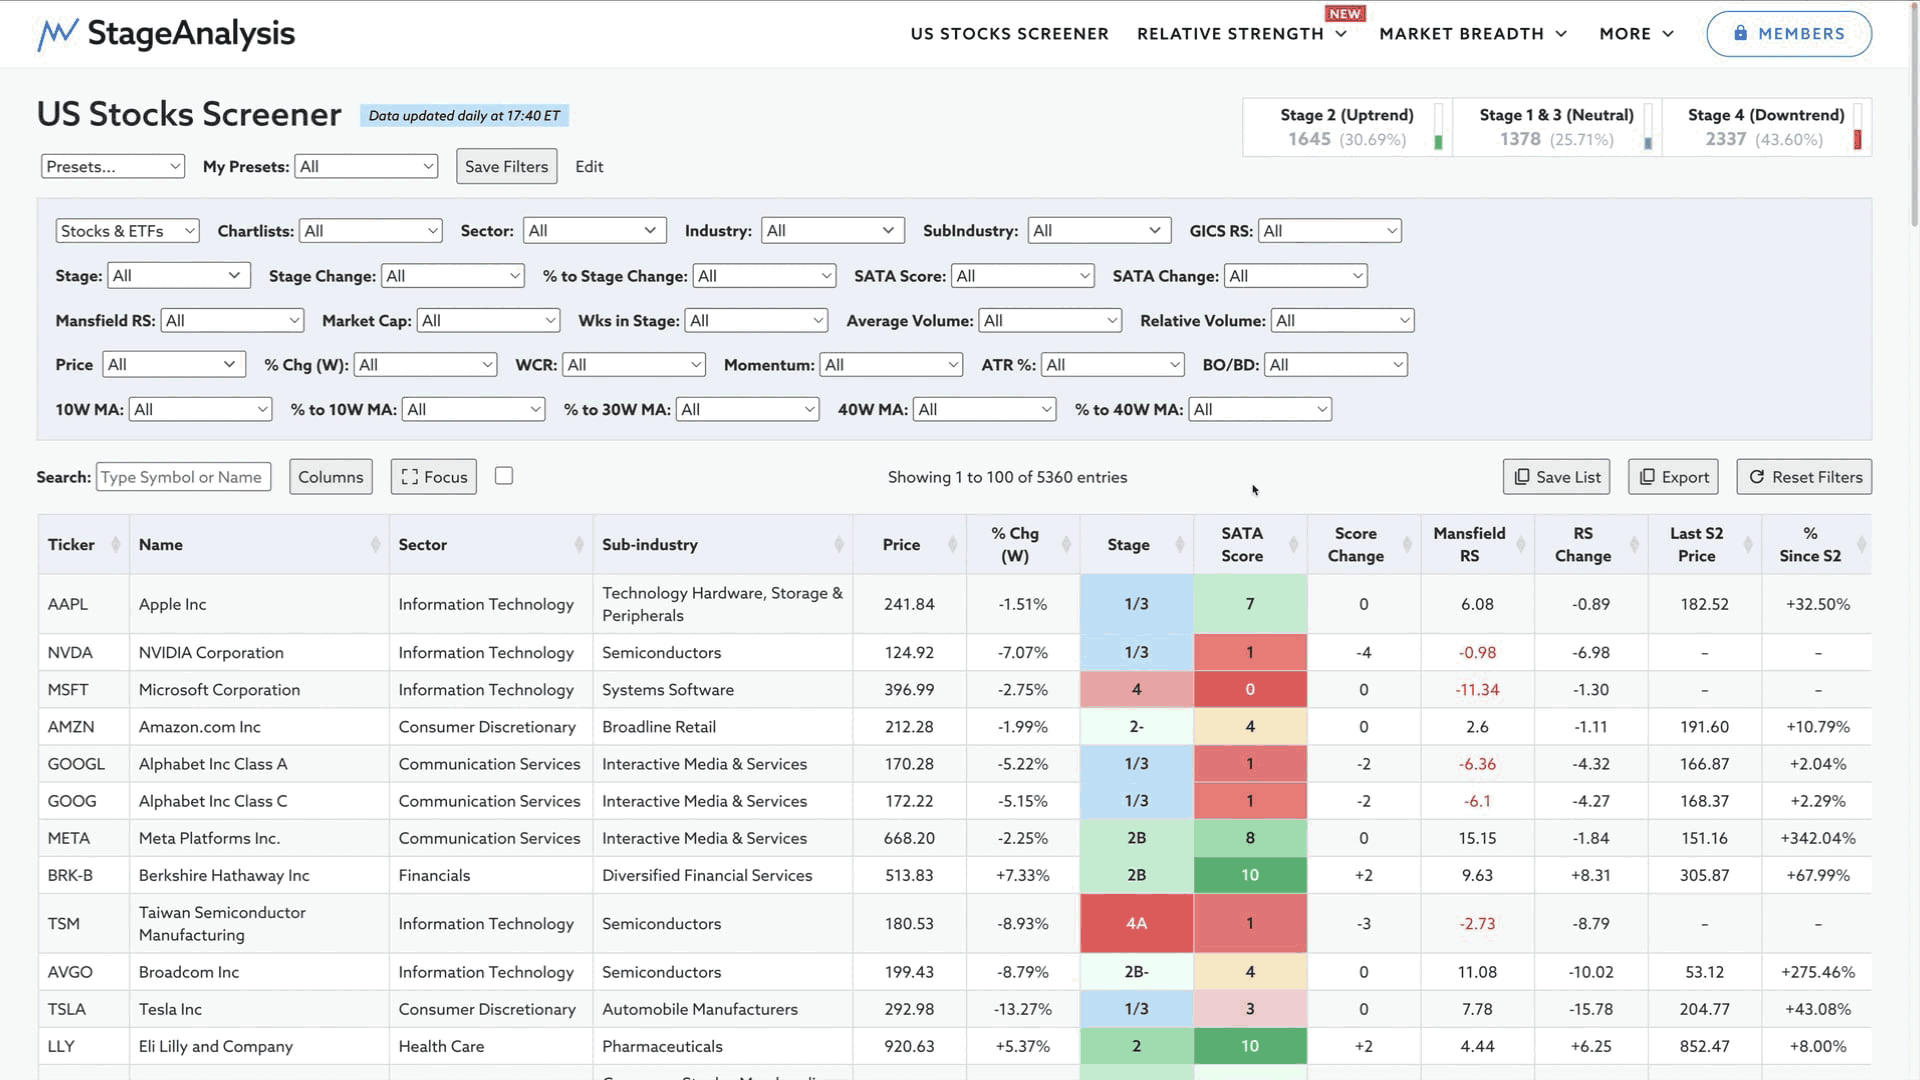
Video: How to Use the Stage Analysis Screener – 3 March 2025
Detailed video explaining the current features available in the Stage Analysis Screener at the time of recording in March 2025 and how to use them, as well as an overview of the various other Stage Analysis tools and features available to the members on the website...
Read More
25 January, 2025
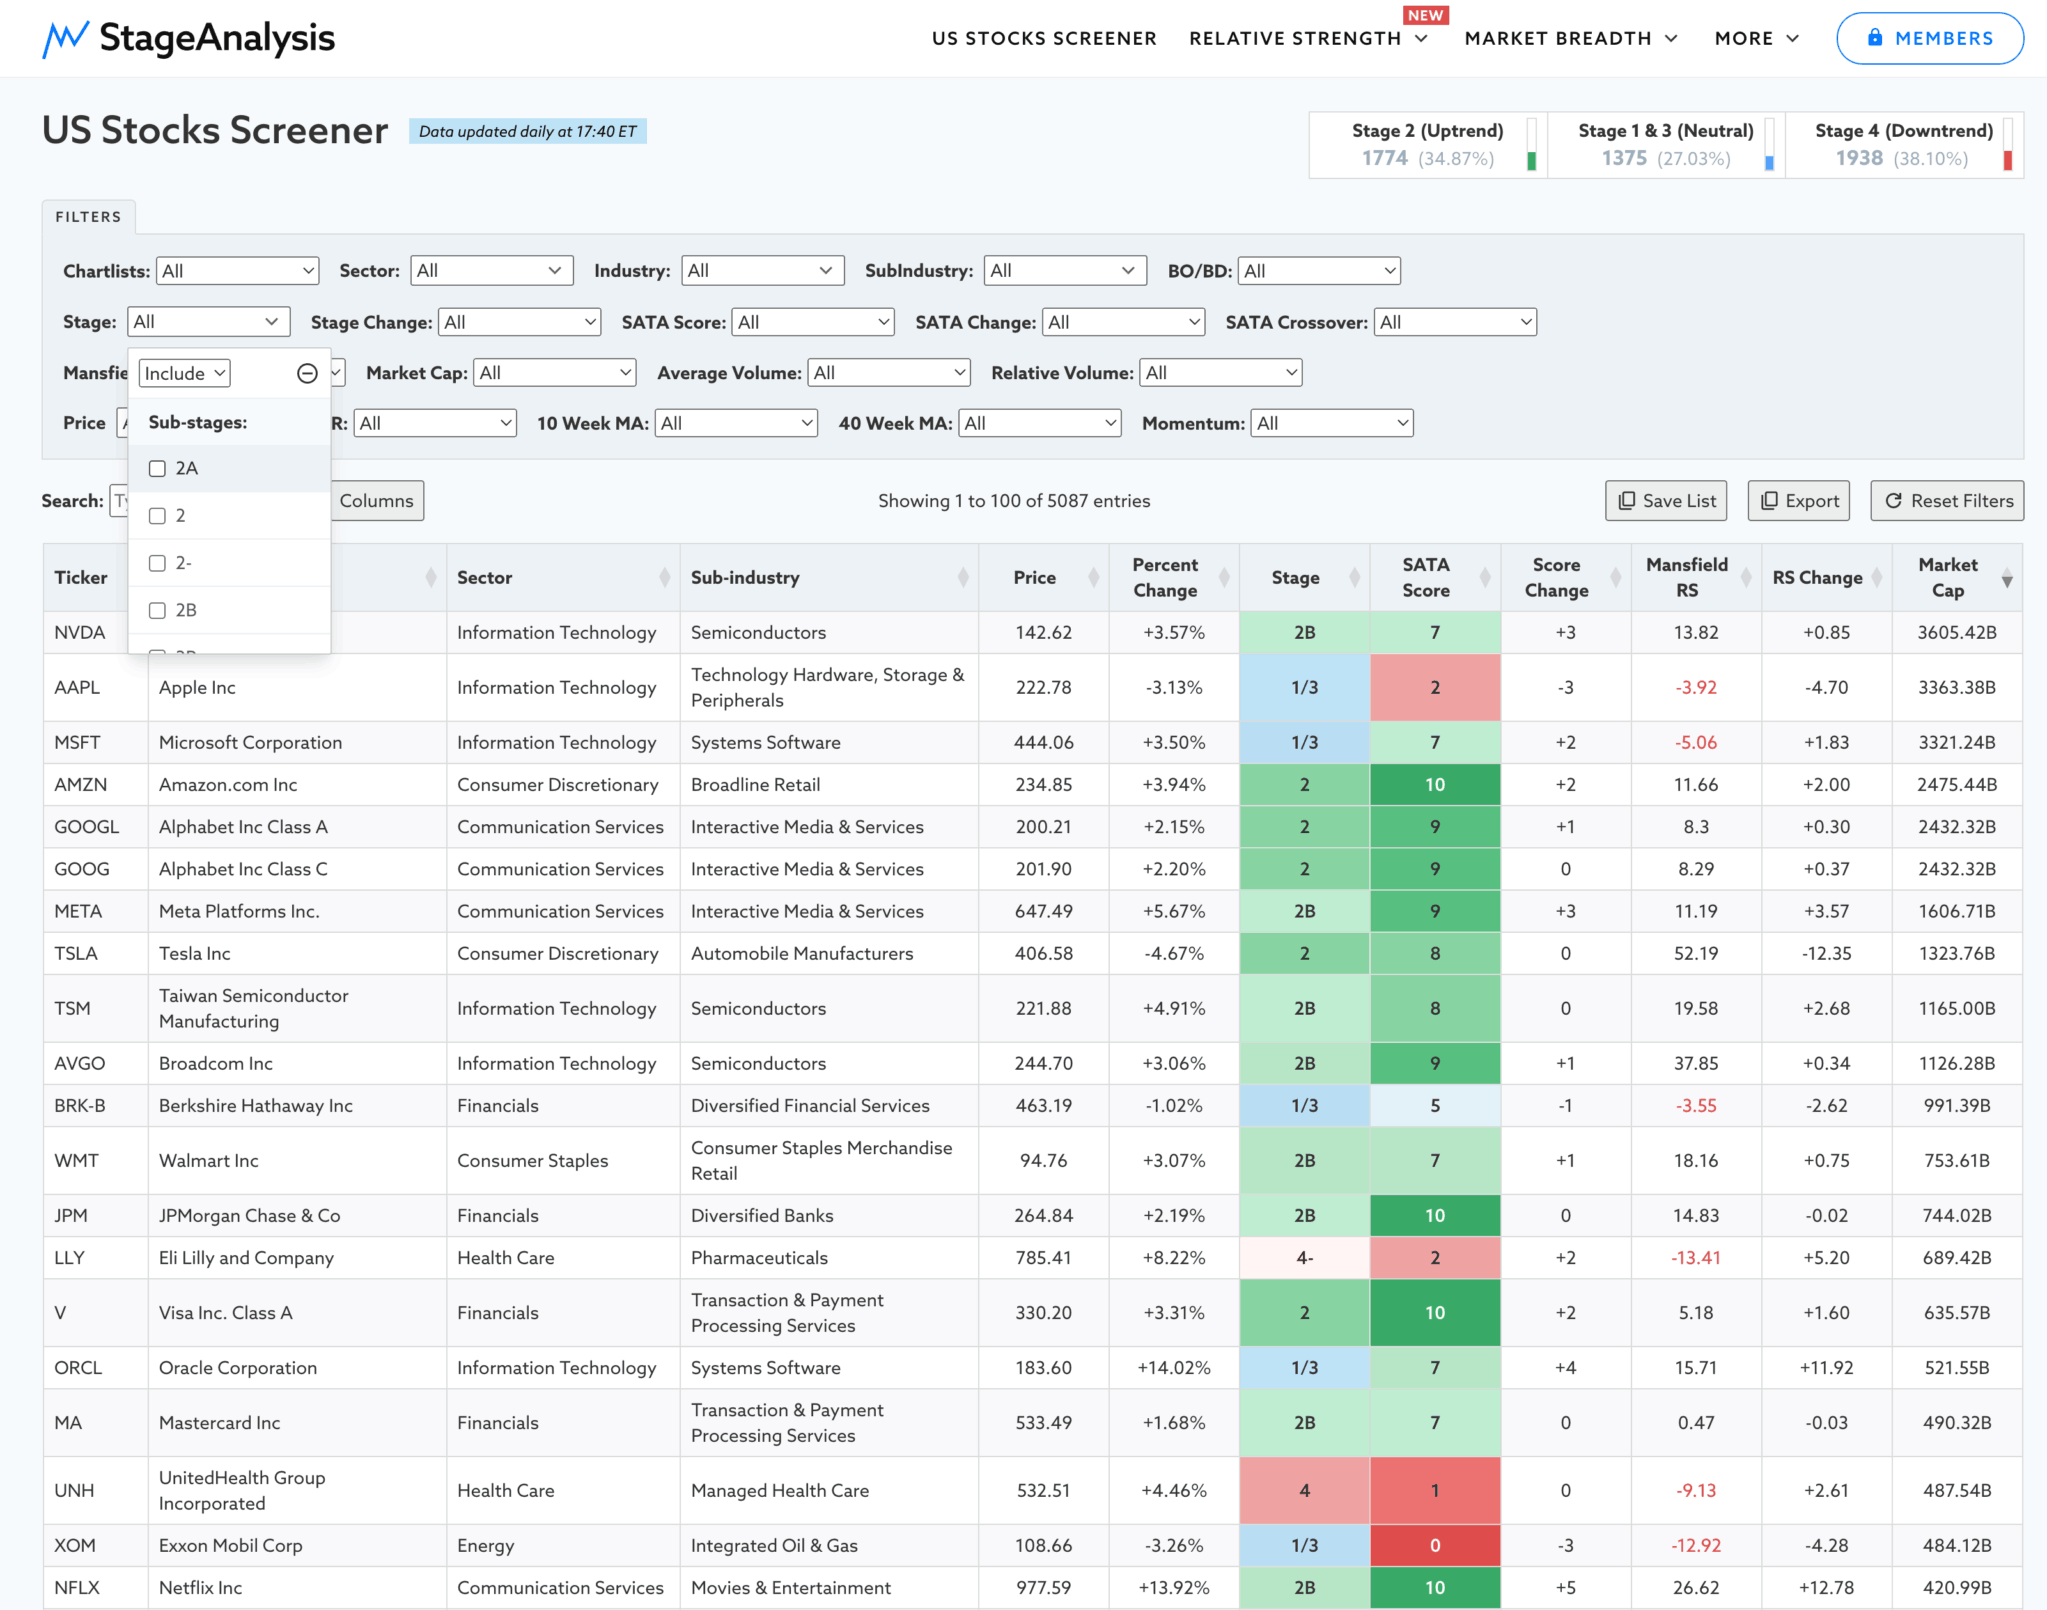
Stan Weinstein's Stages Now Available in Stage Analysis Screener
Stage Analysis members can now scan via the Stages in the Stage Analysis Screener using the Stage filter (on the top left in the second row of the filters on desktop). Which opens a dropdown with the 11 sub-stages available on the site...
Read More
19 September, 2022
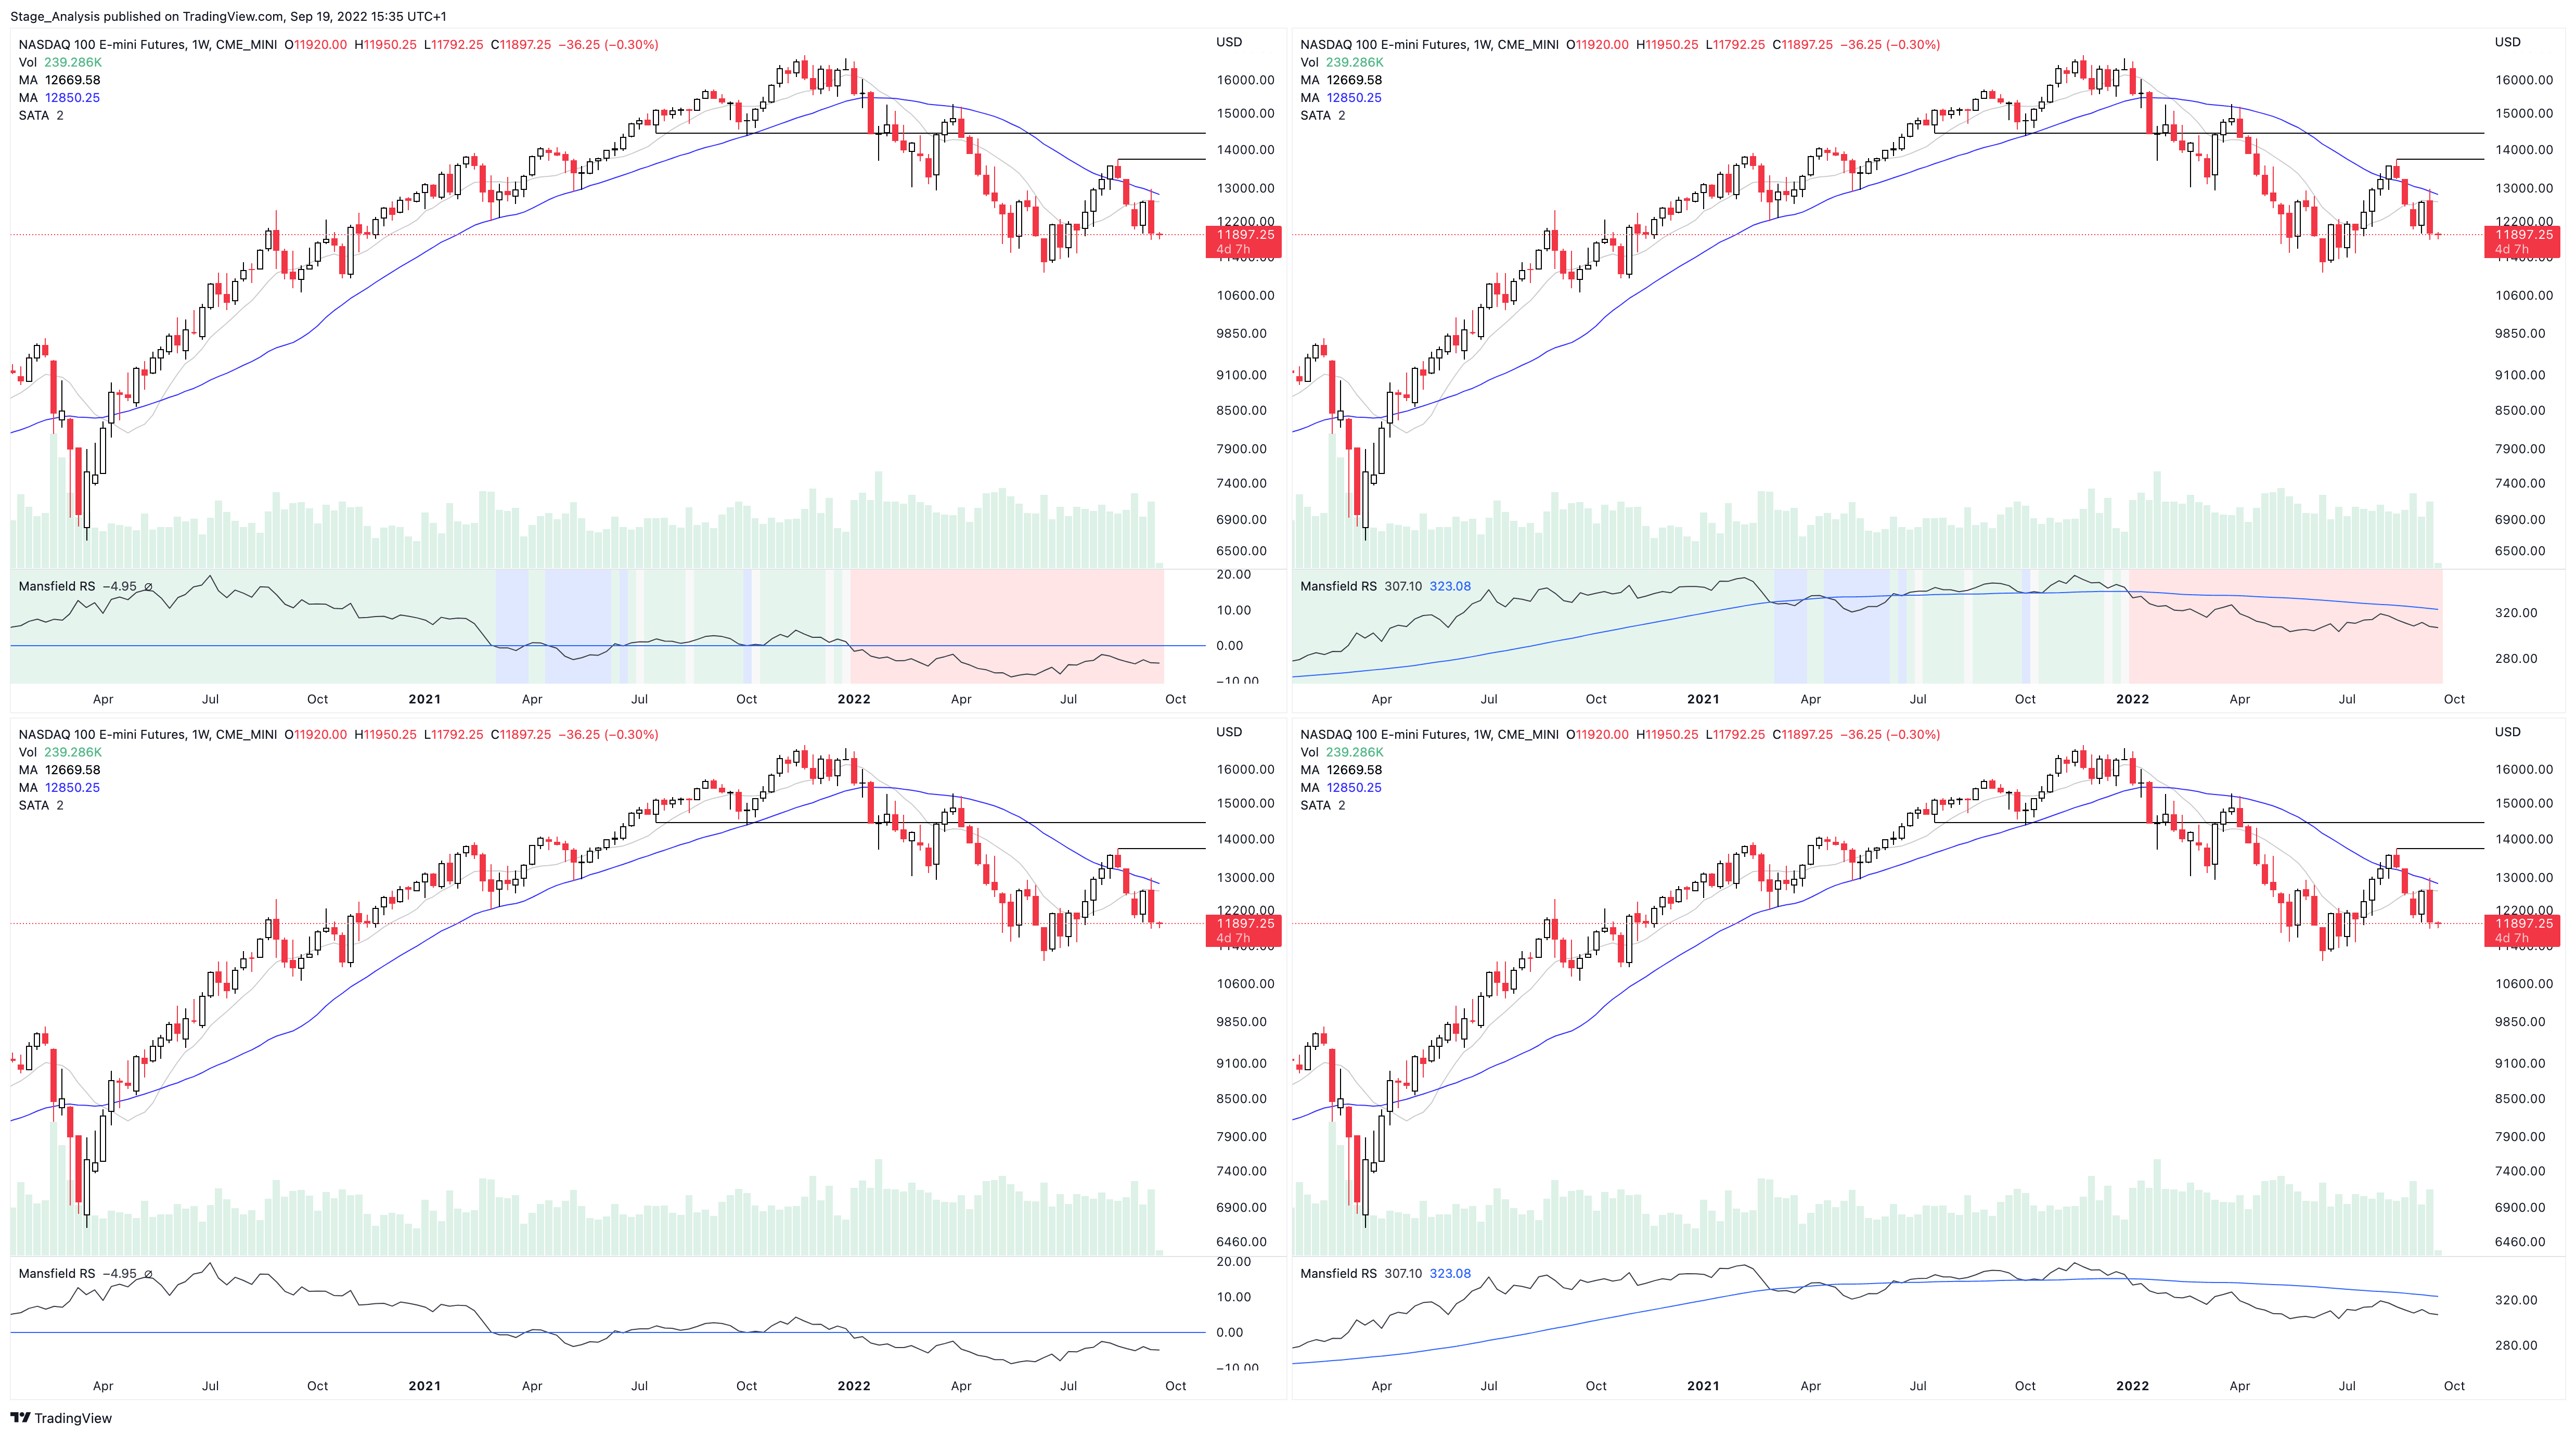
How to Setup the Mansfield Relative Strength Indicator in Tradingview
Relative Strength (RS) comparison to the major stock market indexes with sectors, industry groups and also direct RS comparisons with other stocks, is a core part of Stan Weinstein's Stage Analysis method, and was described in detail in the classic book Stan Weinstein's Secrets For Profiting in Bull and Bear Markets.
Read More
12 September, 2022
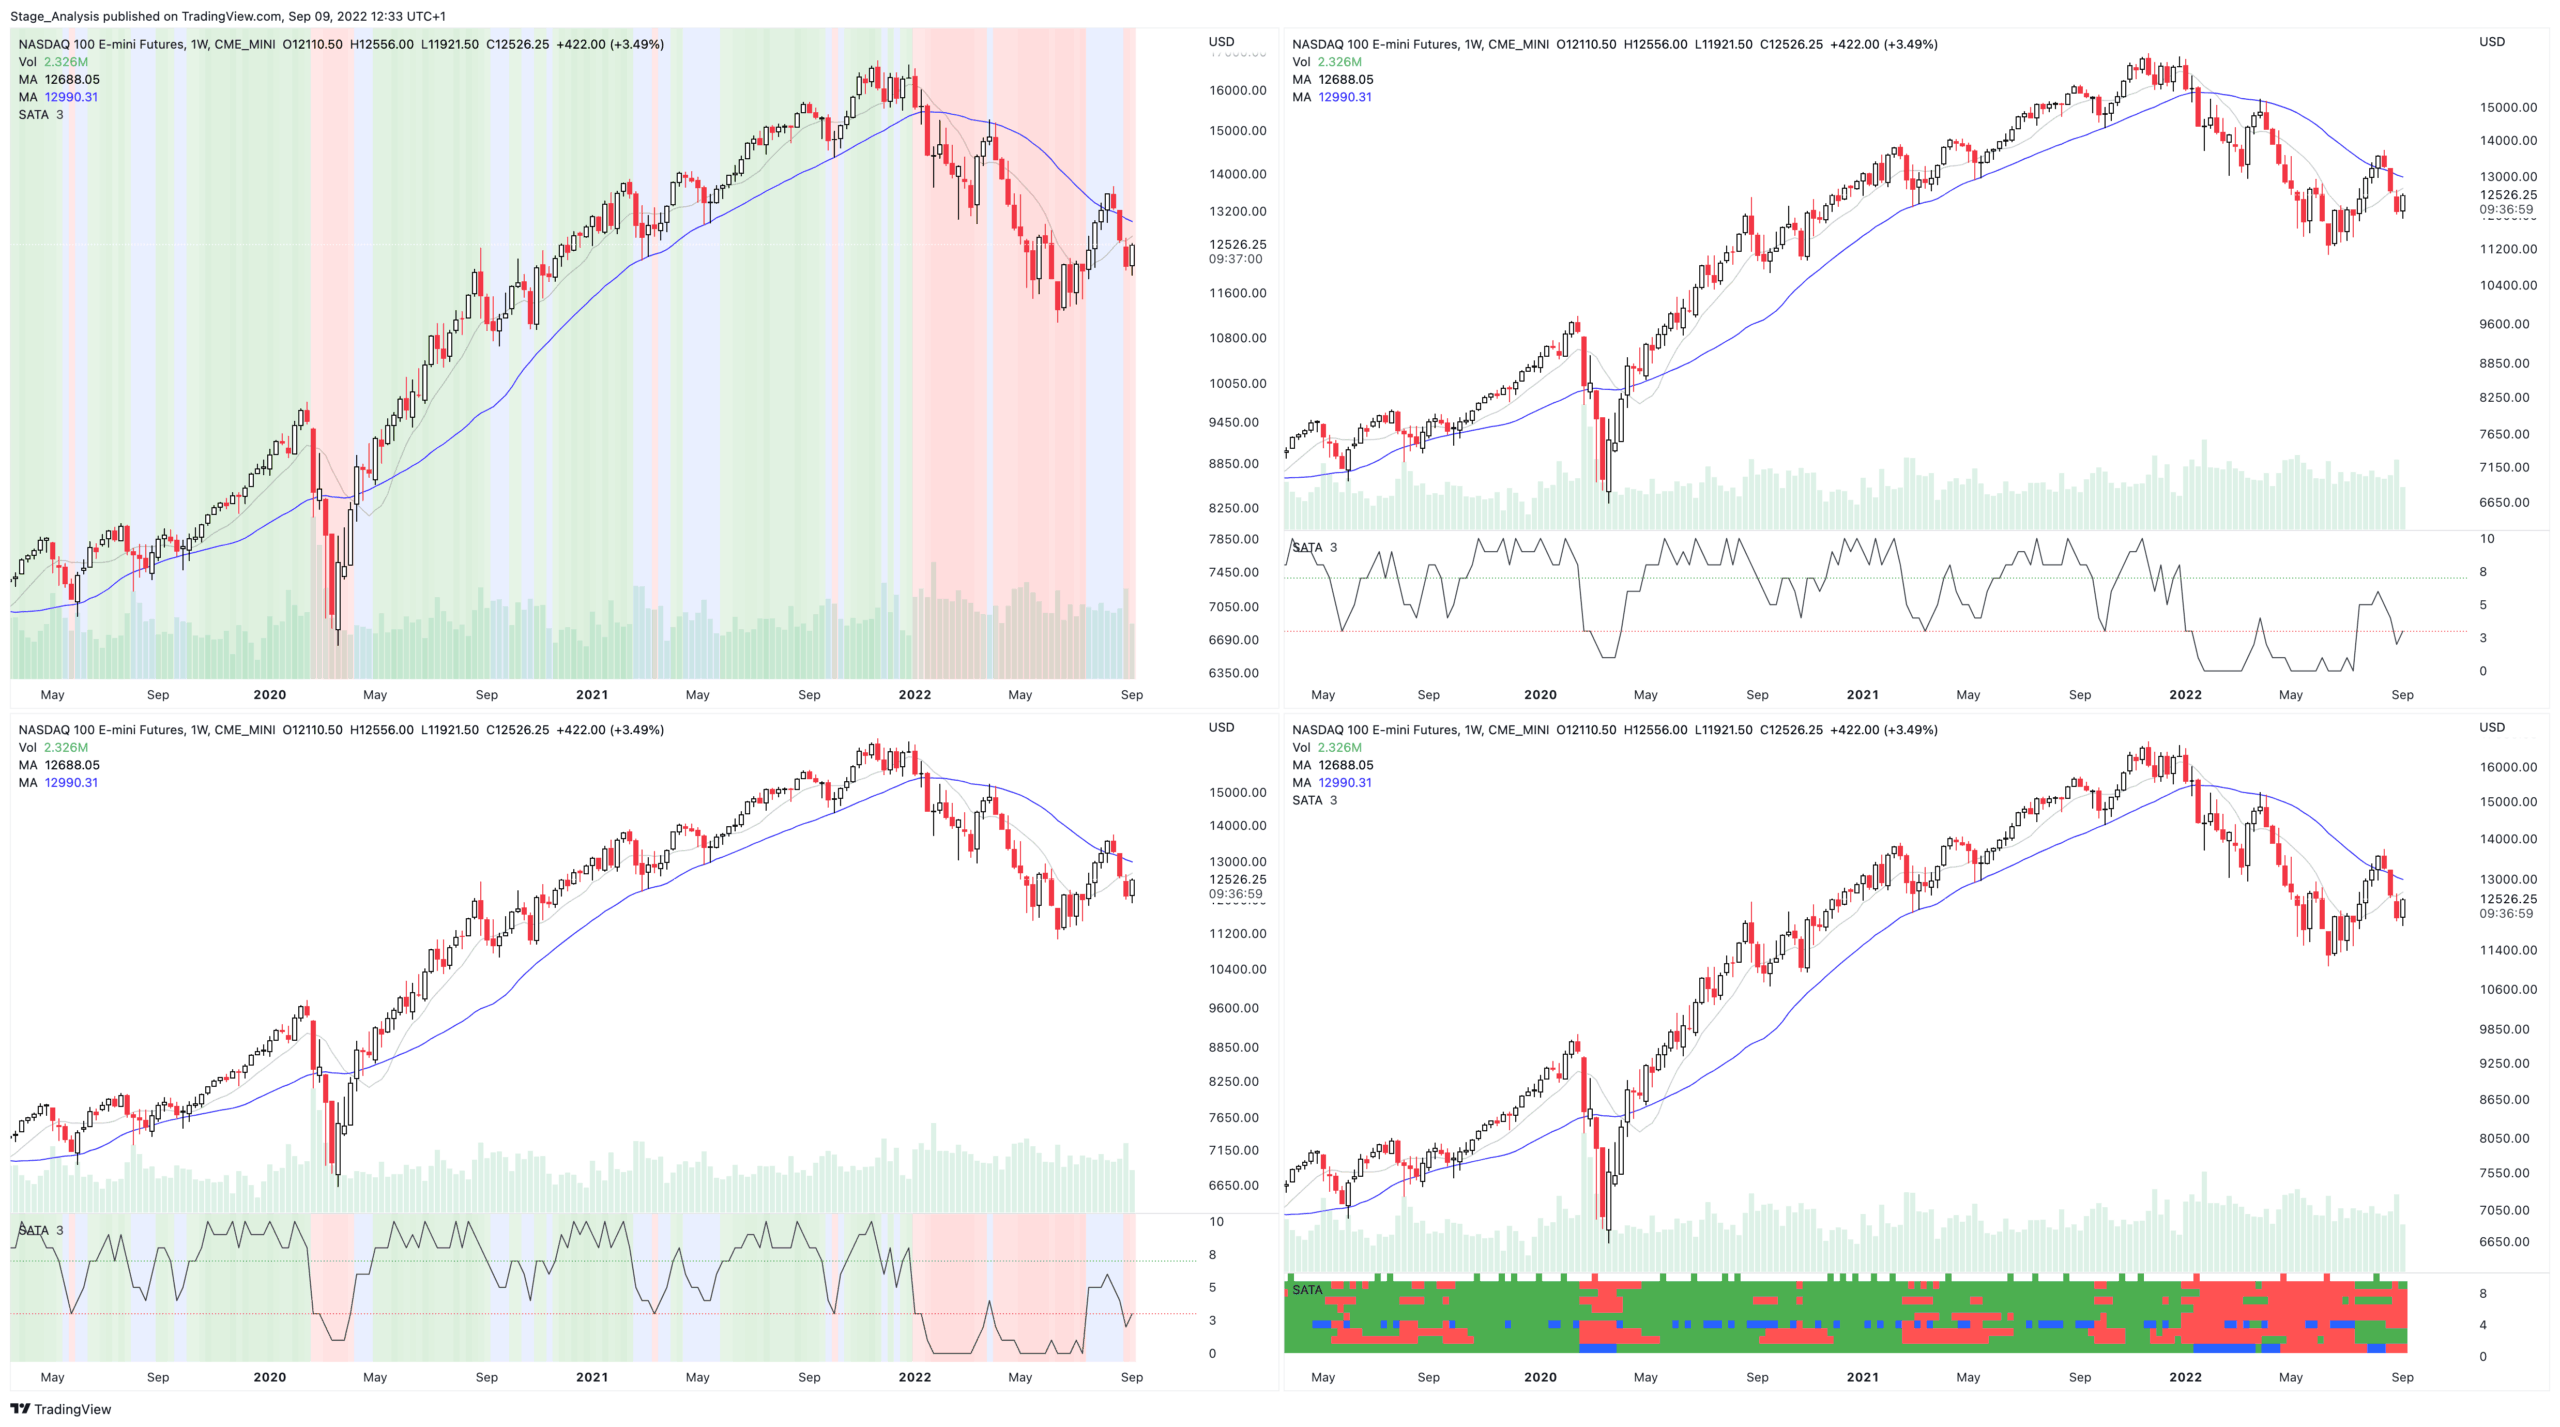
How to setup the SATA: Stage Analysis Technical Attributes Indicator for Tradingview
In this brief 12 minute video I explain some different setup options for the Stage Analysis Technical Attributes (SATA) Indicator, which is available to use for free on Tradingview...
Read More
19 July, 2022
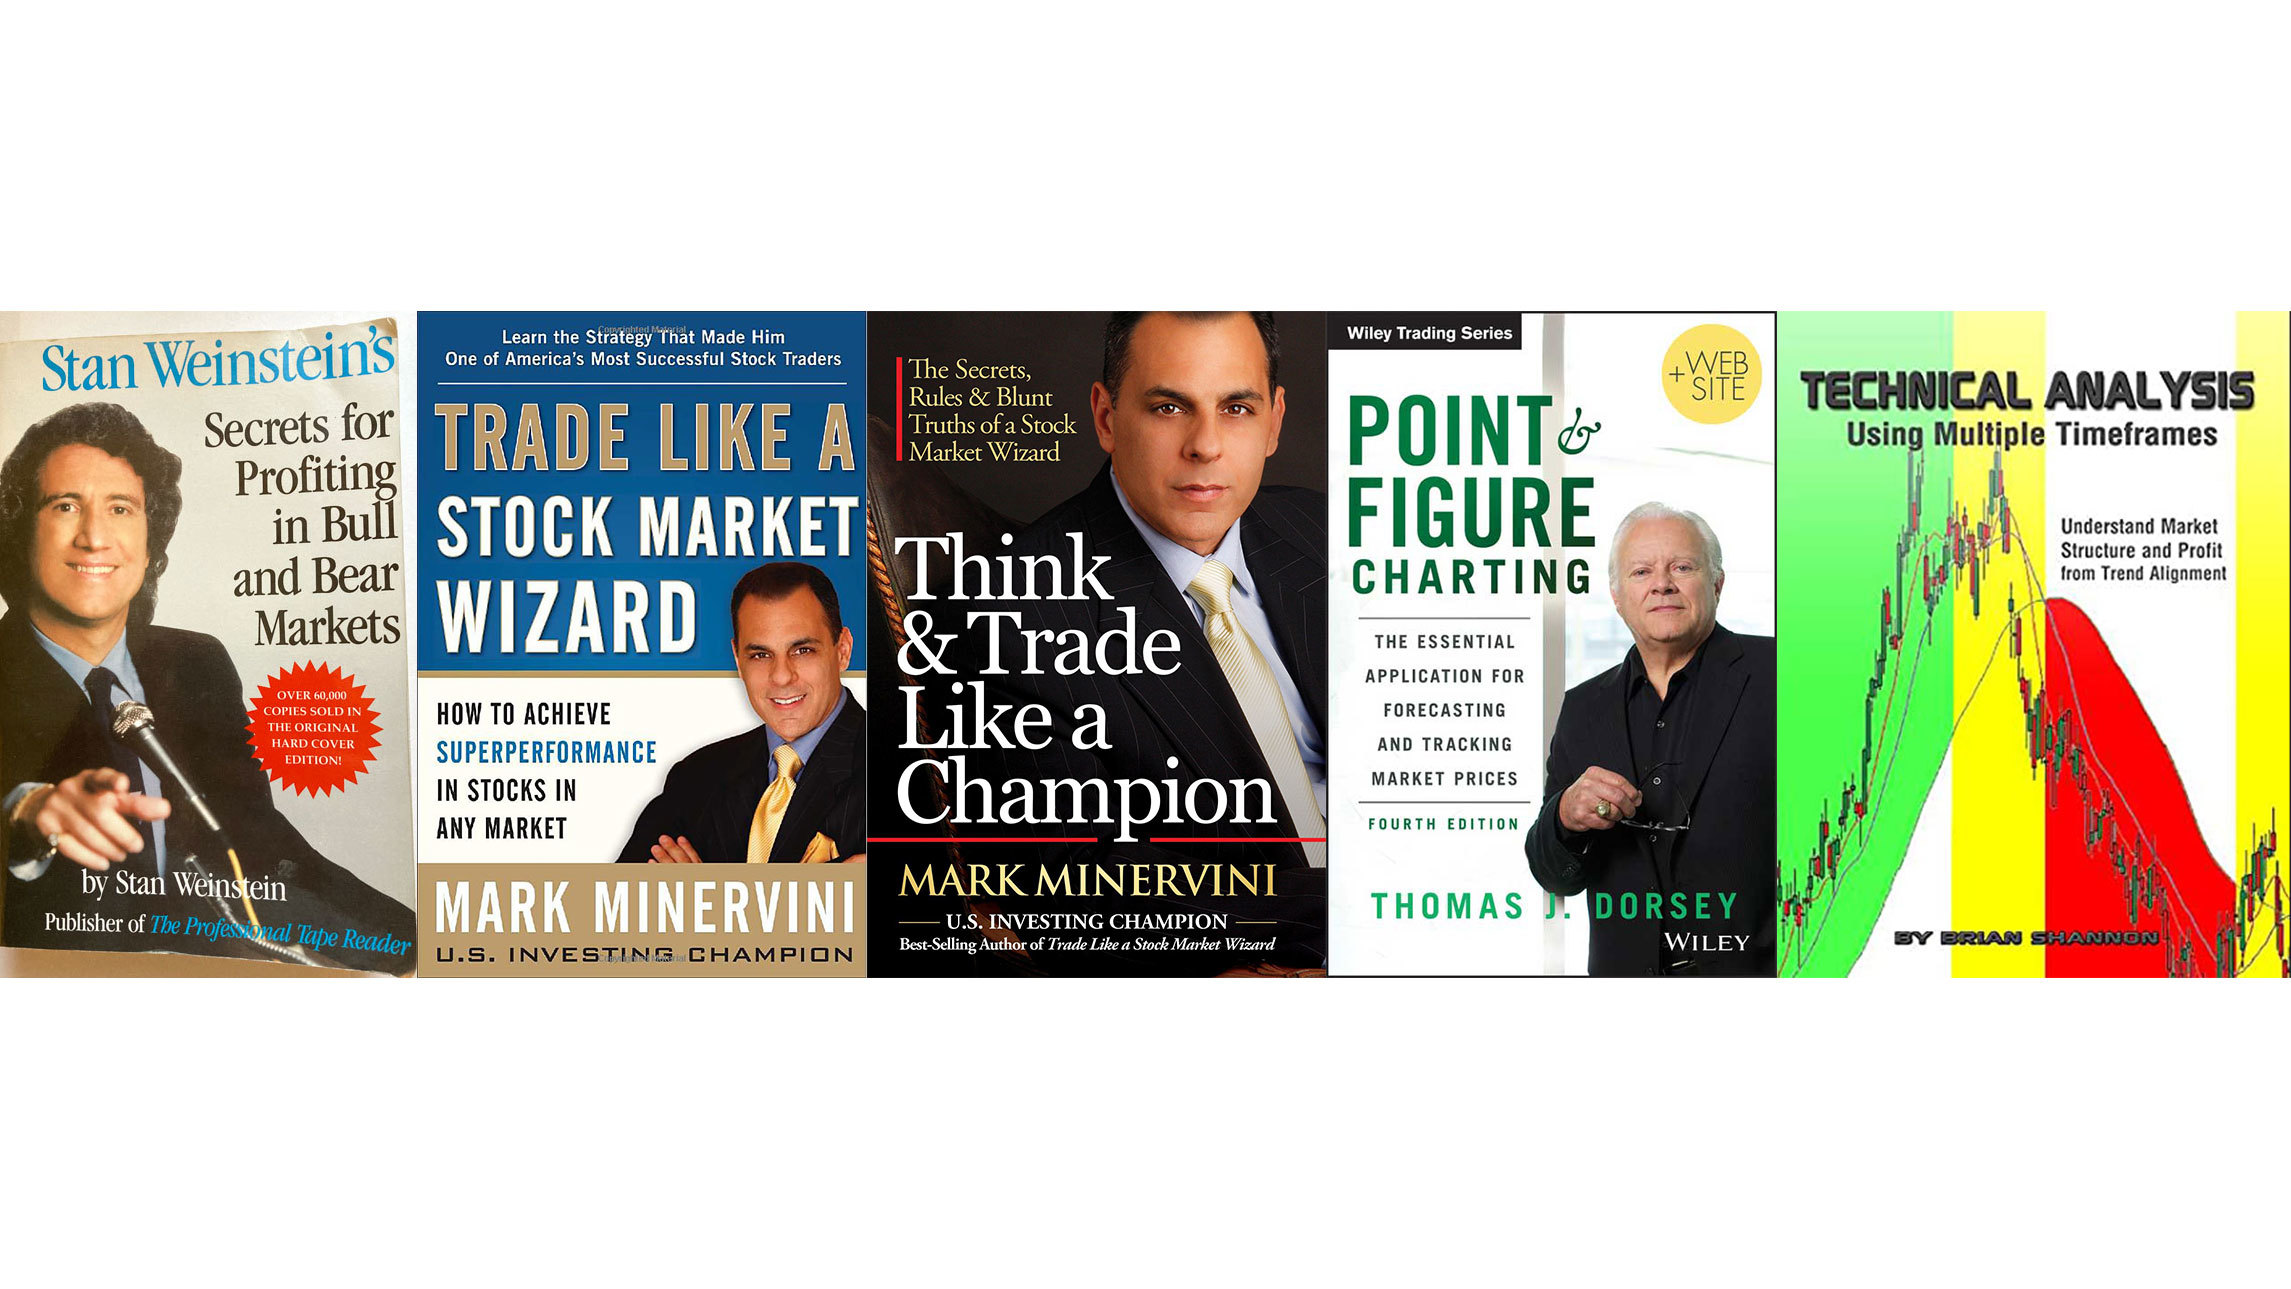
Top 5 Books To Learn Stan Weinstein’s Stage Analysis Method
The Stage Analysis method this website is based upon comes from Stan Weinstein's classic book, which is called Stan Weinstein's Secrets For Profiting in Bull and Bear Markets. The method has stood the test of time through multiple extremes of both bull and bear markets over the last 30+ years; and to this day Stan Weinstein still runs his institutional investment service called the Global Trend Alert – which he launched in the early 1990s.*
Read More
19 July, 2022
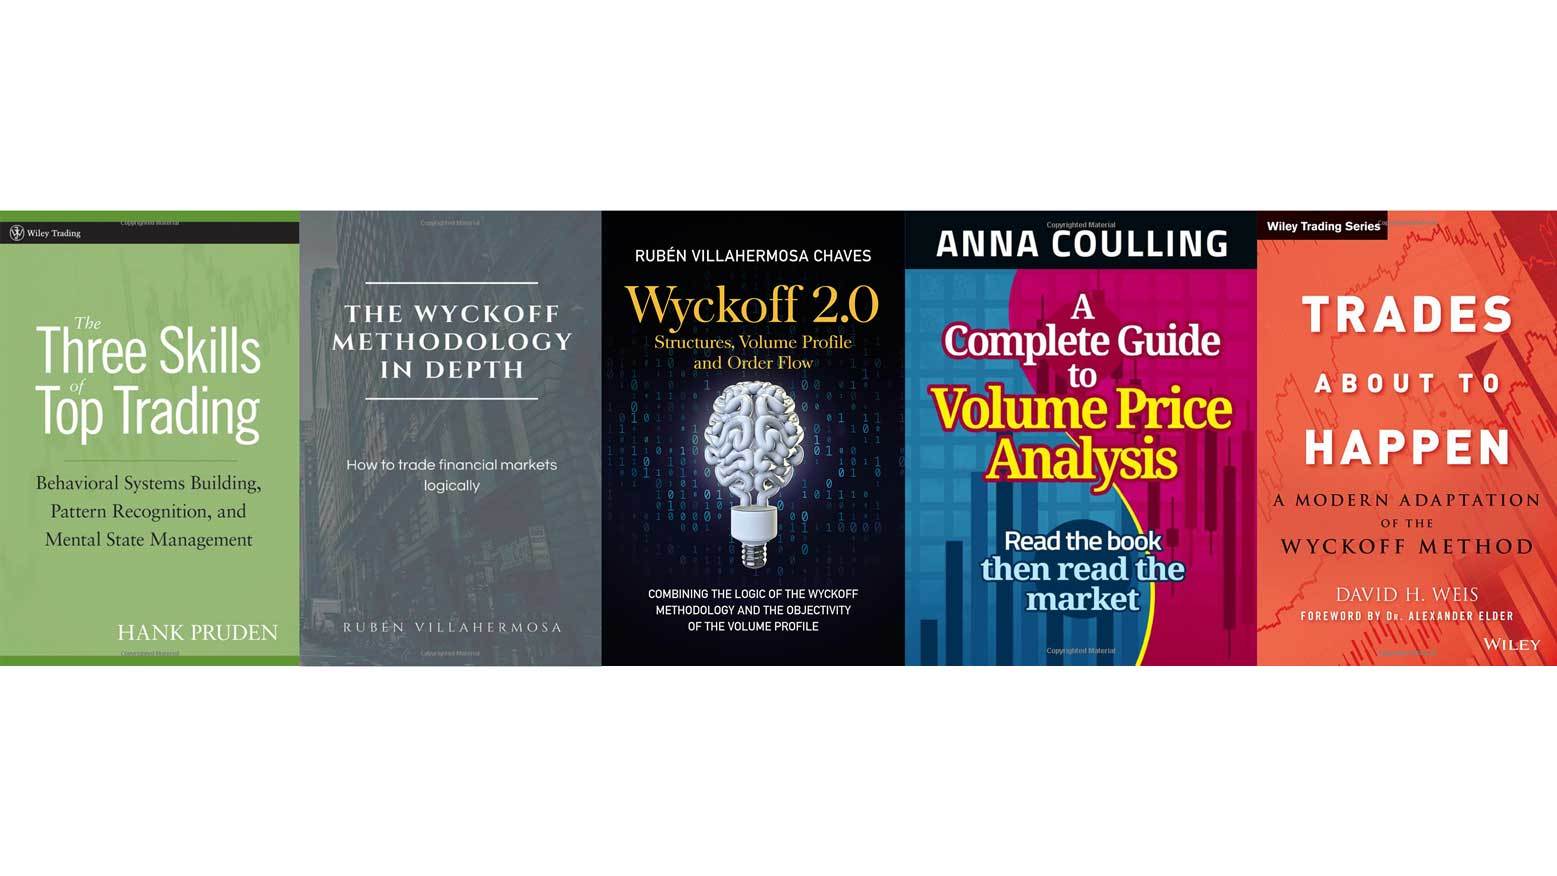
Top 5 Books To Learn the Wyckoff Method
This website is focused on Stan Weinstein's Stage Analysis method. However, as with any method there's a huge amount of crossover with other methods, and one of the most important to learn in order to master Stage Analysis is the Wyckoff method, which was originally created by Richard D. Wyckoff in the early part of the 20th century, and has been expanded by numerous traders over the last 100 years...
Read More
12 July, 2022
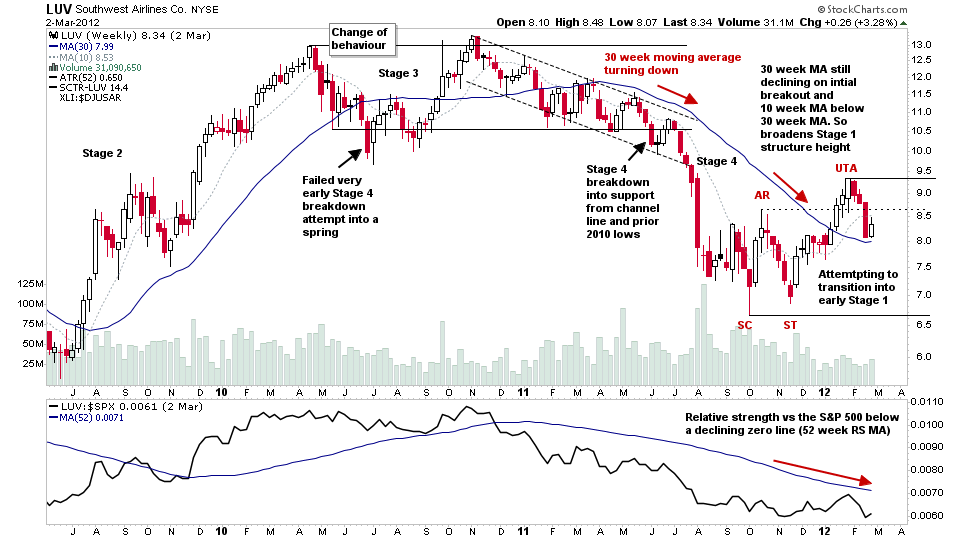
Learn: How Stocks Transition From the Stage 4 Declining Phase to the Stage 1 Basing Phase
One of the hardest aspects of Stan Weinstein's Stage Analysis method is identifying when a stock / etf / index etc is transitioning from one Stage to another. The Stage Analysis Investor method entry points are at the Stage 2 breakout point, and on a successful backup to the Stage 2 breakout following the breakout...
Read More
14 June, 2022
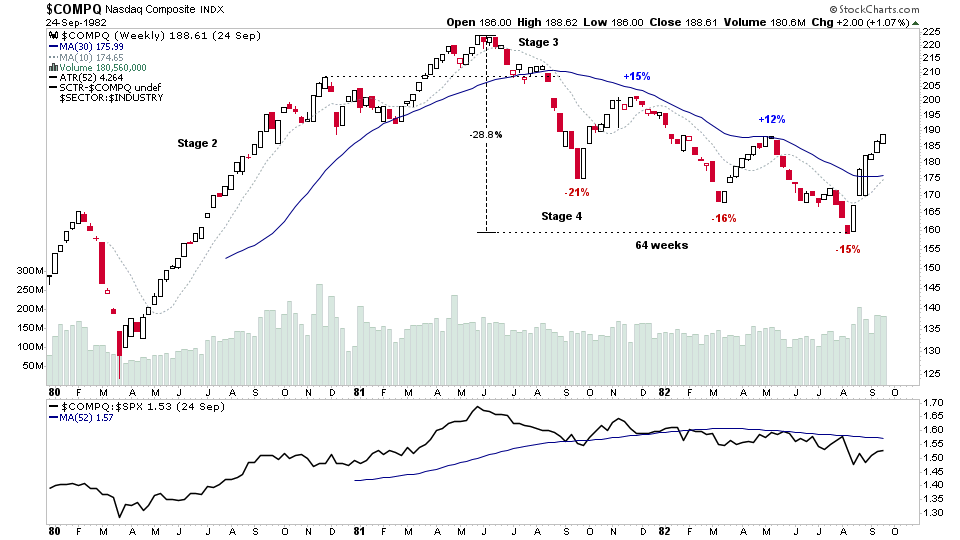
Stock Market Studies: Bear Market – Stage 4 Decline in the Nasdaq Composite – 1981-82
As the majority of the worlds stock markets are currently experiencing an ongoing Stage 4 declining phase. I thought it would be interesting and useful to have a look back at the significant Stage 4 declines since the early 1980s – of which there have been 16 including the current Stage 4 decline...
Read More

03 April, 2022
Stan Weinstein Interview - 2 April 2022 (2hrs 28mins)
Listen to a Q&A with Stan Weinstein that was done on Twitter Spaces on Saturday 2nd April 2022 by George Noble. Which is an in-depth discussion with Stan on parts of the method, current themes etc. The best interview since the Financial Sense interview series back in 2011-13.
Read More