
Stock Market Studies: Bear Market – Stage 4 Decline in the Nasdaq Composite – 1981-82
The full post is available to view by members only. For immediate access:
This is the first in a new series of posts analysing significant historical Bear Markets, which from the Stan Weinstein Stage Analysis method perspective are called Stage 4 declines.
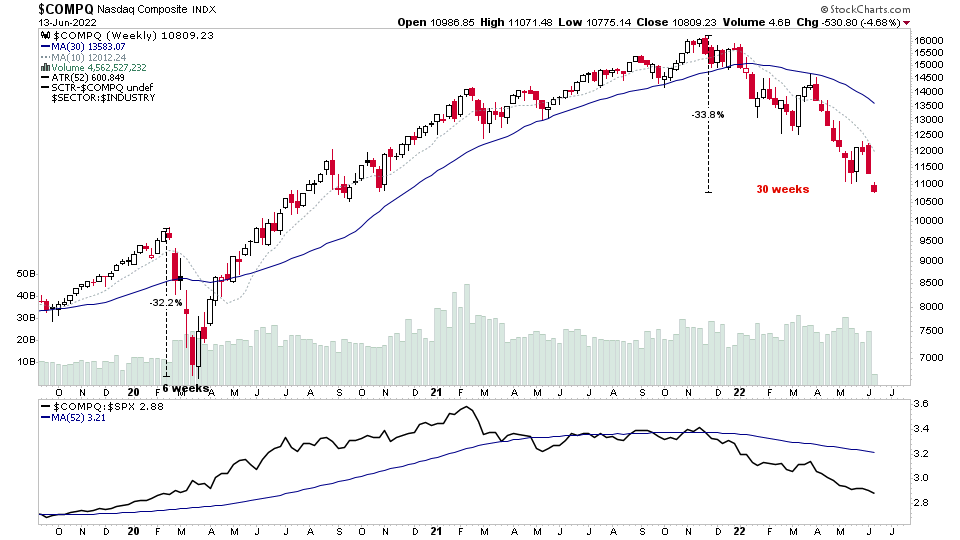
As the majority of the worlds stock markets are currently experiencing an ongoing Stage 4 declining phase (see Stan Weinstein's Stage Analysis - Definitions of the Stages and Sub-stages for more information and marked up charts on the major four Stages). I thought it would be interesting and useful to have a look back at the significant Stage 4 declines over the years – of which for example there have been 16, including the current Stage 4 decline (shown above) since the early 1980s. As too often stock traders and investors only focus on the most recent history, and hence fail to learn the lessons of the past.
Mark Twain once said, “History never repeats itself, but it often rhymes”. Which is true of the stock market also, as while no technical pattern or price structure is the same. You'll note as you look through thousands of charts over time that they do show striking resemblances to each other, which you'll see by the end of this series of posts is also true for Stage 4 declines in the stock market indexes.
I've chosen the Nasdaq Composite (Nasdaq) for this analysis. As it's become one of the most important indexes in modern times with the majority of the mega cap technology stocks listing on it, and it covers more than 3,000 stocks at this time.
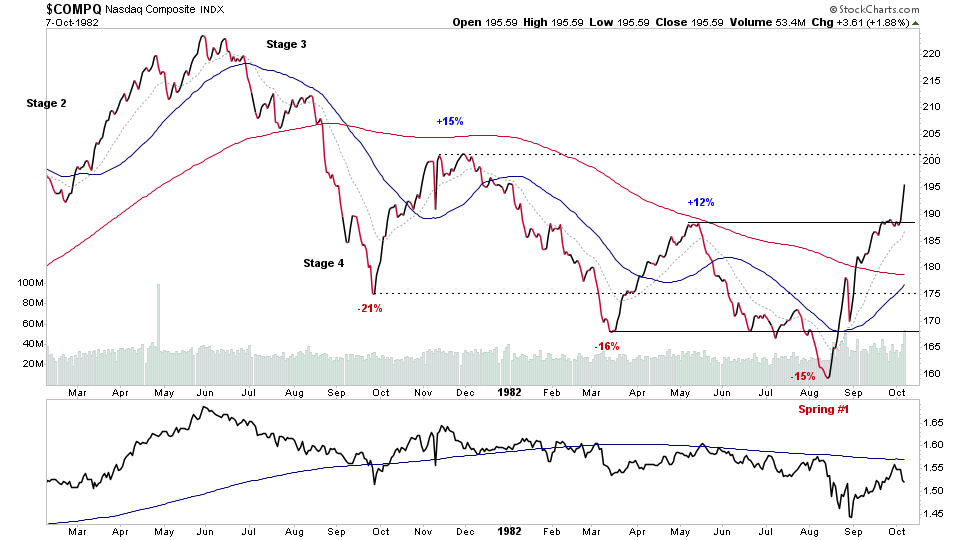
1981-82: Stage 4 Decline
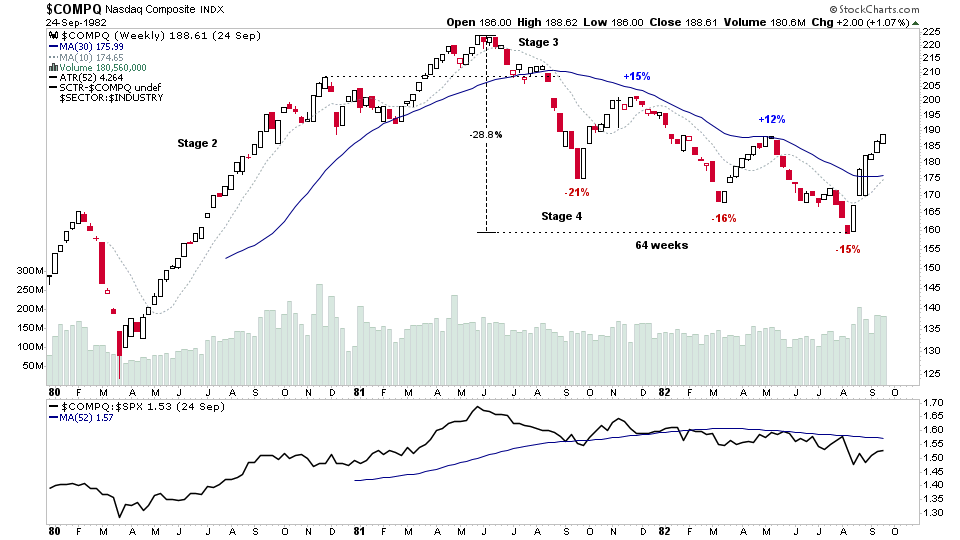
The 1981-82 bear market decline began with a small head and shoulder pattern that formed the Stage 3 top over a period of around 5-6 months. However, it wasn't clear that it was a Stage 3 pattern in the Nasdaq until around 8 weeks before the index broke down into a Stage 4 decline, and even then it could have easily still been mistaken for late Stage 2, which is known as Stage 2B. However, there were subtle differences between the pattern and the prior base, which at first glance had a similar look. As the right shoulder developed at a lower level and close to the 30 week MA, which on the prior base in February 1981 was still strongly rising. And also the Relative Strength line versus the S&P 500 was showing much more weakness by August 1981, as it had been declining for three months, whereas in February 1981 it was actually making a higher high than the price action. So was showing relative strength then versus showing relative weakness in August 1981.
Become a Stage Analysis Member:
To see more like this – US Stocks watchlist posts, detailed videos each weekend, use our unique Stage Analysis tools, such as the US Stocks & ETFs Screener, Charts, Market Breadth, Group Relative Strength and more...
Join Today
Disclaimer: For educational purpose only. Not investment advice. Seek professional advice from a financial advisor before making any investing decisions.