
How to Setup the Mansfield Relative Strength Indicator in Tradingview
19 September, 2022Relative Strength (RS) comparison to the major stock market indexes with sectors, industry groups and also direct RS comparisons with other stocks, is a core part of Stan Weinstein's Stage Analysis method, and was described in detail in the classic book Stan Weinstein's Secrets For Profiting in Bull and Bear Markets.
The Mansfield Relative Strength indicator, otherwise know as the Mansfield RS, was the Relative Strength comparison indicator described in the book, as the charts used in the examples were from the Mansfield charting service – which is no longer around. However, the indicator is easy to create in any charting software as it is simply the stock/S&P 500 (or whatever you choose to compare against) and it then has a 52 week simple moving average overlaid, to identify when the stock is underperforming or outperforming.
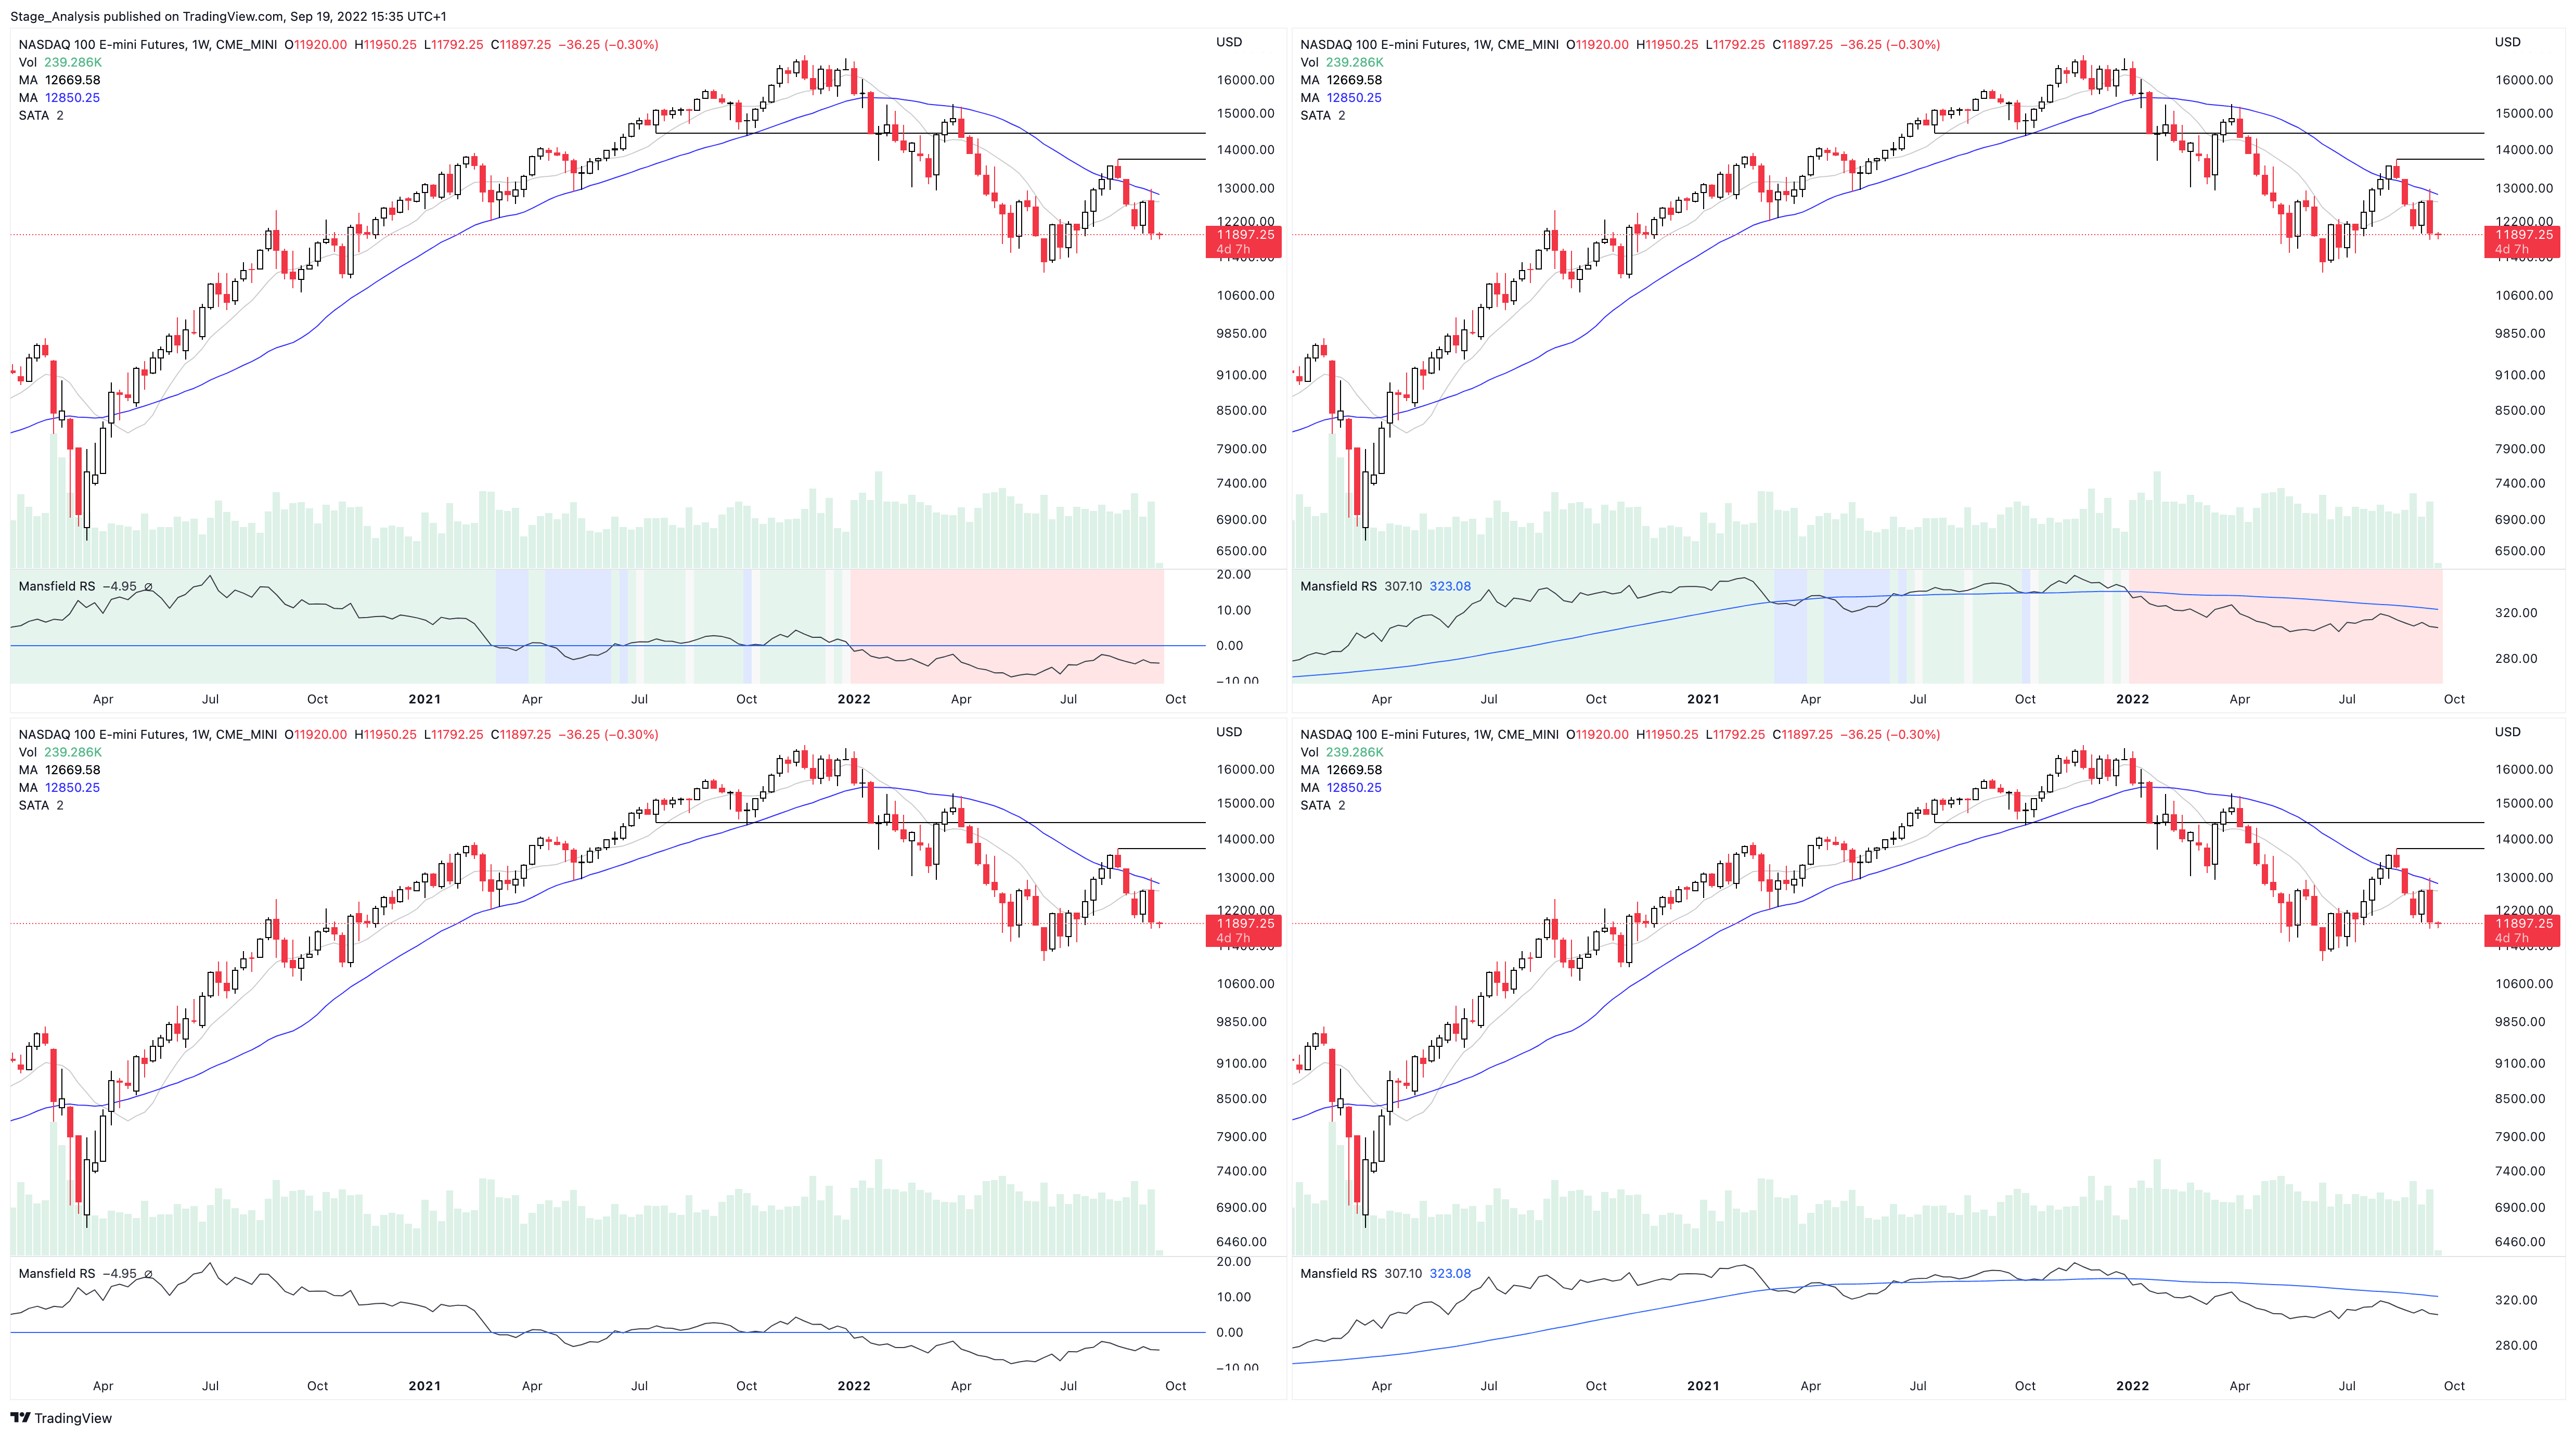
In the original Mansfield RS indicator, the 52 week RS MA was then flattened, by dividing the RS line by the 52 week RS MA, and then a horizontal line was added at the zero level. Which turns it into an oscillator, and gives a RS score which you can then compare any stock against to see its relative strength.
You can learn more about the calculation and what it is in the previous article from many years ago here: How to create the Mansfield Relative Strength Indicator
Setting up the Mansfield RS indicator in Tradingview
You can add the Mansfield Relative Strength by clicking on the indicators button in the Tradingview chart window and then in the community scripts search for Mansfield Relative Strength (Original Version) by stageanalysis and add it to your favourites.
When you first add the indicator is has a coloured background, with a green tint for a postive RS score, and a red tint for a negative RS score. Plus blue and gray tints for periods when the RS MA is still rising or falling, by the RS line has crossed it. However, the colored background can be turned off, or edited in the indicator settings, in the Style tab. So you can change the colors or remove it and just have the RS line and zero line showing. Both of which can also be edited in the settings.
Change the symbol that it compares against. The default is the S&P 500. But for crypto you might want to use Bitcoin for example. Or you might want to compare against competing stocks in the same peer group, or against the industry group or sector. The choice is yours. But the S&P 500 is a universal measure for the Mansfield RS. So I would recommend leaving it on that unless you have a particular reason to change it as mentioned.
MA Length is also an editable setting. So it will affect the values of the Mansfield RS if you change it. 52 is the default setting, and is set as such for the weekly chart. So I'd recommend not editing it on the weekly chart, but for other timeframes, different settings can be used.
How to use the Indicator:
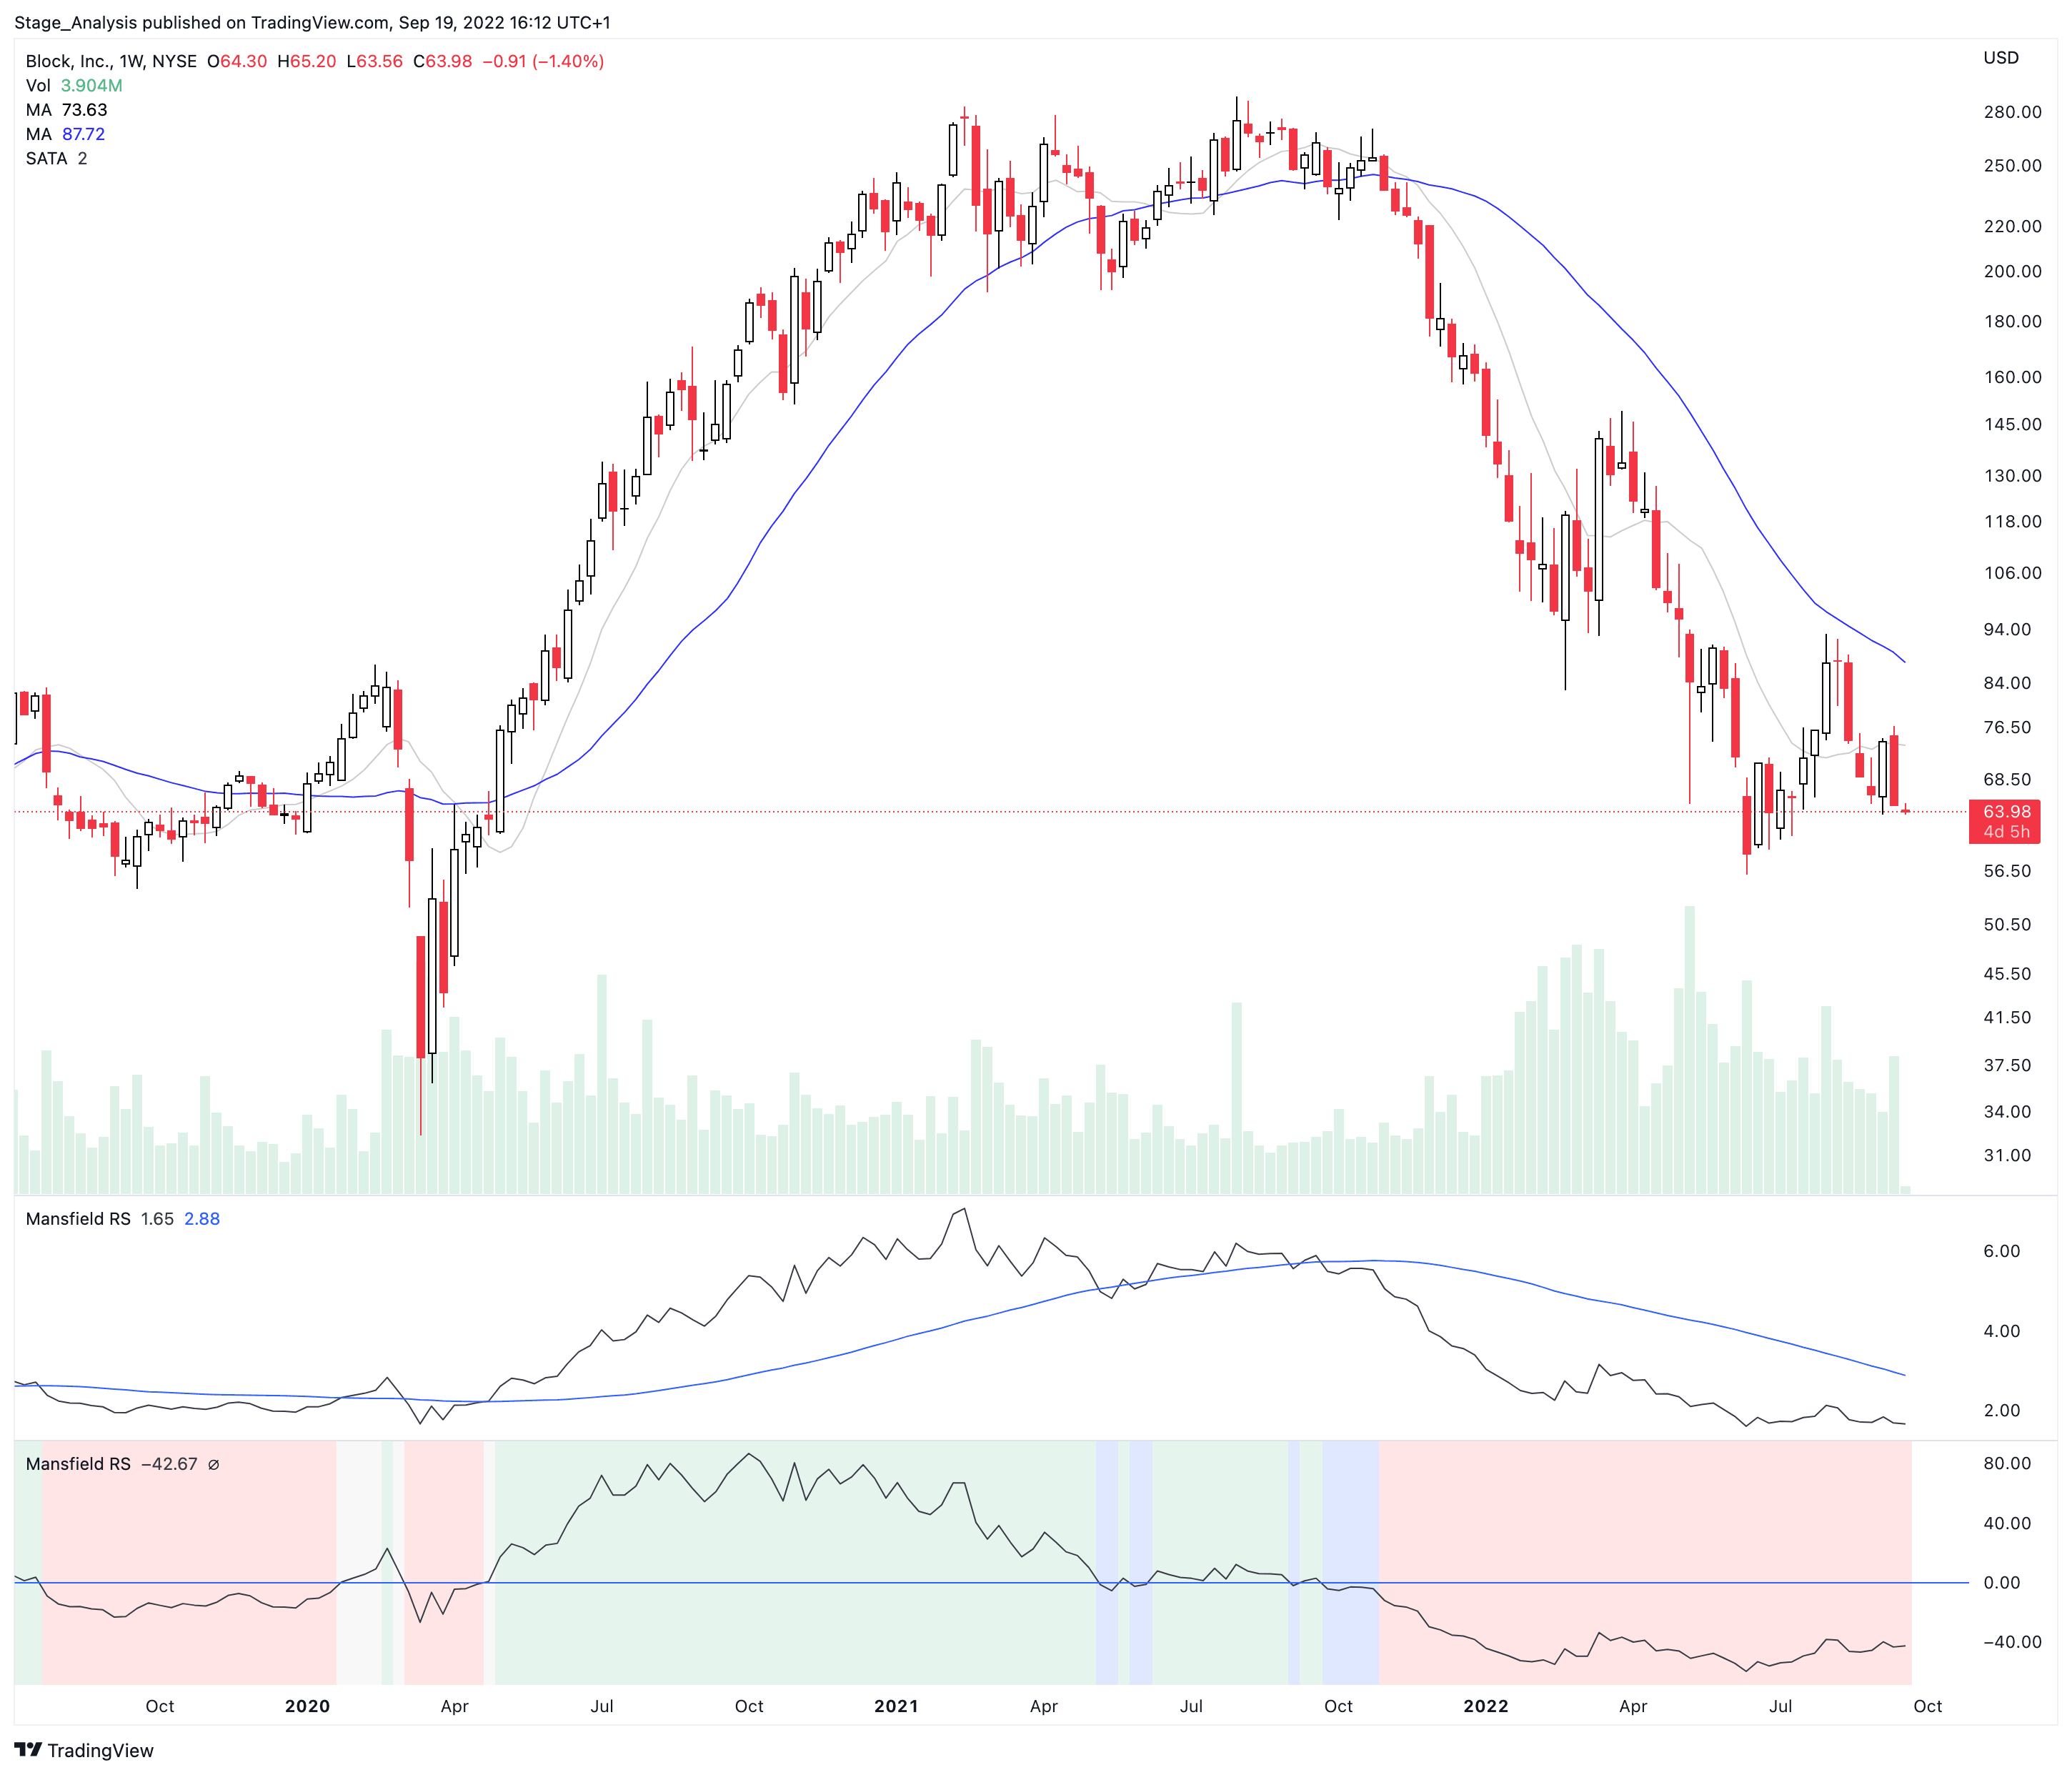
Outperforming – Above the Zero Line
When the Relative Strength line crosses above the Zero Line (it's flattened 52 week RS MA), it is outperforming the index or stock that it's comparing against, and so it is showing stronger relative strength.
Underperforming – Below the Zero Line
When the Relative Strength line crosses below the Zero Line (it's flattened 52 week RS MA), it is underperforming the index or stock that it's comparing against, and so it is showing weaker relative strength.
Become a Stage Analysis Member:
To see more like this – US Stocks watchlist posts, detailed videos each weekend, use our unique Stage Analysis tools, such as the US Stocks & ETFs Screener, Charts, Market Breadth, Group Relative Strength and more...
Join Today
Disclaimer: For educational purpose only. Not investment advice. Seek professional advice from a financial advisor before making any investing decisions.