
How to setup the SATA: Stage Analysis Technical Attributes Indicator for Tradingview
12 September, 2022In this brief 12 minute video I explain some different setup options for the Stage Analysis Technical Attributes (SATA) Indicator, which is available to use for free on Tradingview.
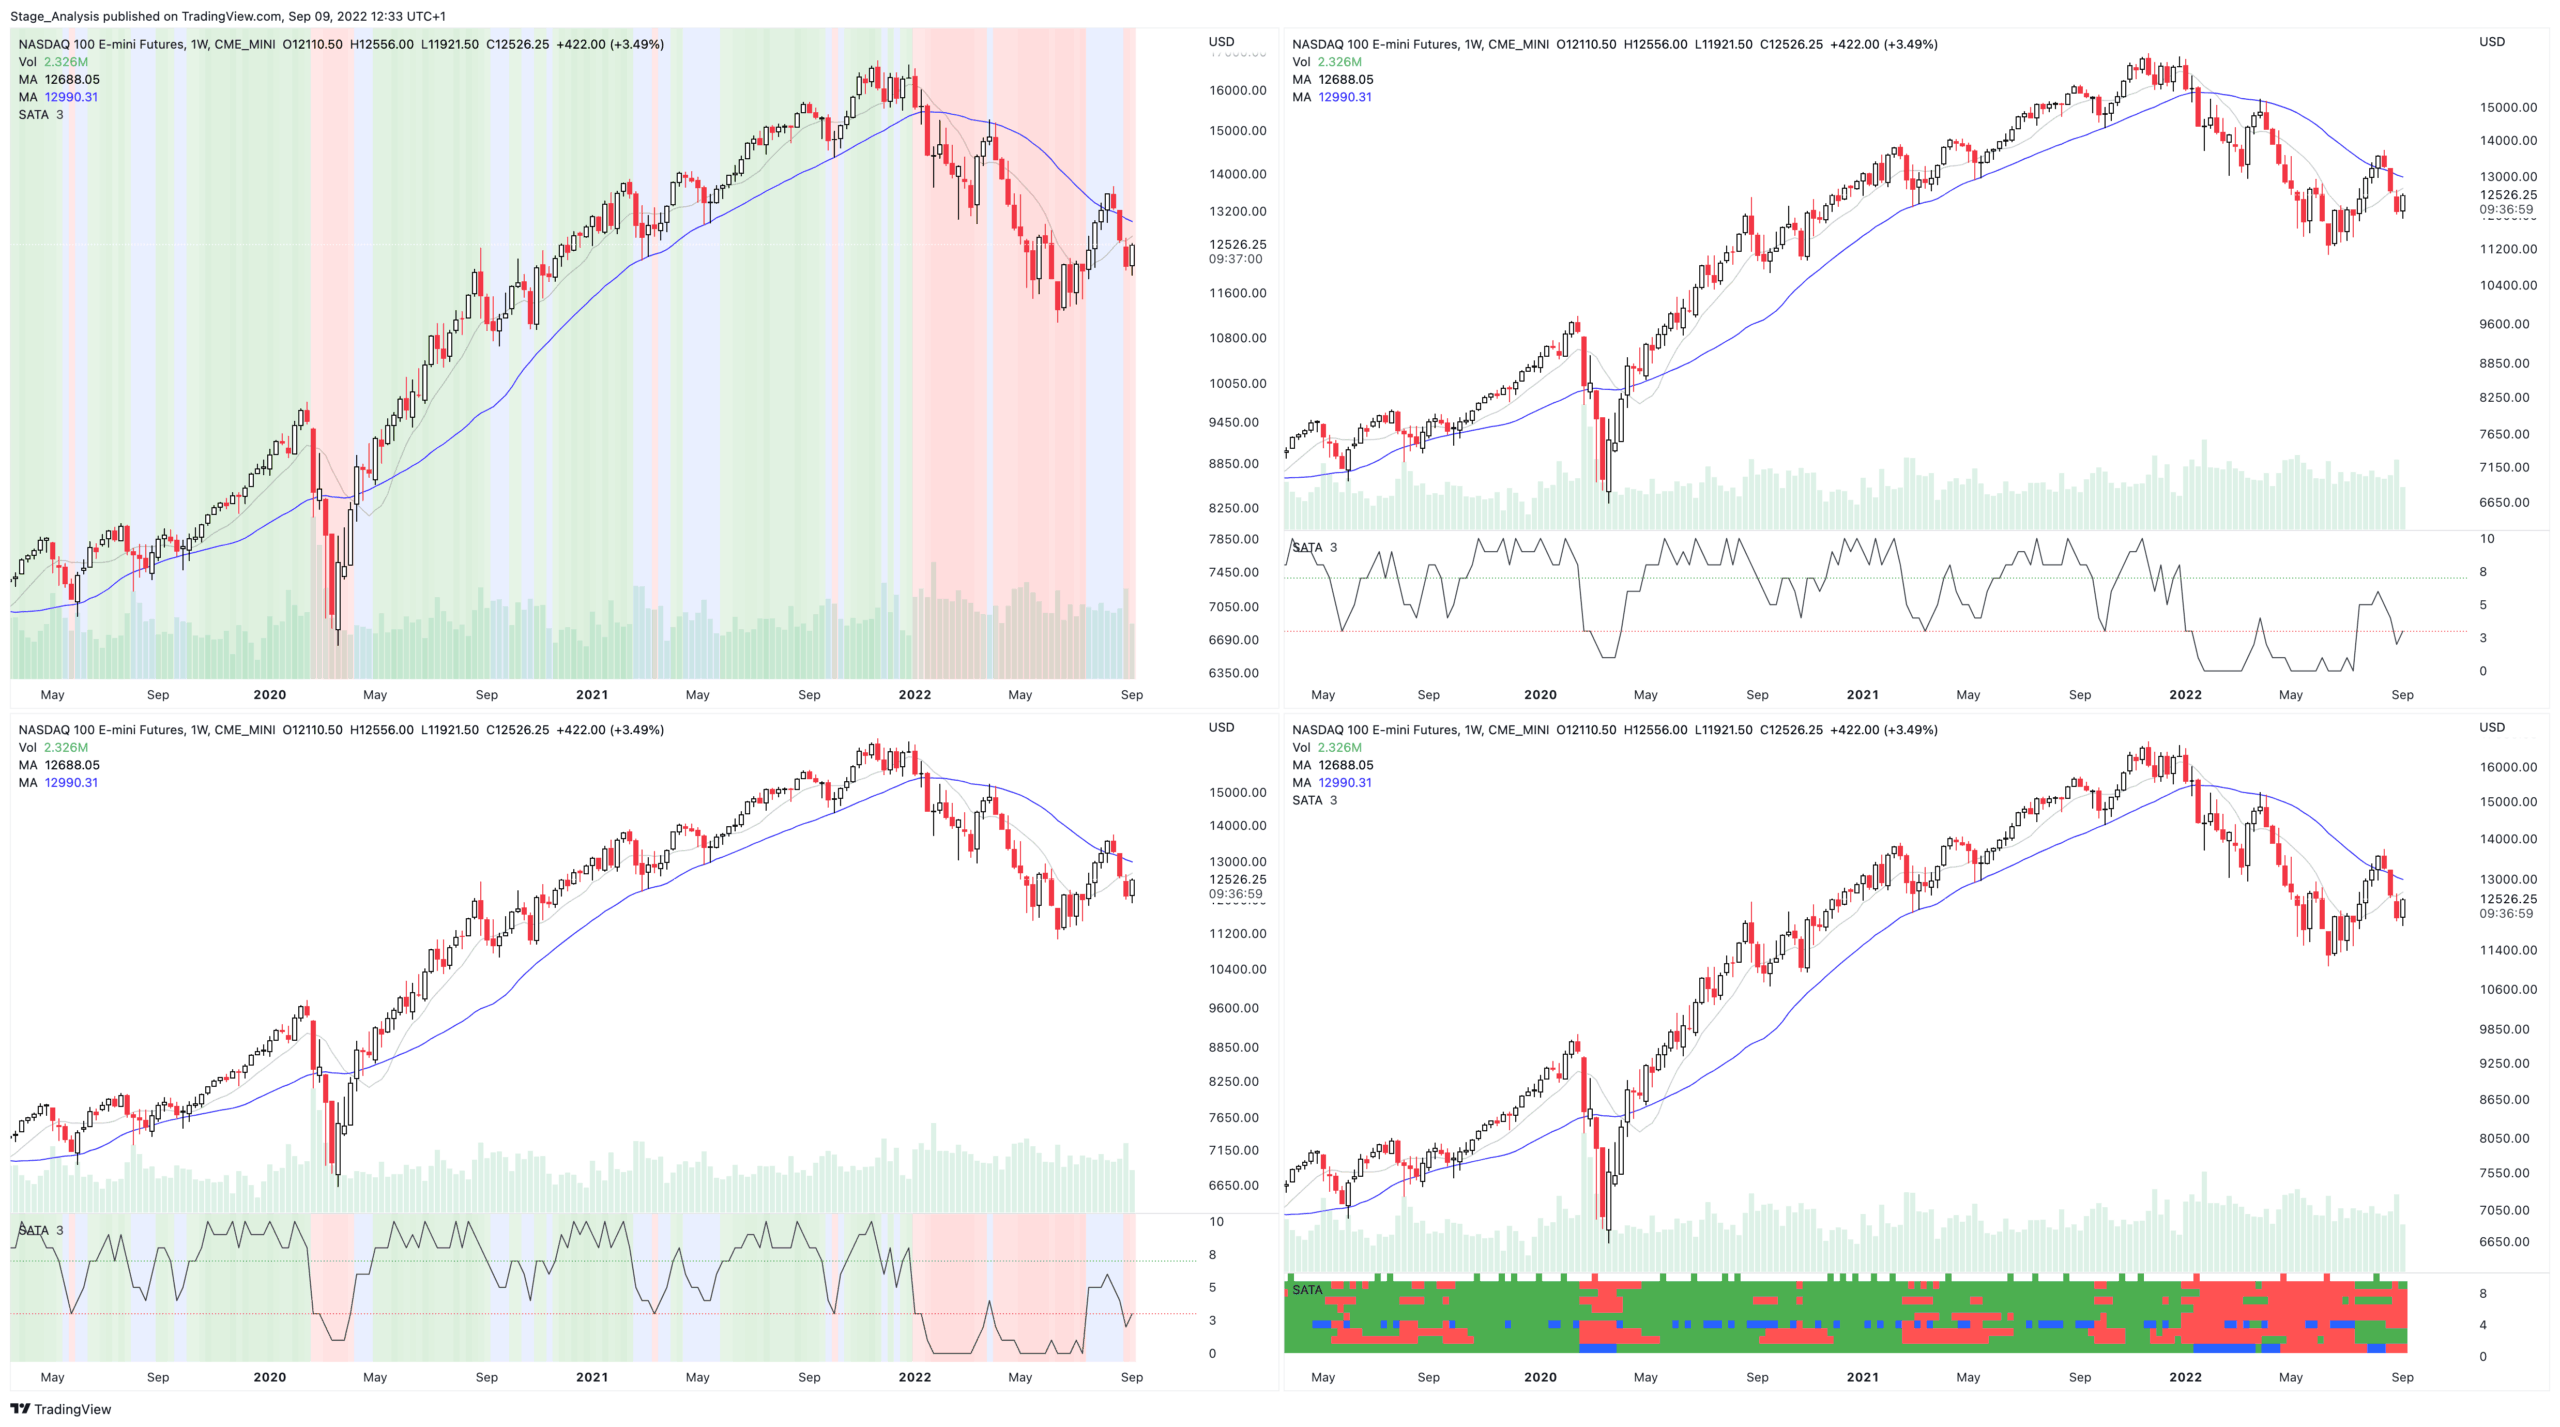
You can customise the indicator to be used however you choose:
- SATA score – data point only with no indicator visible (the most simple use case)
- Matrix style – 10 rows of colour blocks, highly visual style of seeing the data
- Oscillator style – shows an oscillator of the combined SATA score
- Background Bands – overlay the SATA score onto the chart as colored bands, with a different colour for each score (it can also be overlaid on the oscillator style this way)
- Multiple other use cases are possible by adjusting the settings i.e. only show the breakouts / breakdowns row from the matrix style, and include the SATA score under the moving average data. Play with the settings to find your perfect use case.
Here's is the link: Stage Analysis Technical Attributes (SATA) by stageanalysis
Disclaimer: For educational purpose only. Not investment advice. Seek professional advice from a financial advisor before making any investing decisions.