
Learn: How Stocks Transition From the Stage 4 Declining Phase to the Stage 1 Basing Phase
The full post is available to view by members only. For immediate access:
One of the hardest aspects of Stan Weinstein's Stage Analysis method is identifying when a stock / etf / index etc is transitioning from one Stage to another. The Stage Analysis Investor method entry points are at the Stage 2 breakout point, and on a successful backup to the Stage 2 breakout following the breakout. Usually a month or two later if it managed to follow through on the breakout for multiple weeks, and the Stage Analysis Trader method entry point is on continuation breakouts within an already strong Stage 2 advance – ideally from a Volatility Contraction Pattern (VCP). As well as secondary entry points using pullbacks within Stage 2, which is much less talked about. But still a very important part of the method.
However, in order to be prepared to act at the Stage Analysis method entry points, or the earlier Wyckoff method entry points that occur in Phase C and D of a Stage 1 base structure. We need to start tracking stocks earlier as they potentially begin to transition from Stage 4 into Stage 1. As often a lot of the base structure (many months) will develop while the stock is still in Stage 4 and far below declining long-term moving averages, which leads people to get in too early while the characteristics of the chart are still unfavourable. i.e. a small base following a large Stage 4 decline, price still under declining moving averages, short-term and medium-term moving averages still below longer-term moving averages, large overhead resistance etc.
So, when does a stock stop being in a Stage 4 declining phase and start to transition into the Stage 1 basing phase?
As I said at the start of the article. It's one of the hardest aspects of the method, but you can learn to train your eyes to see the defining characteristics, which over time will make it possible to identify what Stage the stock is in at a glance.
To help you learn what to look for. Below are multiple stocks with the weekly and daily charts marked up, and also clean versions of the charts, as you won't have nicely marked charts and levels in your own charting software. So looking at the clean charts are also essential in order to help train your eyes to identify the key characteristics that we look for when a stock is transitioning from Stage 4 into early Stage 1.
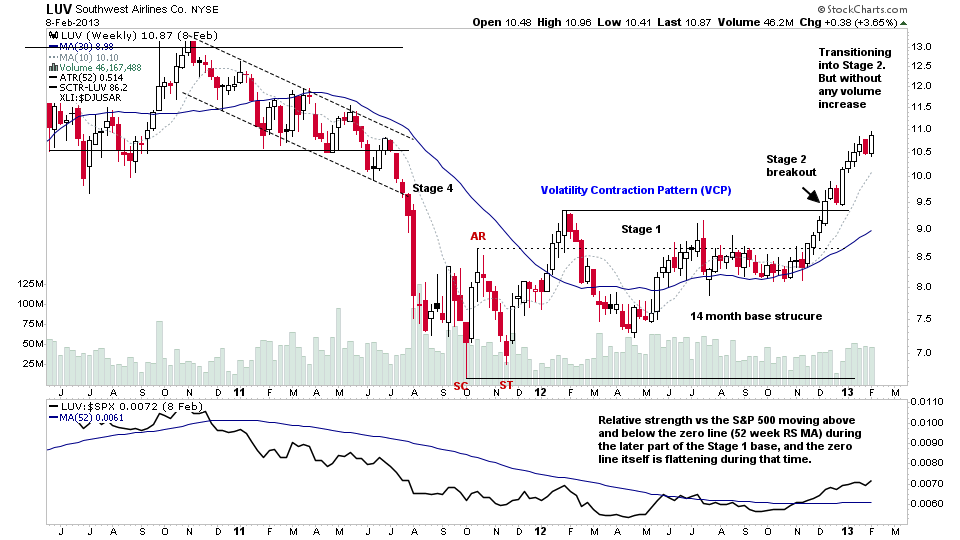
Example 1: LUV – Southwest Airlines (Weekly Chart)
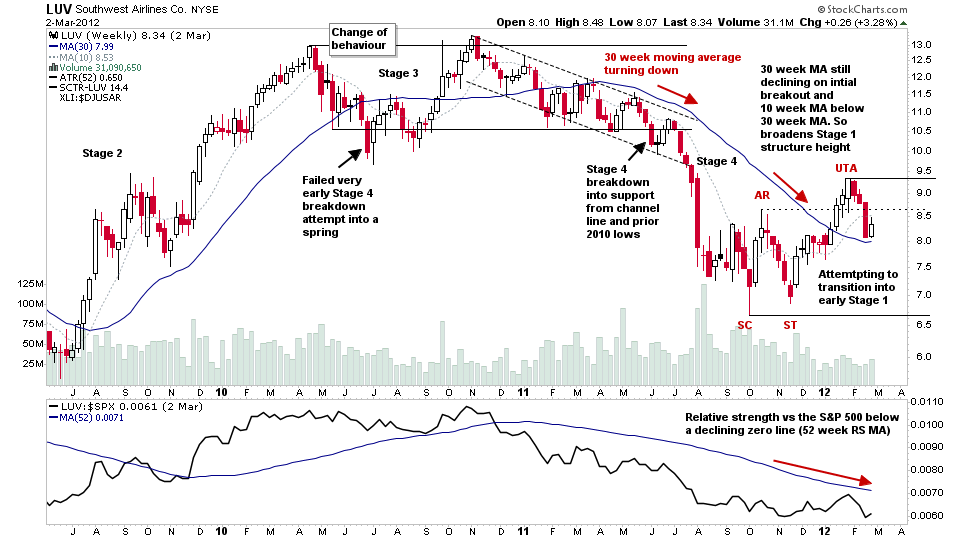
Back in early 2012 – following the late 2011 Stage 4 bear market – LUV was potentially beginning to transition back into the early part of a Stage 1 base structure. Note the characteristics on the weekly chart. LUV had been attempting to base for around 5 months, and had even had an early breakout attempt forming a higher high above the still declining 30 week MA at the time, but quickly failed and fell back towards the 30 week MA once more. However, this Upthrust from the initial base structure – which is defined by the Selling Climax (SC) and Automatic Rally (AR) levels – expanded the range of the fledgling base structure, and so defined the new top of a potential Stage 1 base.
Note the positions of the 10 week MA and 30 week MA in early Stage 1. The 10 week MA will often be moving above the 30 week MA early in Stage 1, as price begins to move above and then back below the 30 week MA as the base structure develops.
Relative strength versus the S&P 500 will usually be still below a declining Zero Line (52 week RS MA), although it may be beginning to show some signs of improvement since the Change of Behaviour that formed the Automatic Rally (AR).
LUV – Southwest Airlines (Daily Chart)
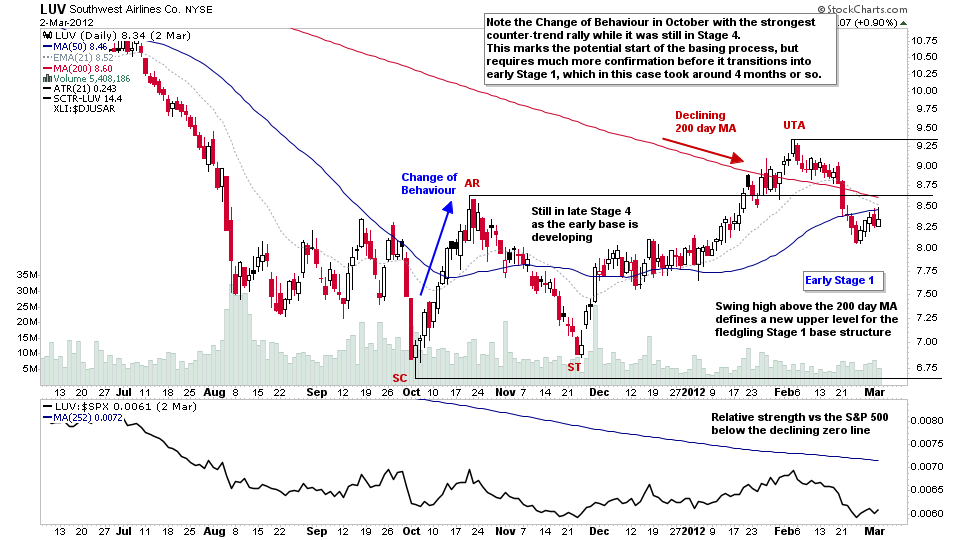
Dropping down the timeframe to the daily chart gives a different perspective, as even though LUV had only just moved into early Stage 1, it had infact been attempting to base for 7 months already at this point including the Preliminary Support back in August 2011 on the chart, and had developed a 40% range. However, due to the depth of the Stage 4 decline, this is still a short base structure, as LUV had fallen around -50% from its 2010 high and had given up the entire previous Stage 2 advance. So the 200 day MA that you can see on the chart was still steeply declining and above the short and medium-term MAs. i.e the 21 day EMA and 50 day SMA.
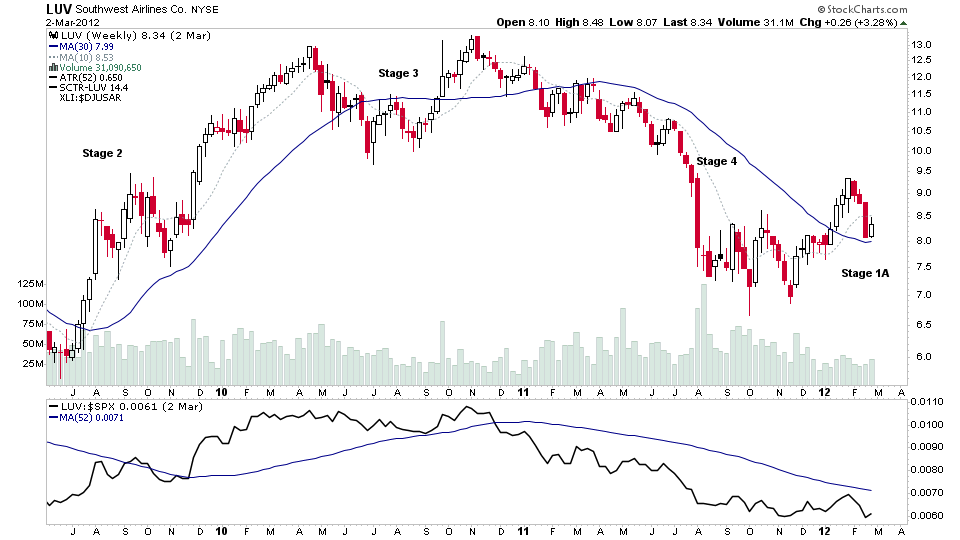
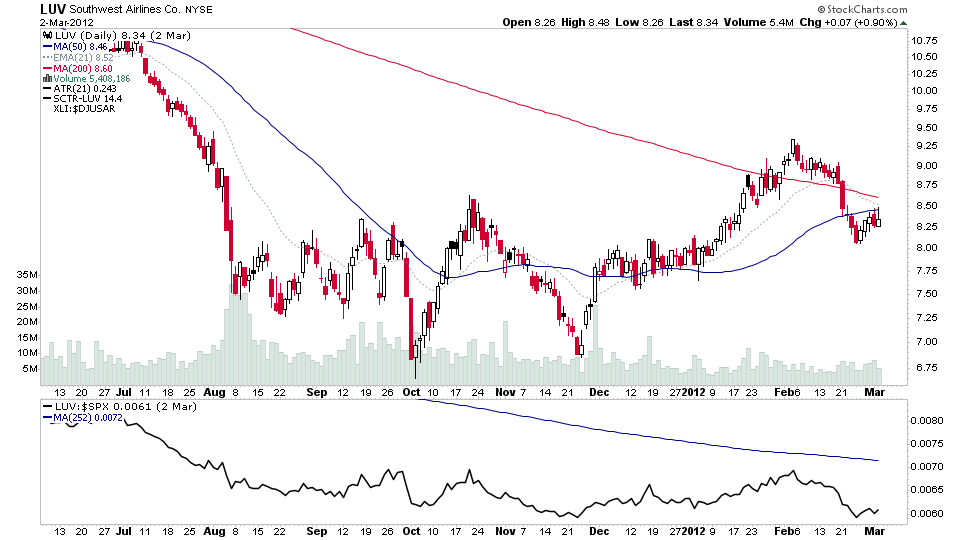
LUV – clean weekly and daily charts to train your eyes (click on the charts to see full size)
It's important to view the charts without markup in order to study the characteristics to look for yourself.
LUV – Full Stage 1 Base
Stepping forward in time a bit to 11-months later in early 2013, as the stock market was moving to new highs in Stage 2. LUV had completed the Stage 1 base – which in the end took more than a year to fully form and was moving higher in early Stage 2 with the market and showing outperformance versus the S&P 500 since its breakout from the VCP pattern in late Stage 1, which had continued into early Stage 2.
Looking back at the full Stage 1 base structure. Would you have been tempted to take the early breakout attempt in January 2012, when it was only just moving into early Stage 1?
Can you now see why the characteristics were unfavourable at the time. i.e. lots of overhead resistance, short base structure relative to the Stage 4 decline, Relative Strength underperforming below a declining zero line, low volume on the breakout attempt, moving averages in the wrong order etc.
Not all stocks will go on to develop full Stage 1 base structures, as other catalysts like a strong market, or a significant news event (new product), or a massive change in the companies earnings etc can help them push out into Stage 2 early. But following a long Stage 4 decline, the majority will need a long time for a Stage 1 base to develop, which may even fail and drop back into Stage 4 once more. But learning to identify the key characteristics of how stocks transition from Stage 4 to Stage 1 will help you avoid a lot of costly mistakes.
Your Turn
Now go and look at some current charts on the weekly and daily timeframes of stocks that you think are transitioning from Stage 4 into Stage 1, or that you think are already in Stage 1. Note the characteristics and determine the Stage. Do you still think the same as you did previously?
Become a Stage Analysis Member:
To see more like this – US Stocks watchlist posts, detailed videos each weekend, use our unique Stage Analysis tools, such as the US Stocks & ETFs Screener, Charts, Market Breadth, Group Relative Strength and more...
Join Today
Disclaimer: For educational purpose only. Not investment advice. Seek professional advice from a financial advisor before making any investing decisions.