
Stage Analysis Trader Method Ideal Entry Point
$AAPL in 2004 is a good example of the Stage Analysis Trader method ideal entry point.
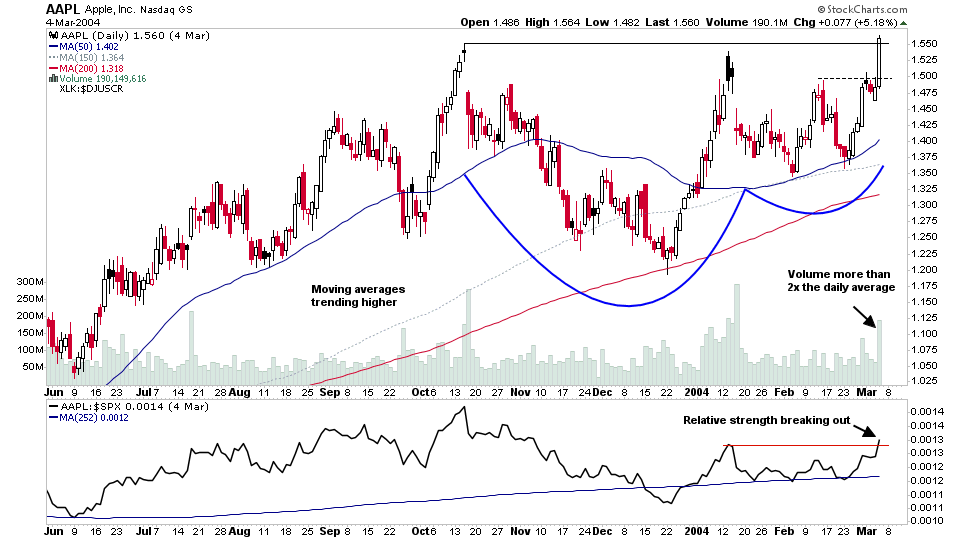
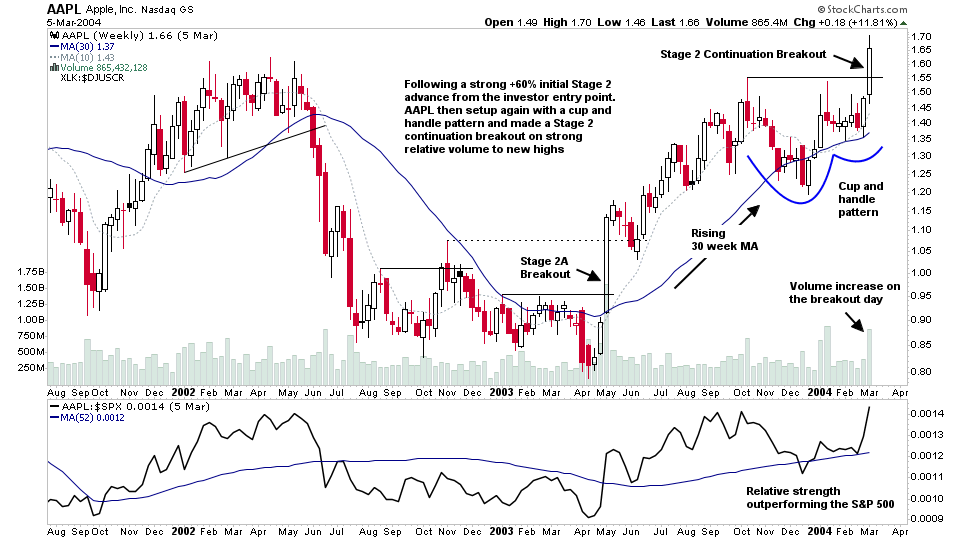
Following a strong +60% initial Stage 2 advance from the Stage 2A investor entry point (see weekly chart below). AAPL then setup again with a cup and handle pattern and then made a Stage 2 continuation breakout on strong relative volume to new highs.
The trader method entry point was on the breakout above the near term pivot, which would have given around -4% stop loss under the local swing low that had formed prior to the breakout attempt, or a larger -7% stop loss if you were using the 50 day MA also to give the trade more room initially.
Become a Stage Analysis Member:
To see more like this – US Stocks watchlist posts, detailed videos each weekend, use our unique Stage Analysis tools, such as the US Stocks & ETFs Screener, Charts, Market Breadth, Group Relative Strength and more...
Join Today
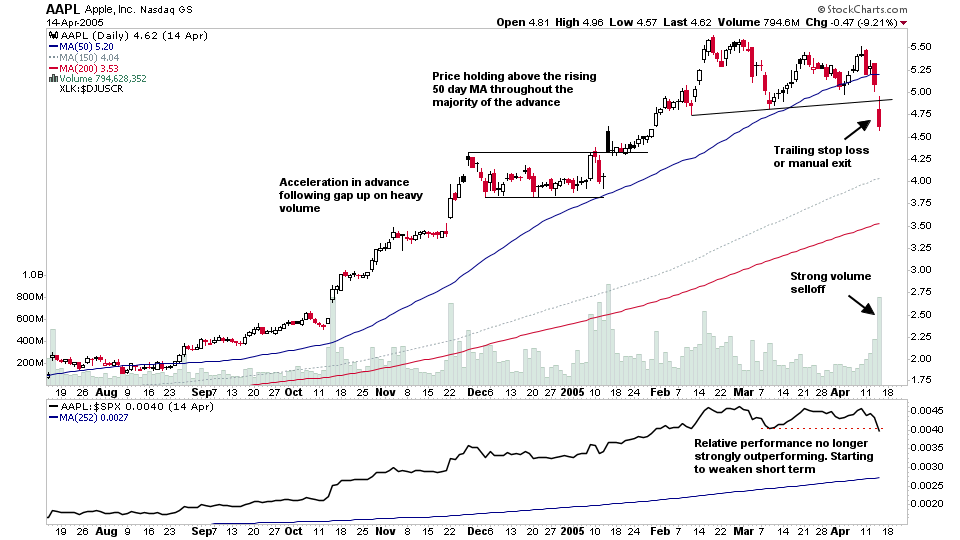
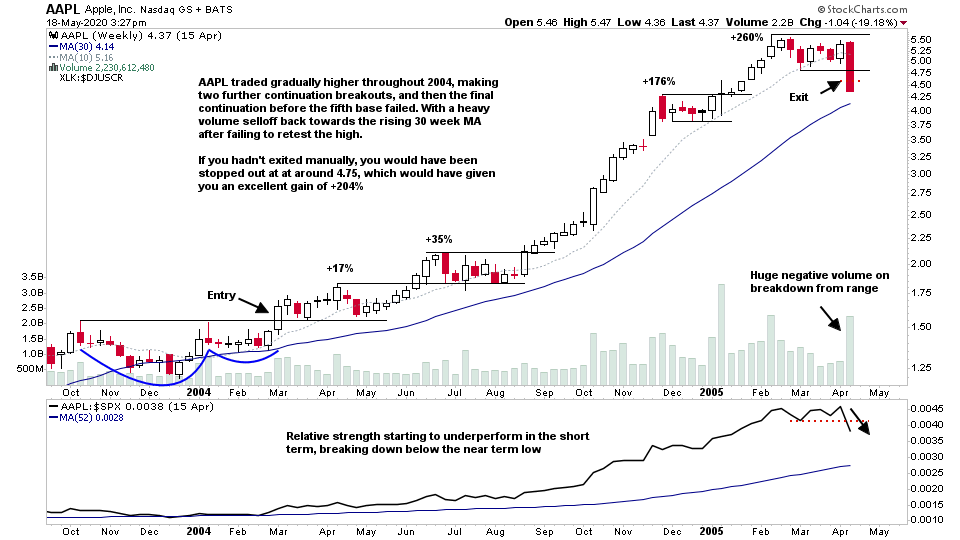
AAPL traded gradually higher throughout 2004, making two further continuation breakouts, and then the final continuation before the fifth base failed. With a heavy volume selloff back towards the rising 30 week MA after failing to retest the high.
Relative strength also started to underperform in the short term, breaking down below the near term low.
If you hadn't exited manually at that point, then you would have been stopped out at at around 4.75 (adjusted for splits), which would have given you an excellent gain of around +204%. But there were signs a buying climax near the highs in late February 2005, and so you could have exited earlier, or taken partial profits at that point.
Disclaimer: For educational purpose only. Not investment advice. Seek professional advice from a financial advisor before making any investing decisions.