
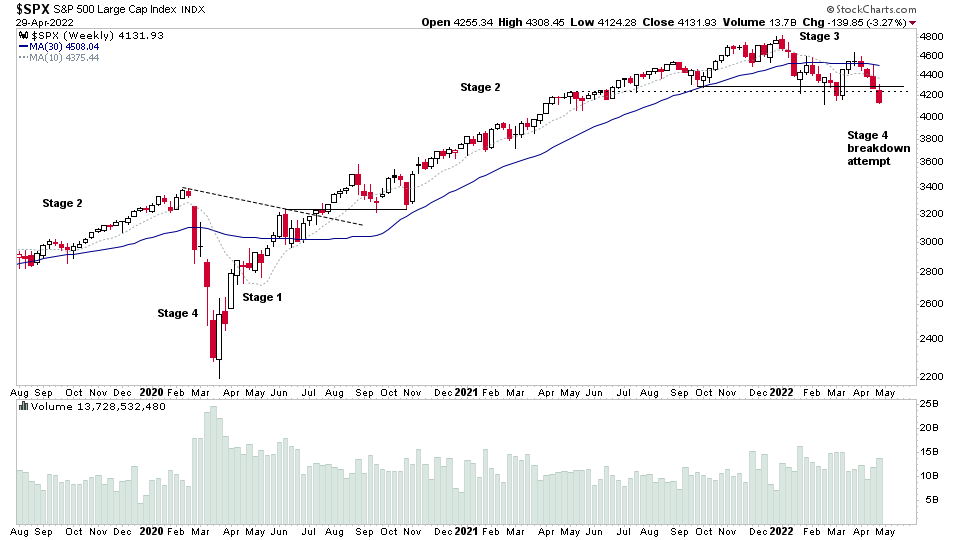
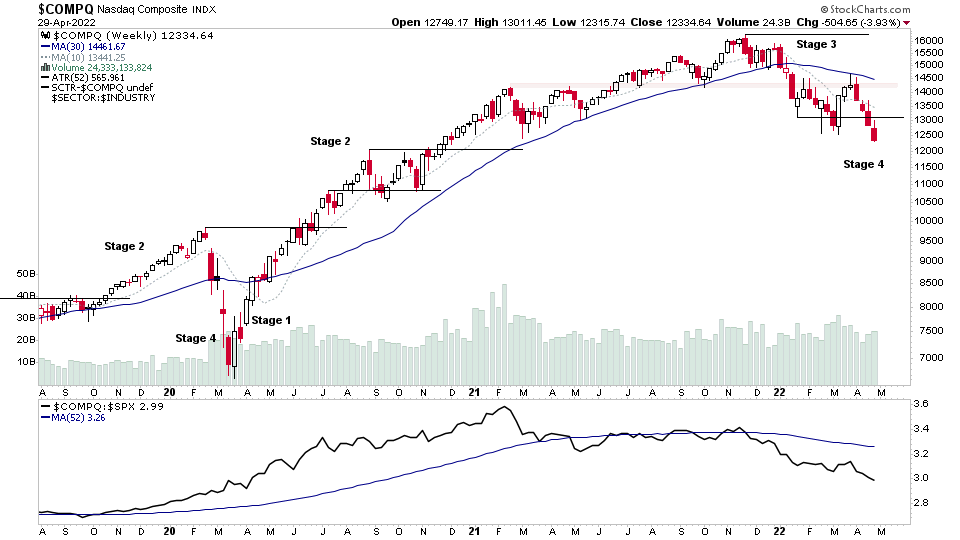
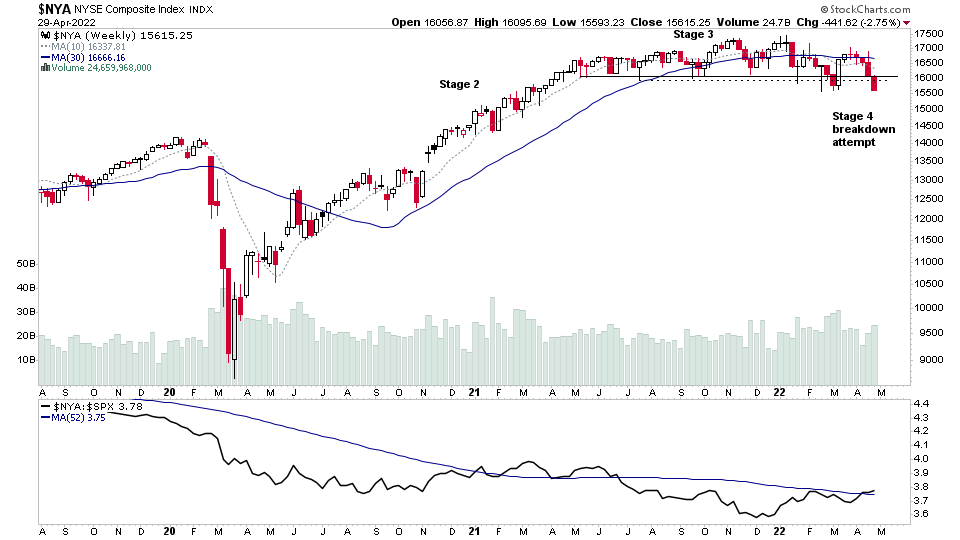
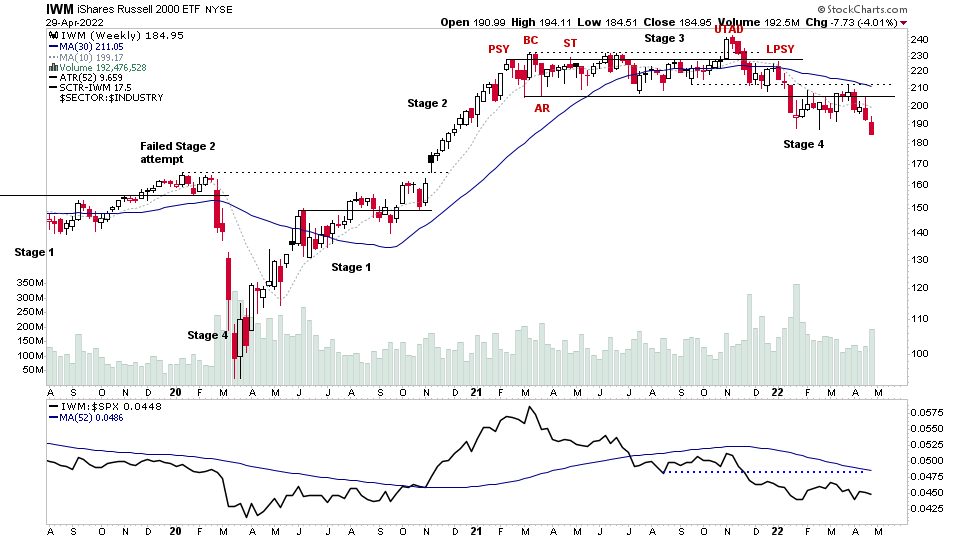
Major Stock Indexes Testing the Stage 4 Breakdown Level
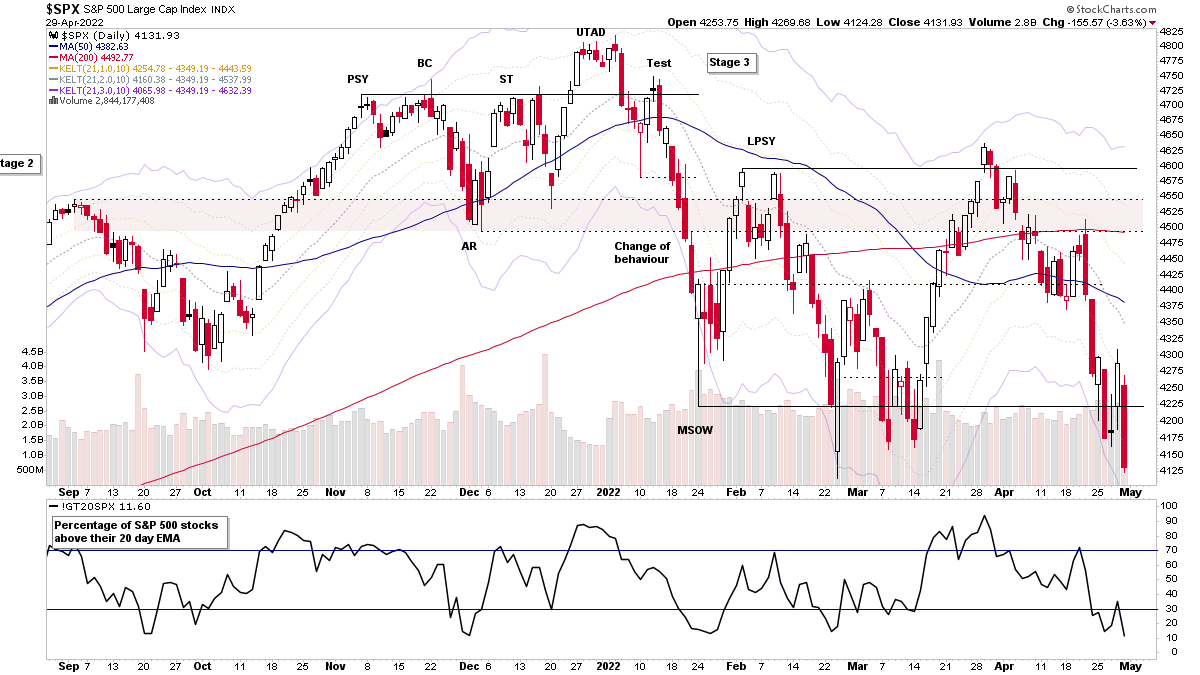
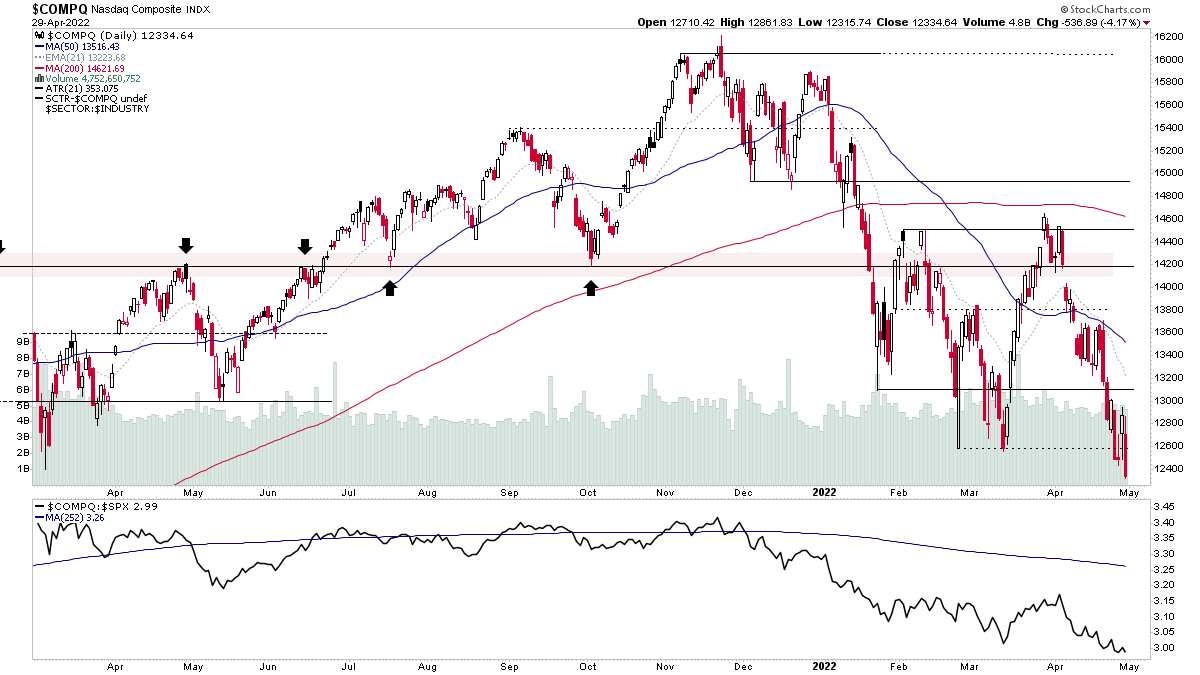
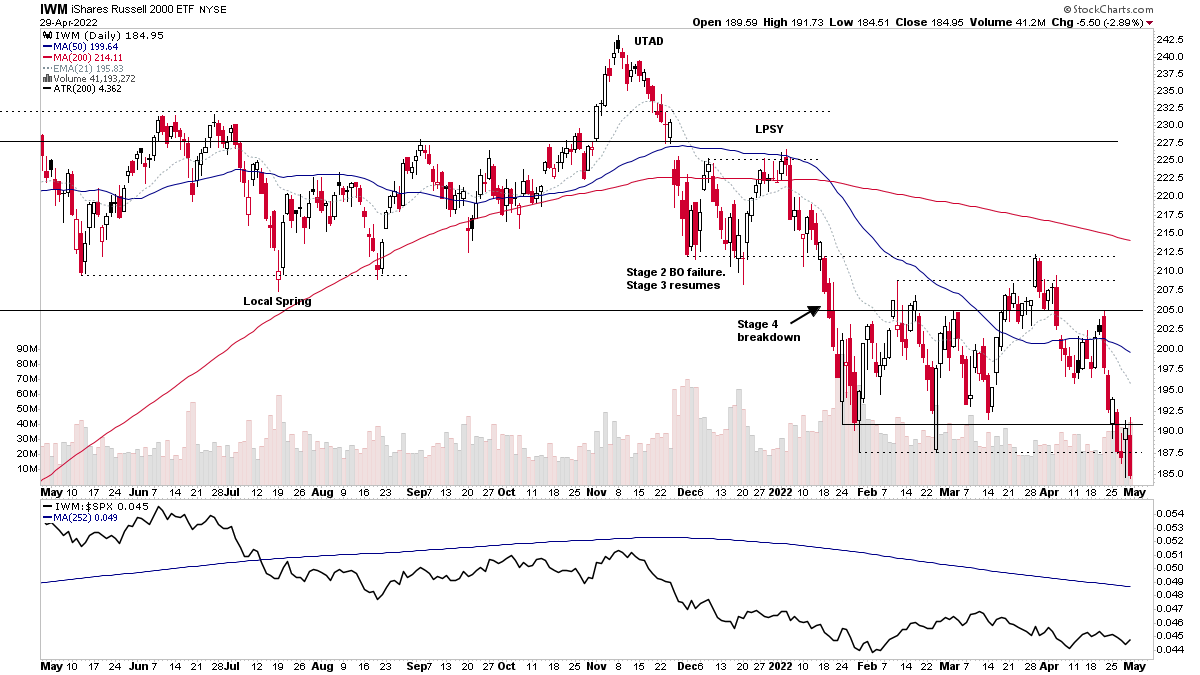
The major US indexes (i.e. the S&P 500, NYSE, Nasdaq Composite and Russell 2000 etc) all closed the week at the lows, after Thursdays bounce attempt was convincingly rejected, and with multiple indexes already in Stage 4, the holdouts have now started to breakdown as well – with the S&P 500 and NYSE both making Stage 4 breakdown attempts at the end of the week. So risk is extremely elevated of the Stage 4 decline accelerating.
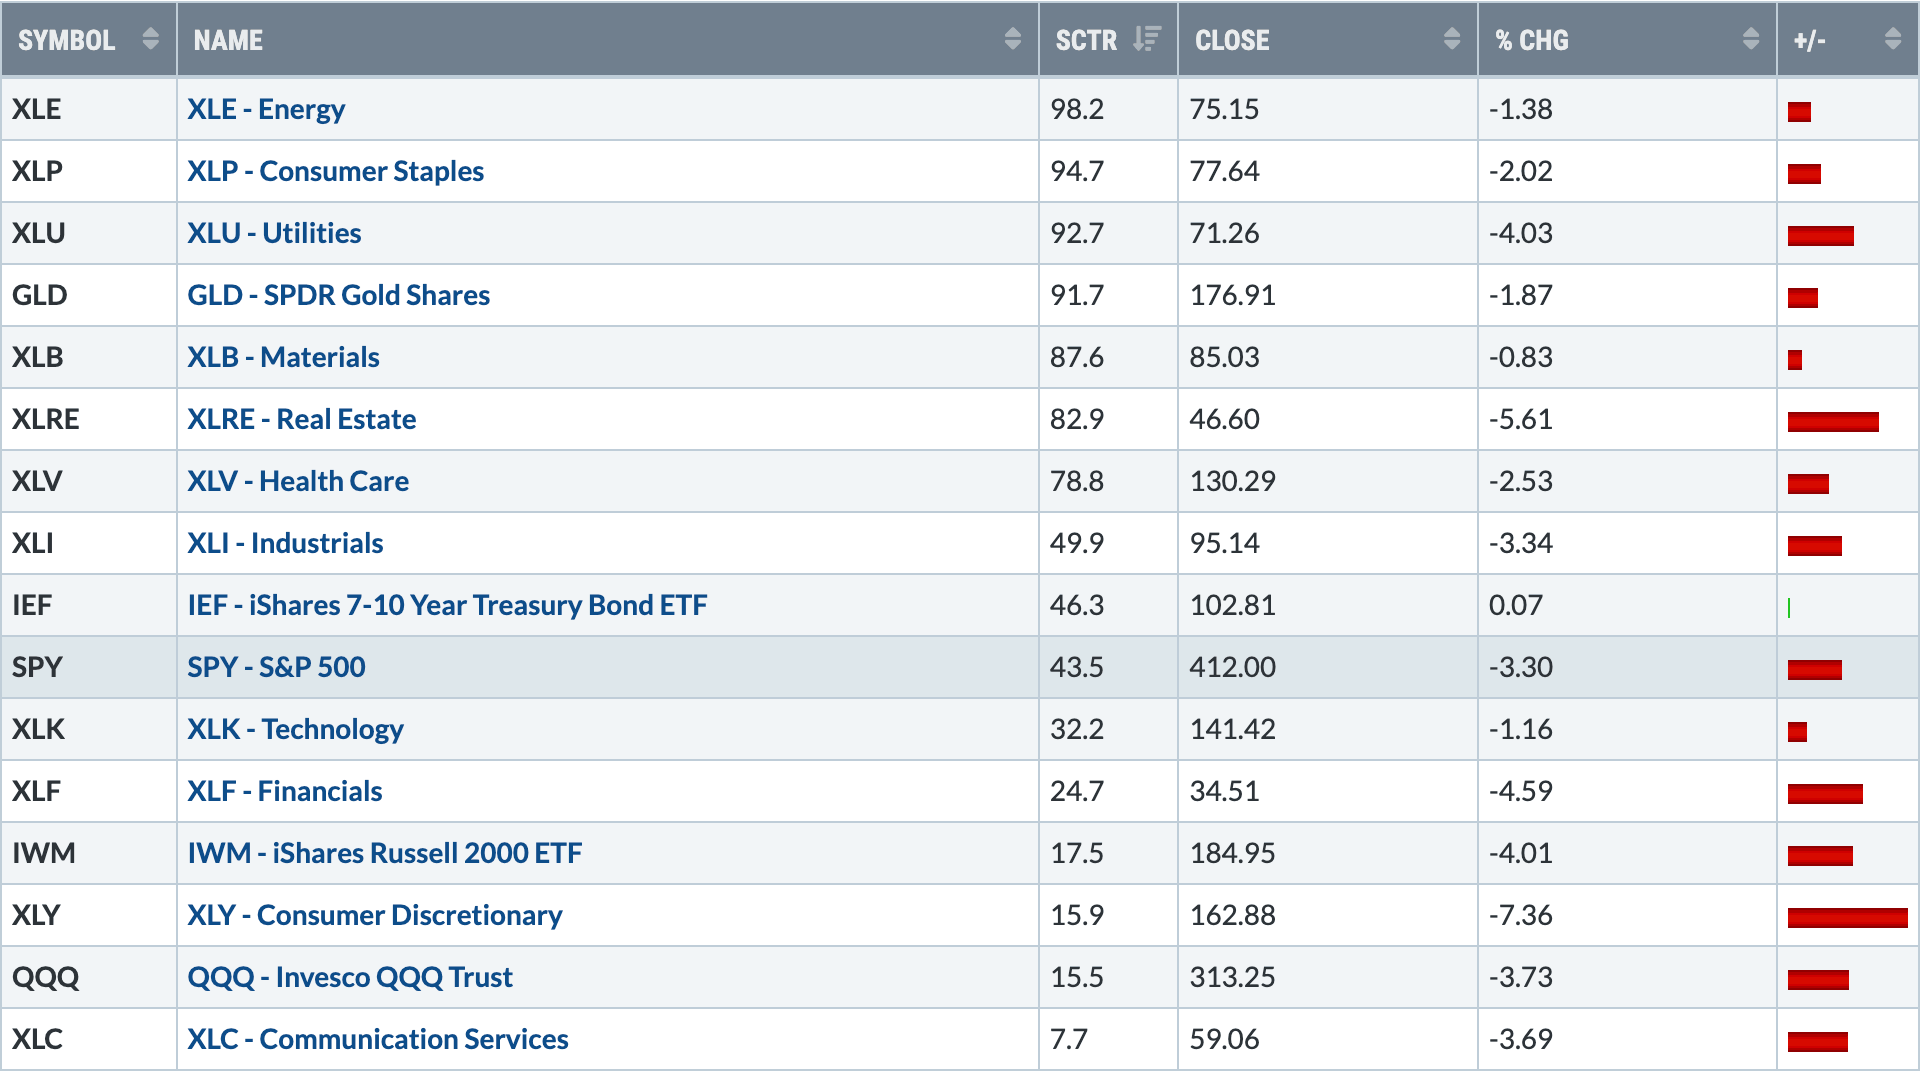
US Sectors & Indexes – Relative Strength Rankings
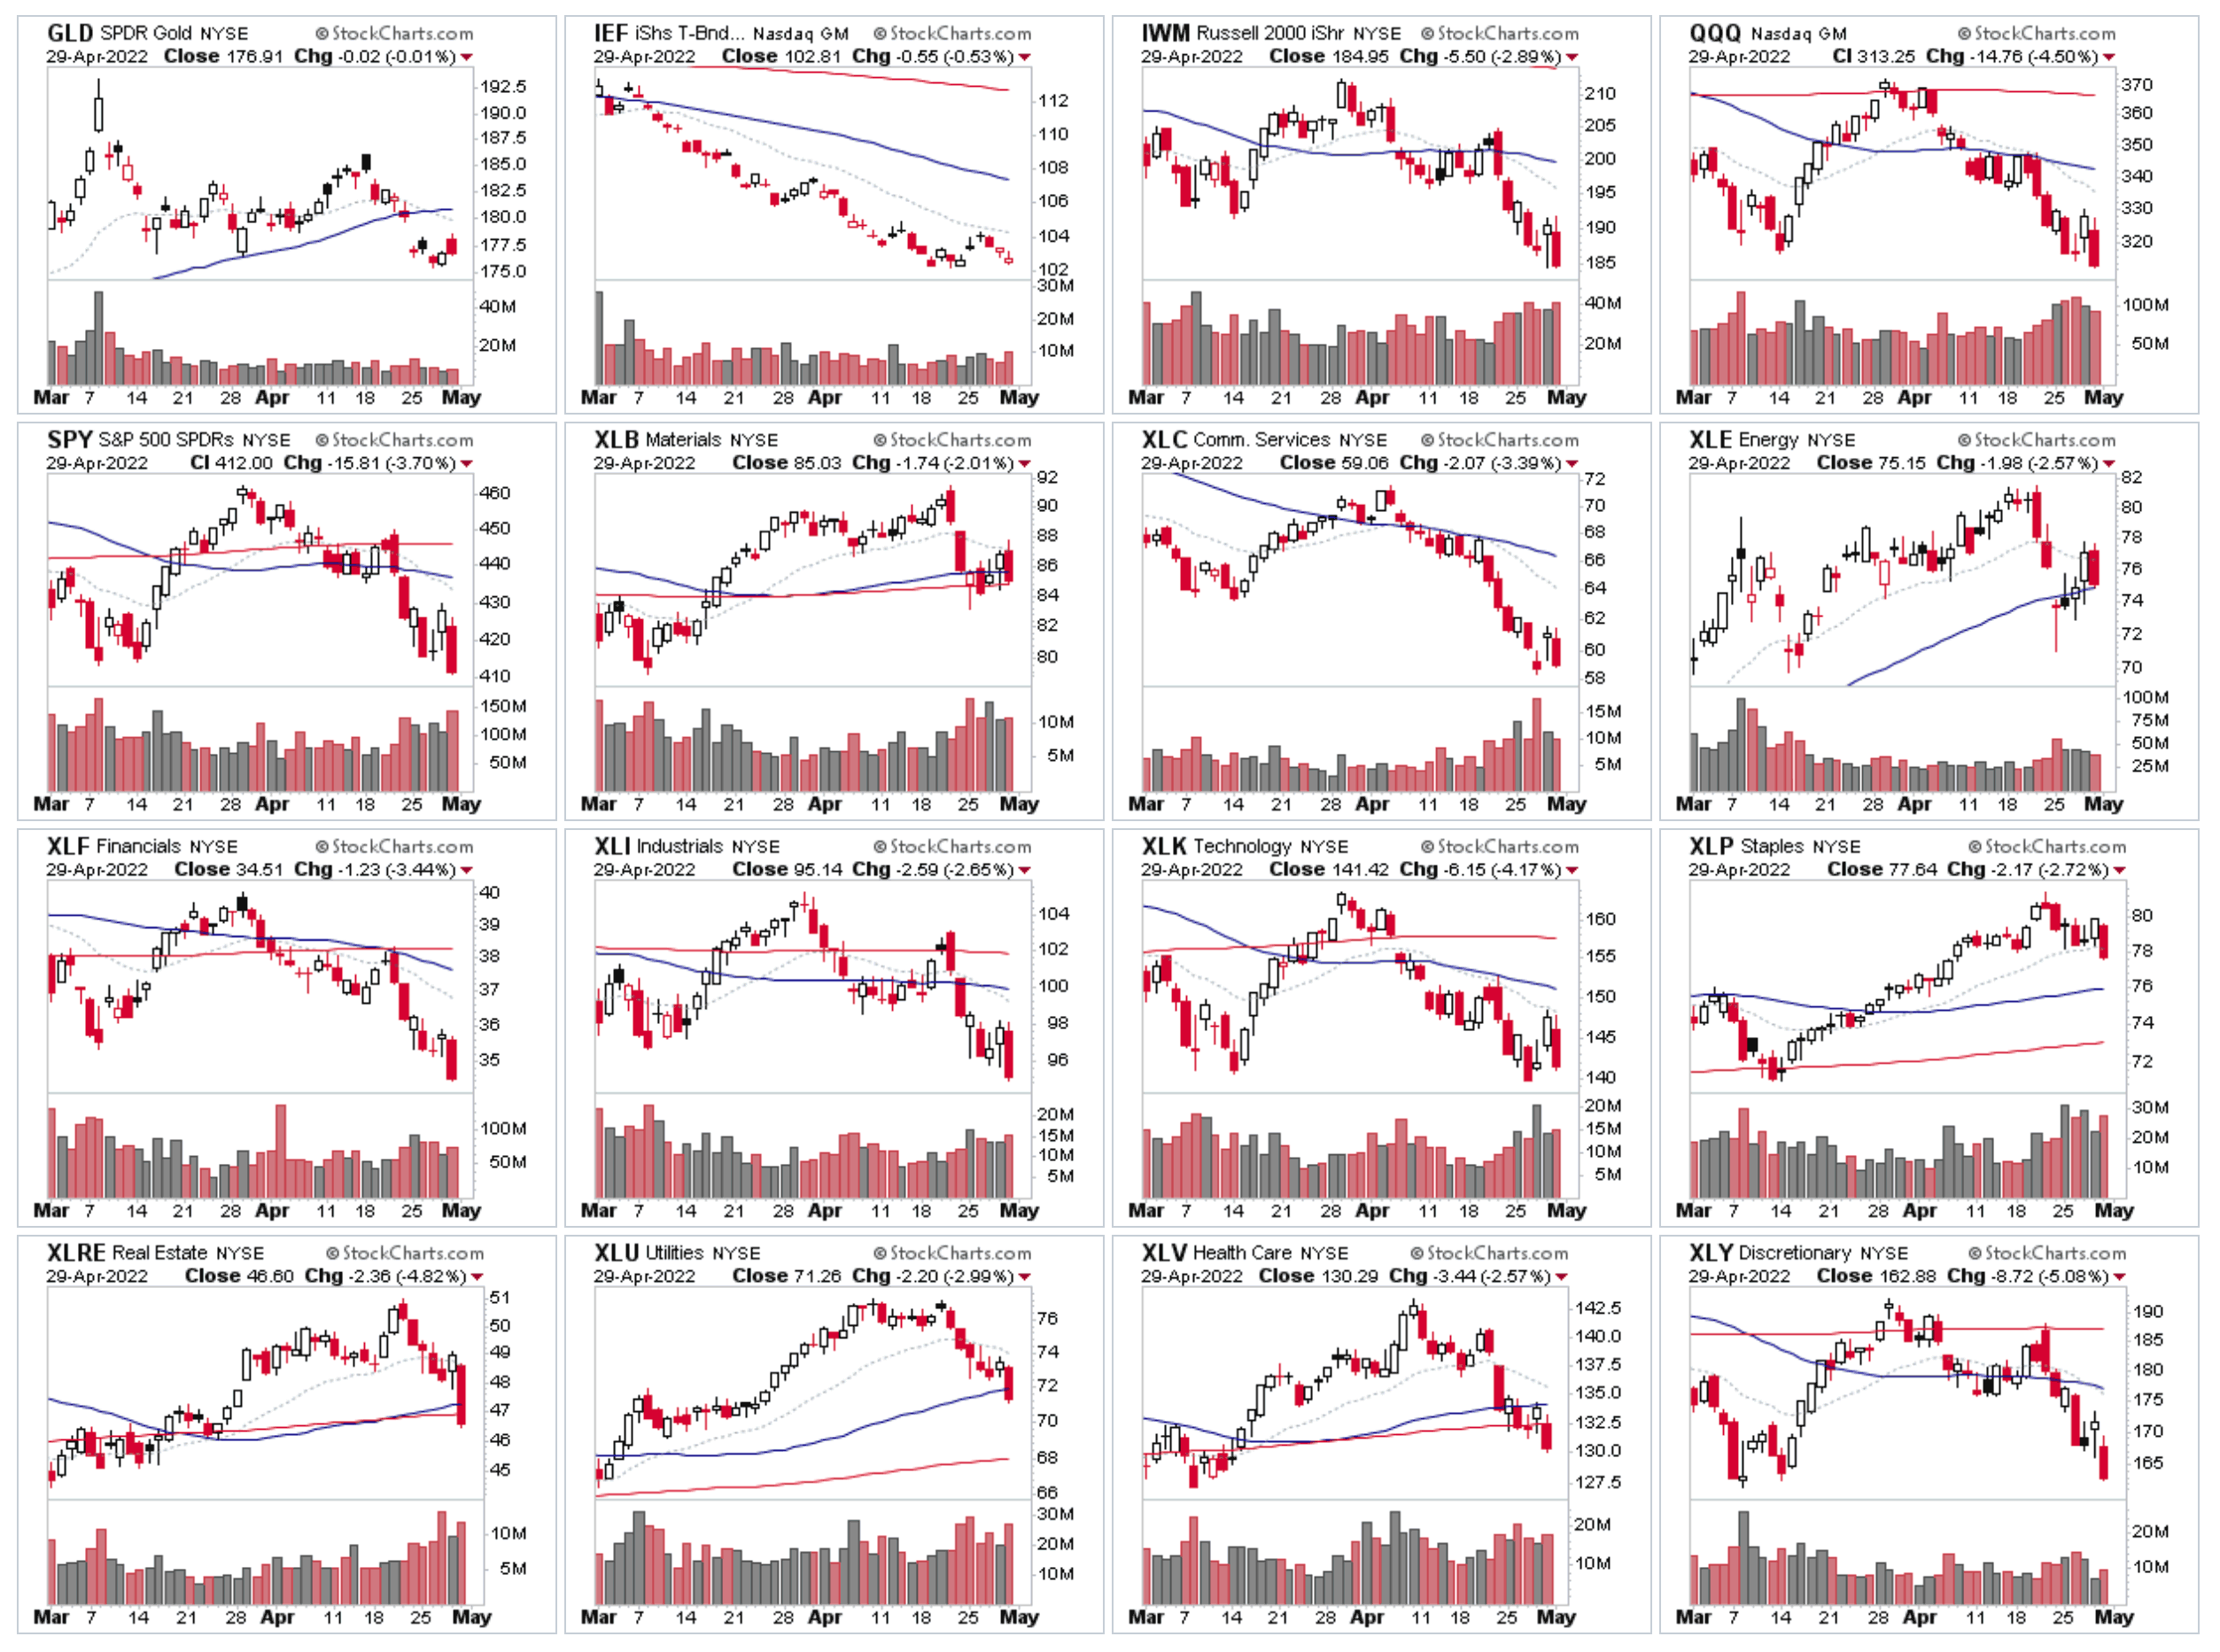
It was a negative week across the board in the major US Sectors with multiple groups testing the Stage 4 breakdown level, and the previously strong groups starting to weaken with signs of distribution appearing.
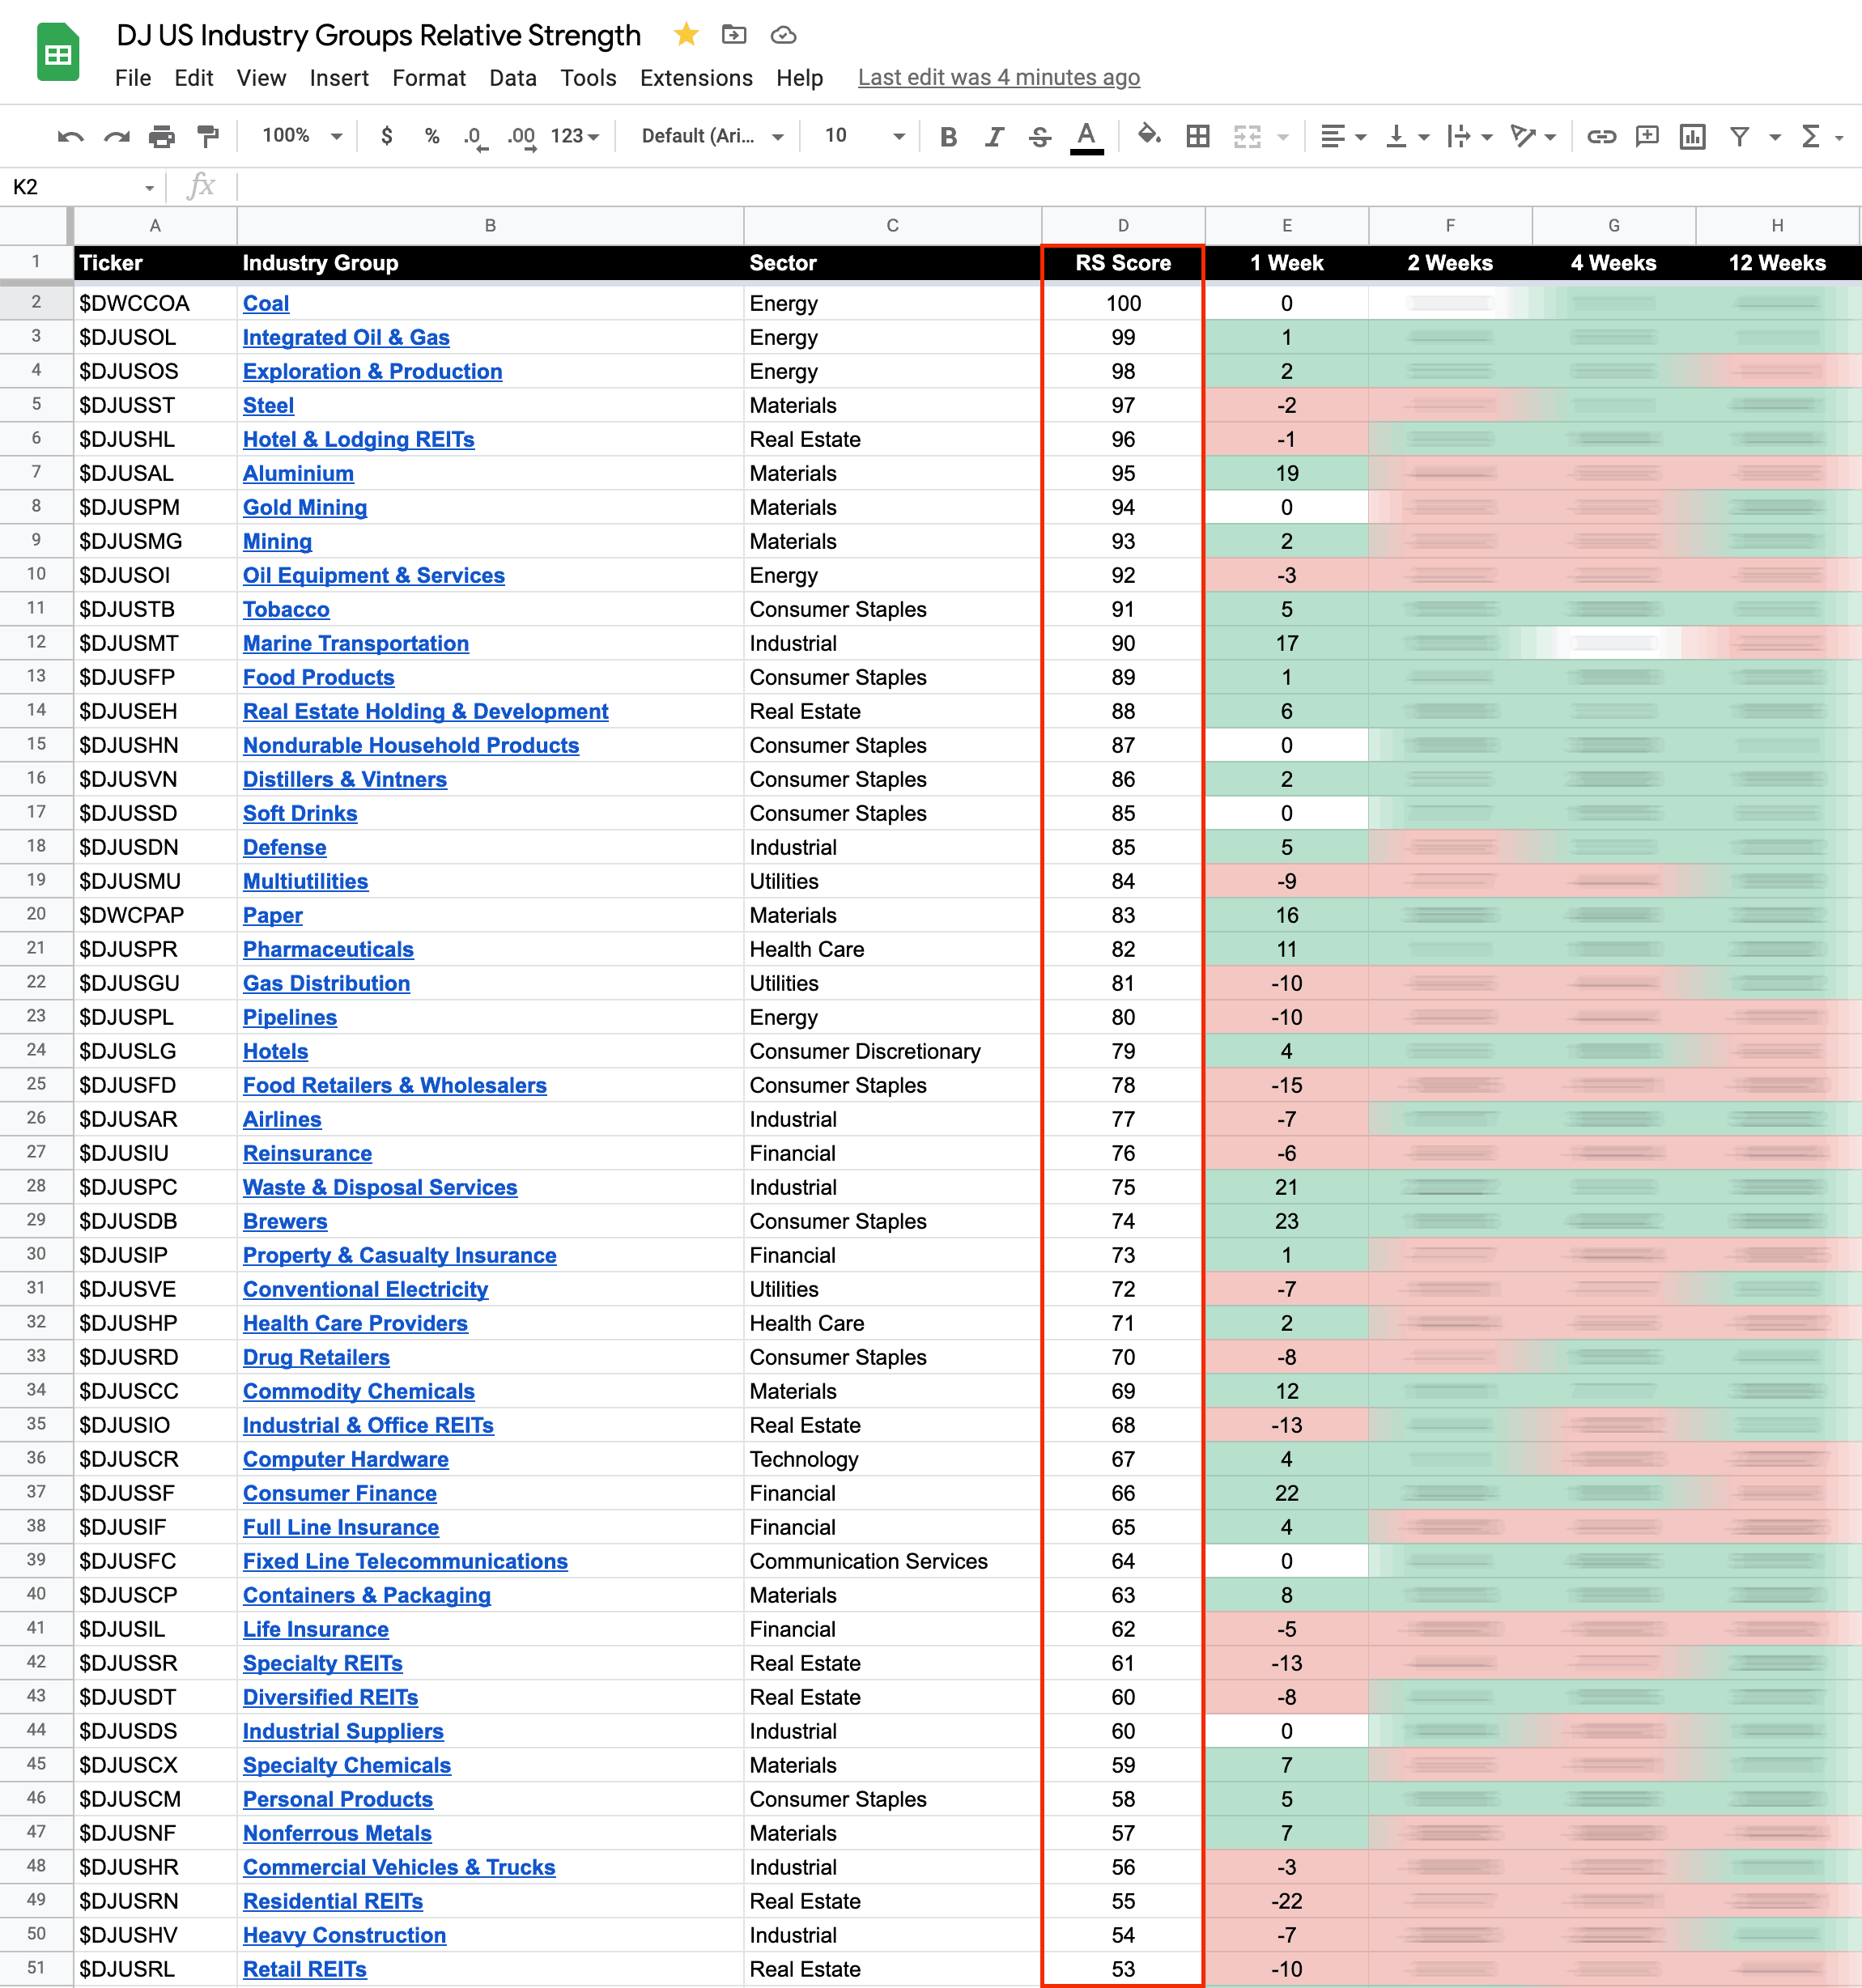
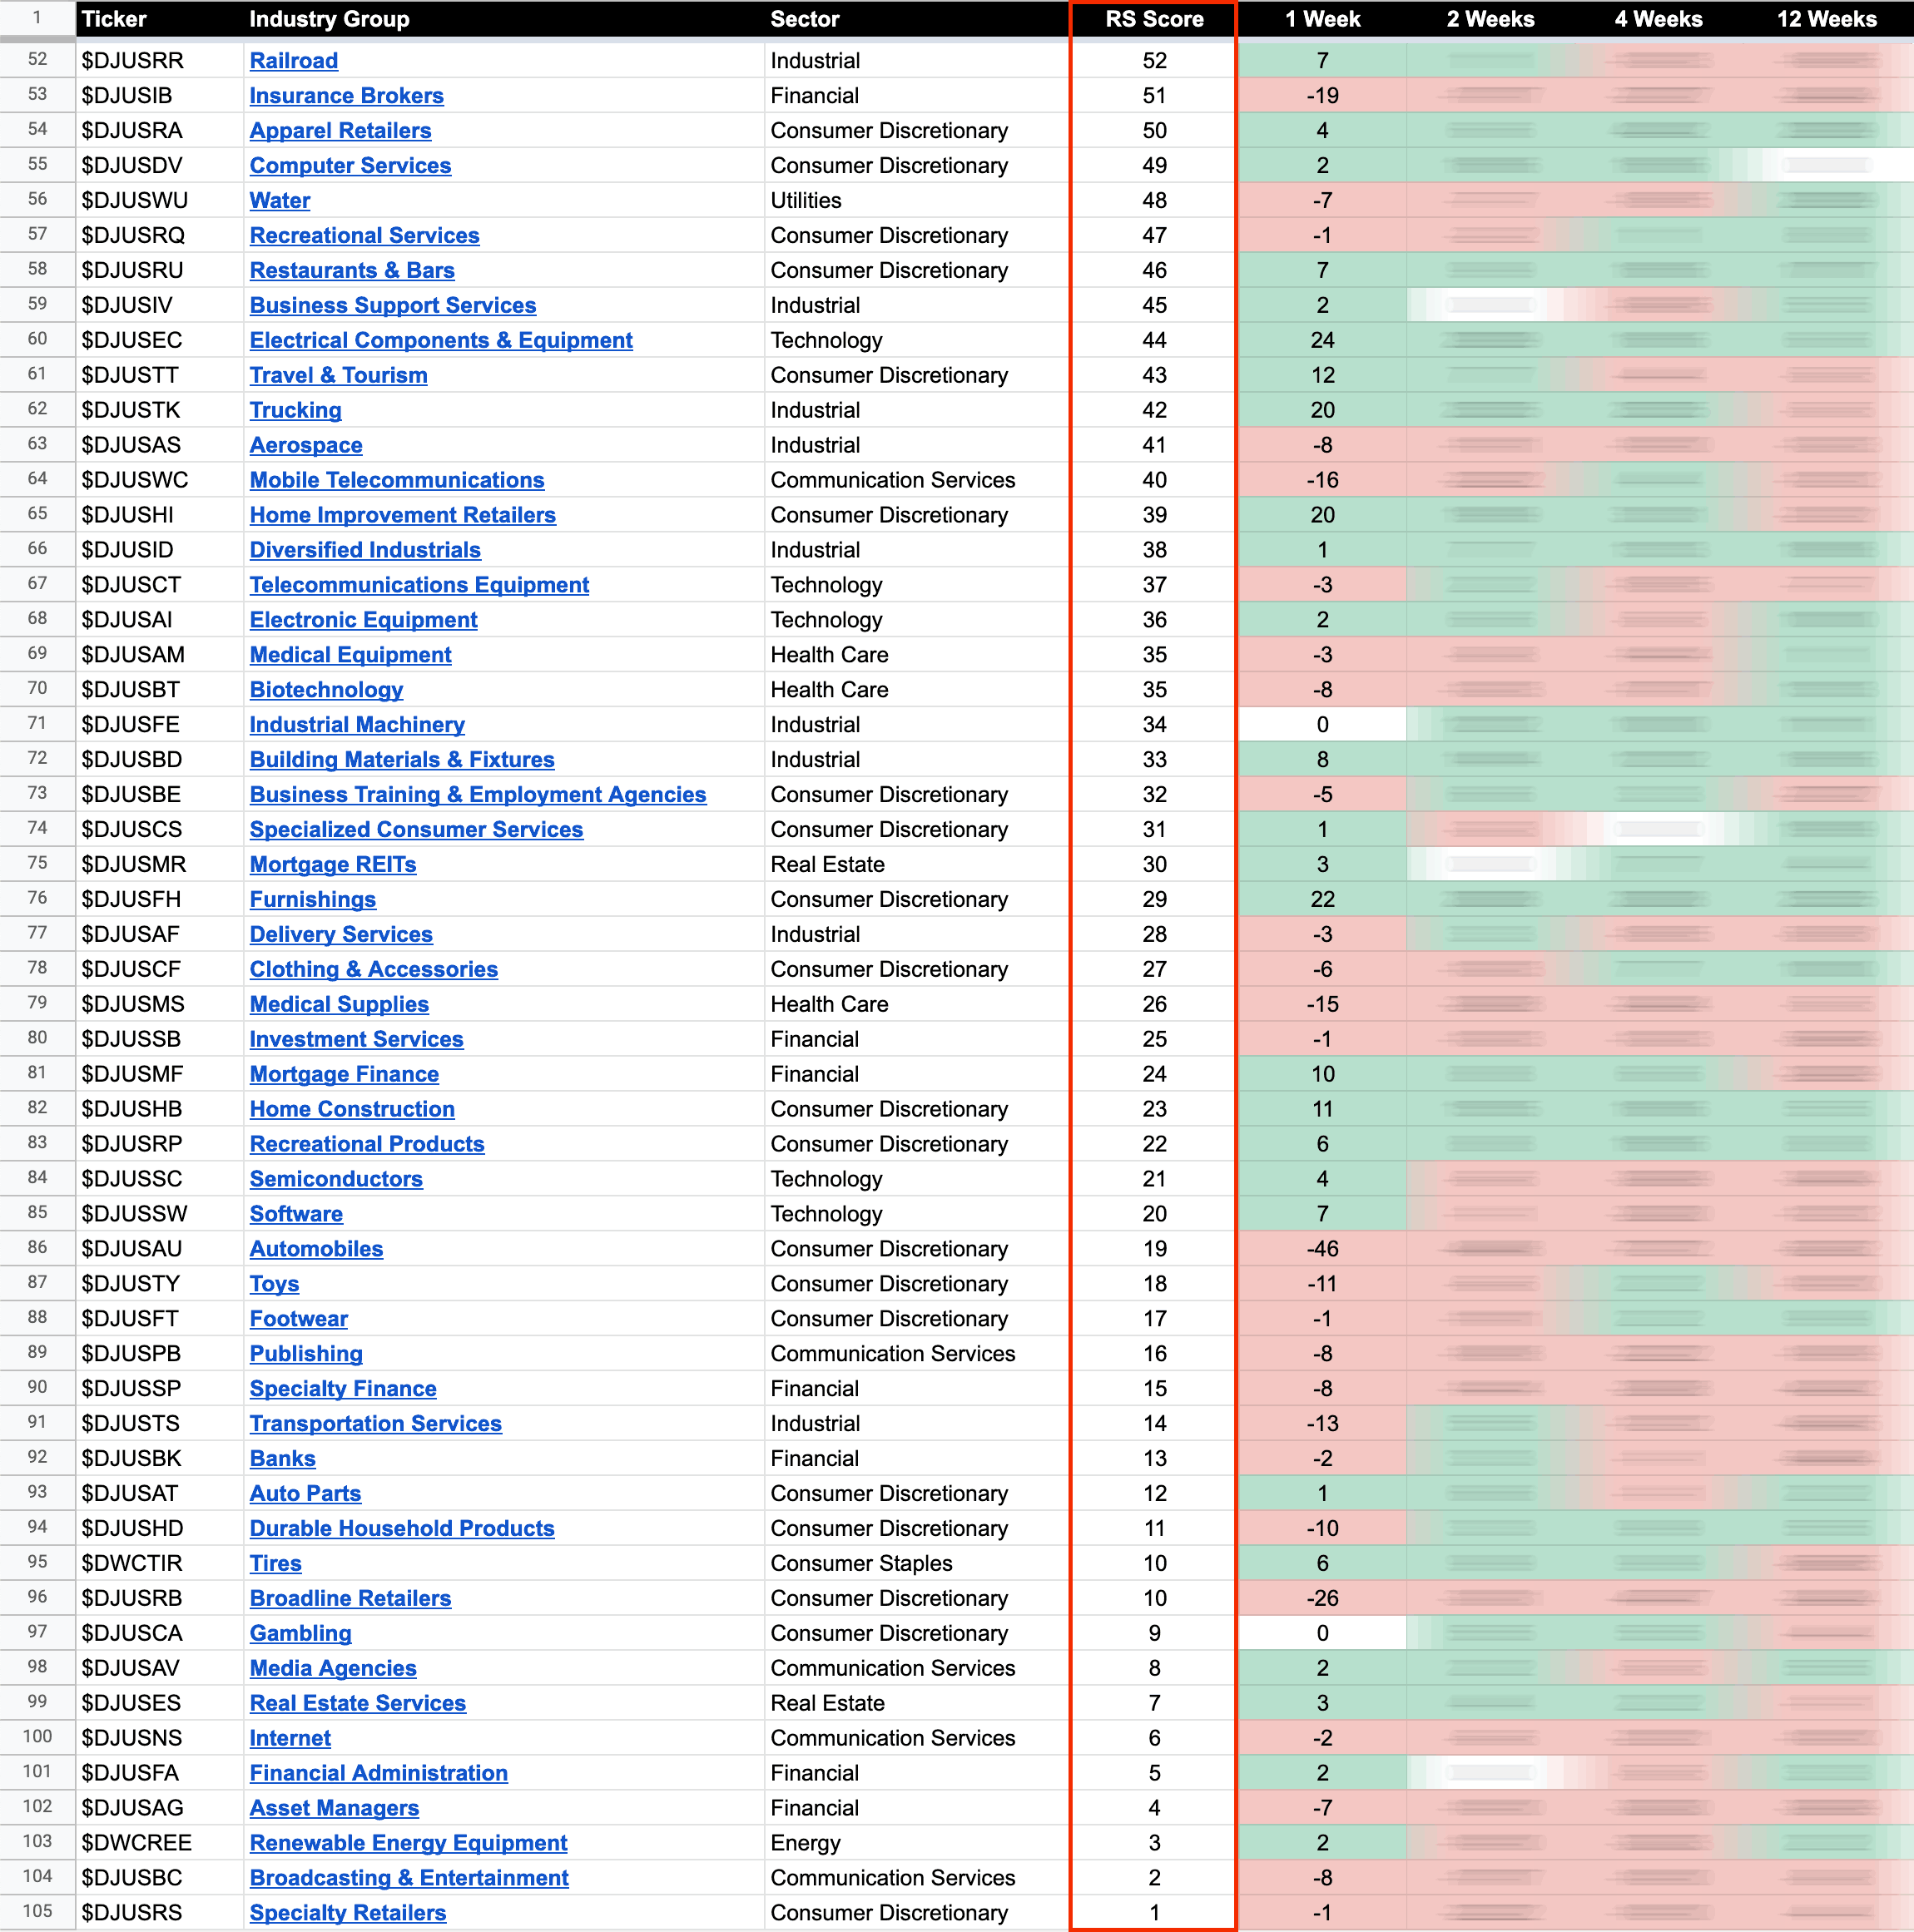
US Stocks Industry Groups – Relative Strength Rankings
Only 14 of the 104 Dow Jones US Industry Groups ended the week positive. So 86.5% of the groups had a negative week.
View the full post at: US Stocks Industry Groups Relative Strength Rankings
Market Breadth: Bullish Percent Index
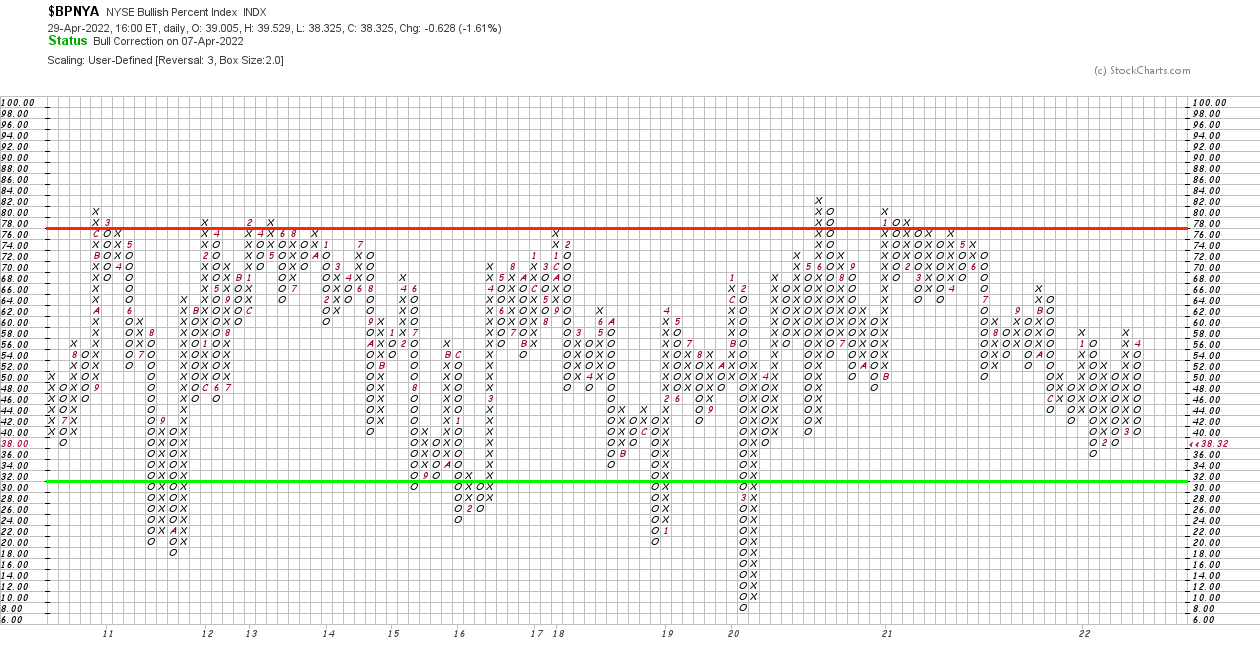
The NYSE Bullish Percent Index added a further five Os to it current column to close the week at 38.32%. However, as you can see from the long term chart below. During all the previous major Stage 4 declines it reached much lower levels. Hence, there's room for it to get a lot worse still.
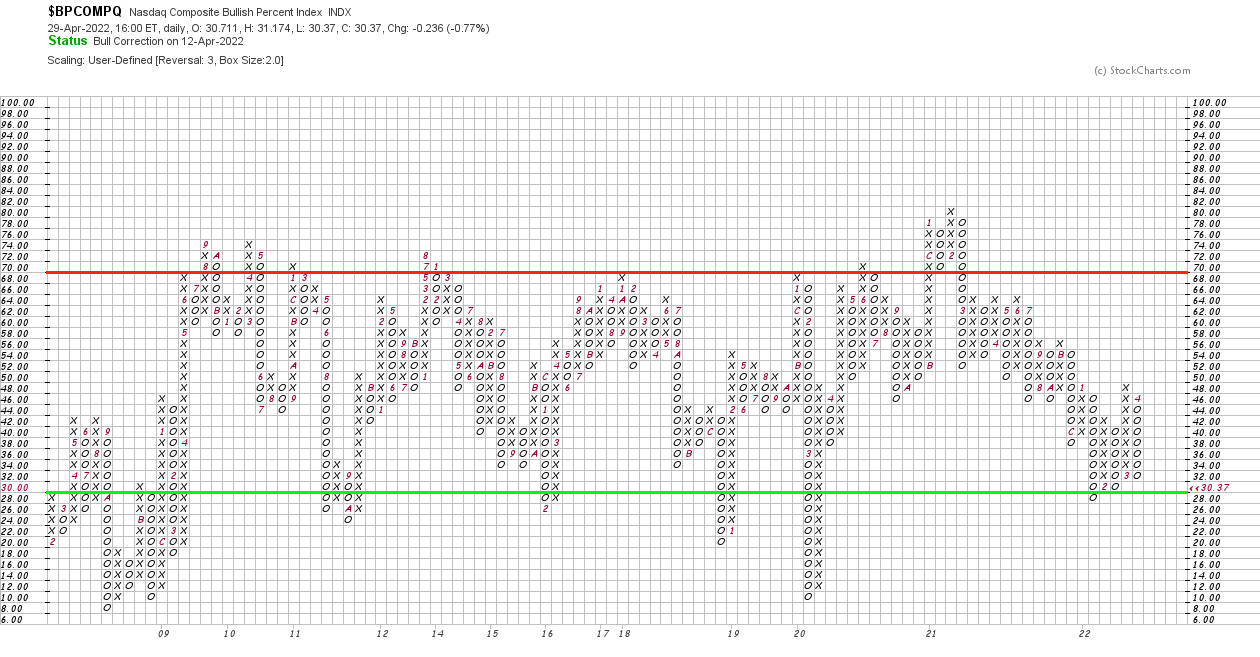
The Nasdaq Bullish Percent Index added a further three Os to it current column to close the week at 30.37%. But like the NYSE Bullish Percent Index chart, compared to other historical Stage 4 declines, there's still plenty of downside potential in the market if things deteriorate further.
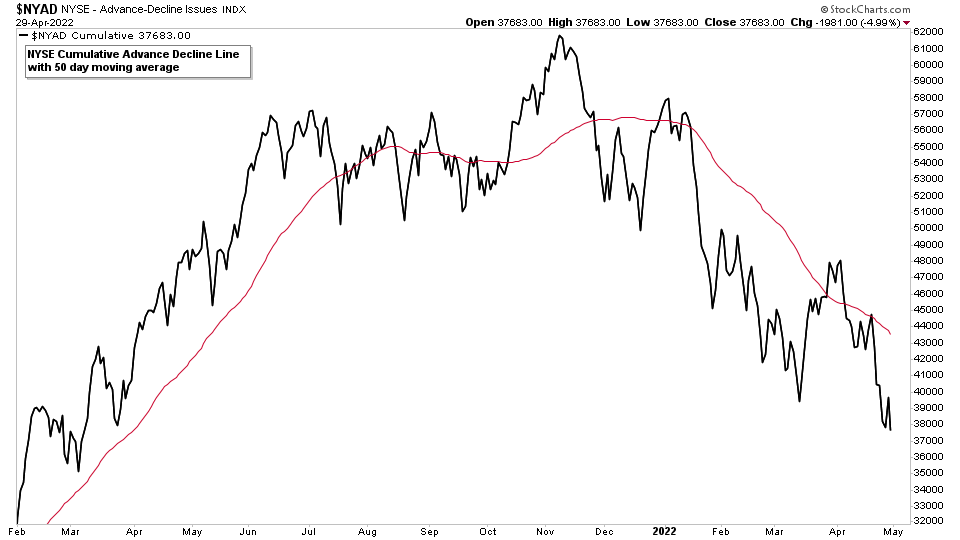
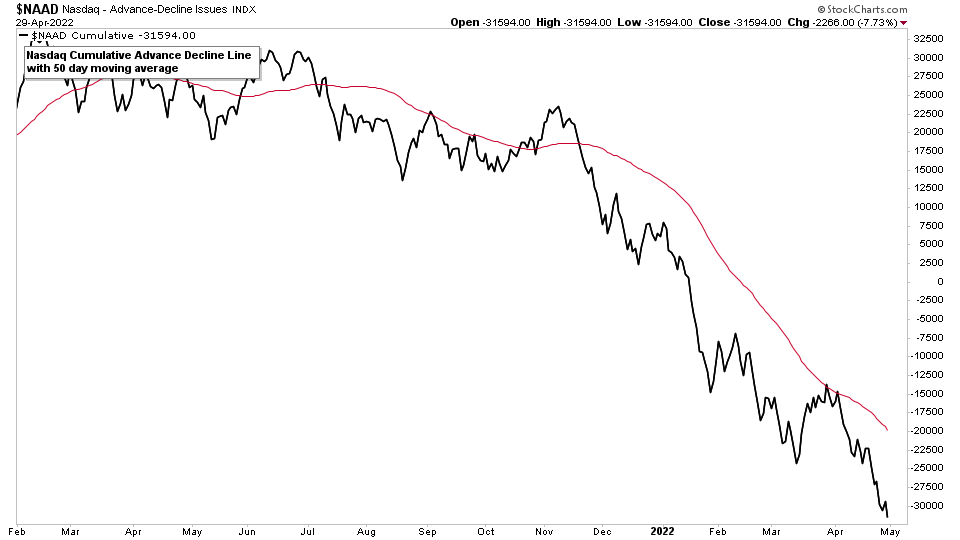
Market Breadth: Advance Decline Line
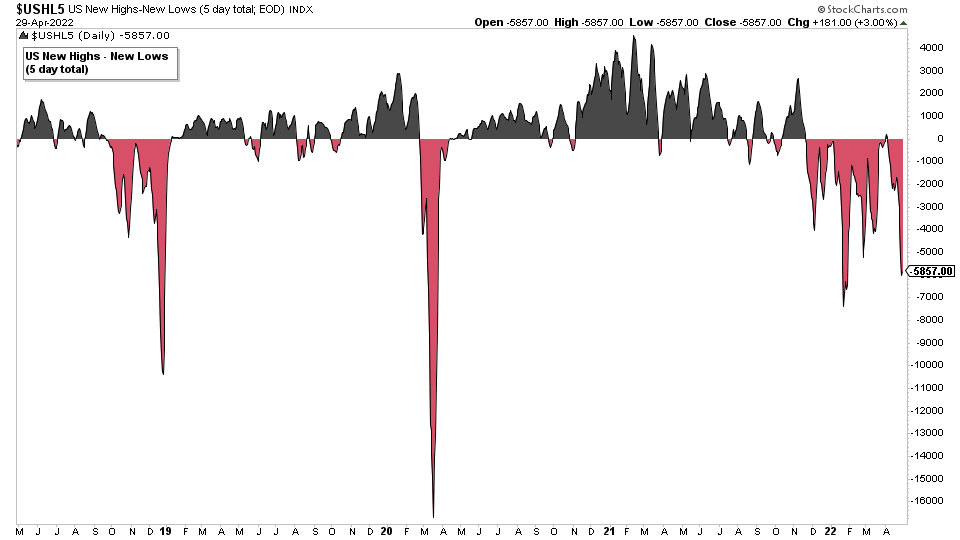
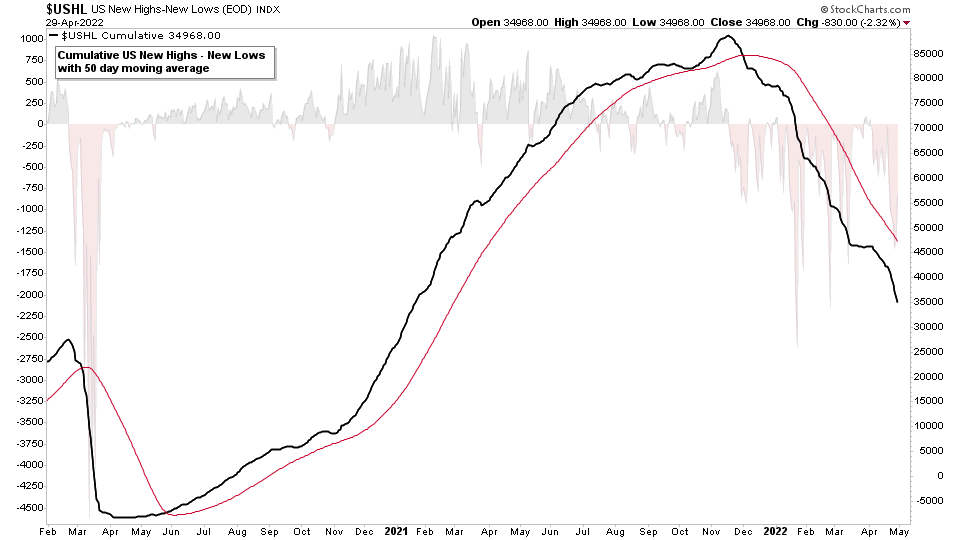
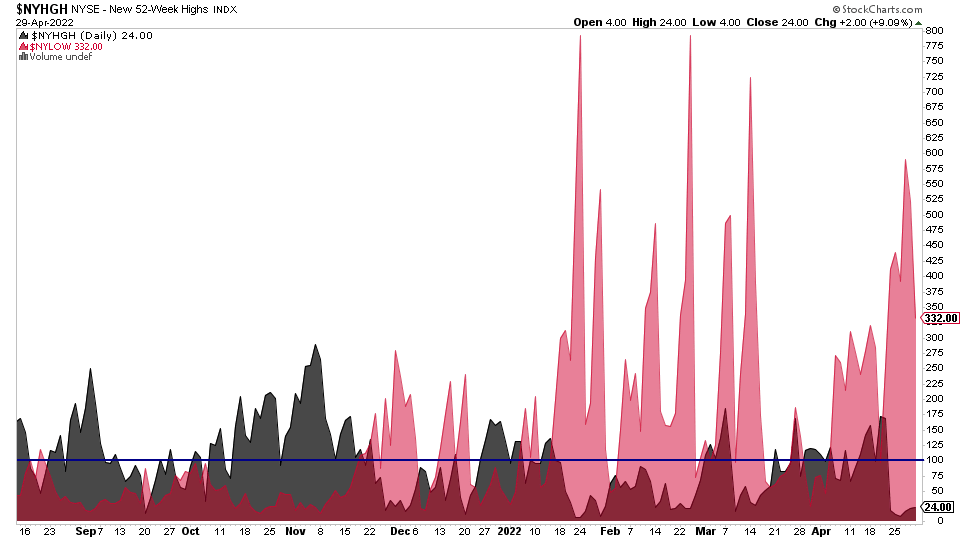
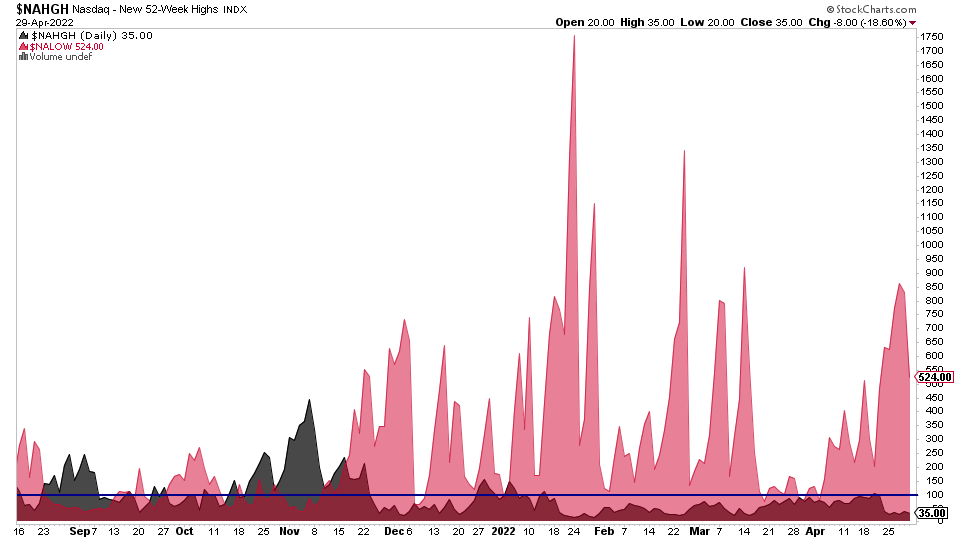
Market Breadth: New Highs - New Lows
Market Breadth: Cumulative Point & Figure Breakouts - Breakdowns
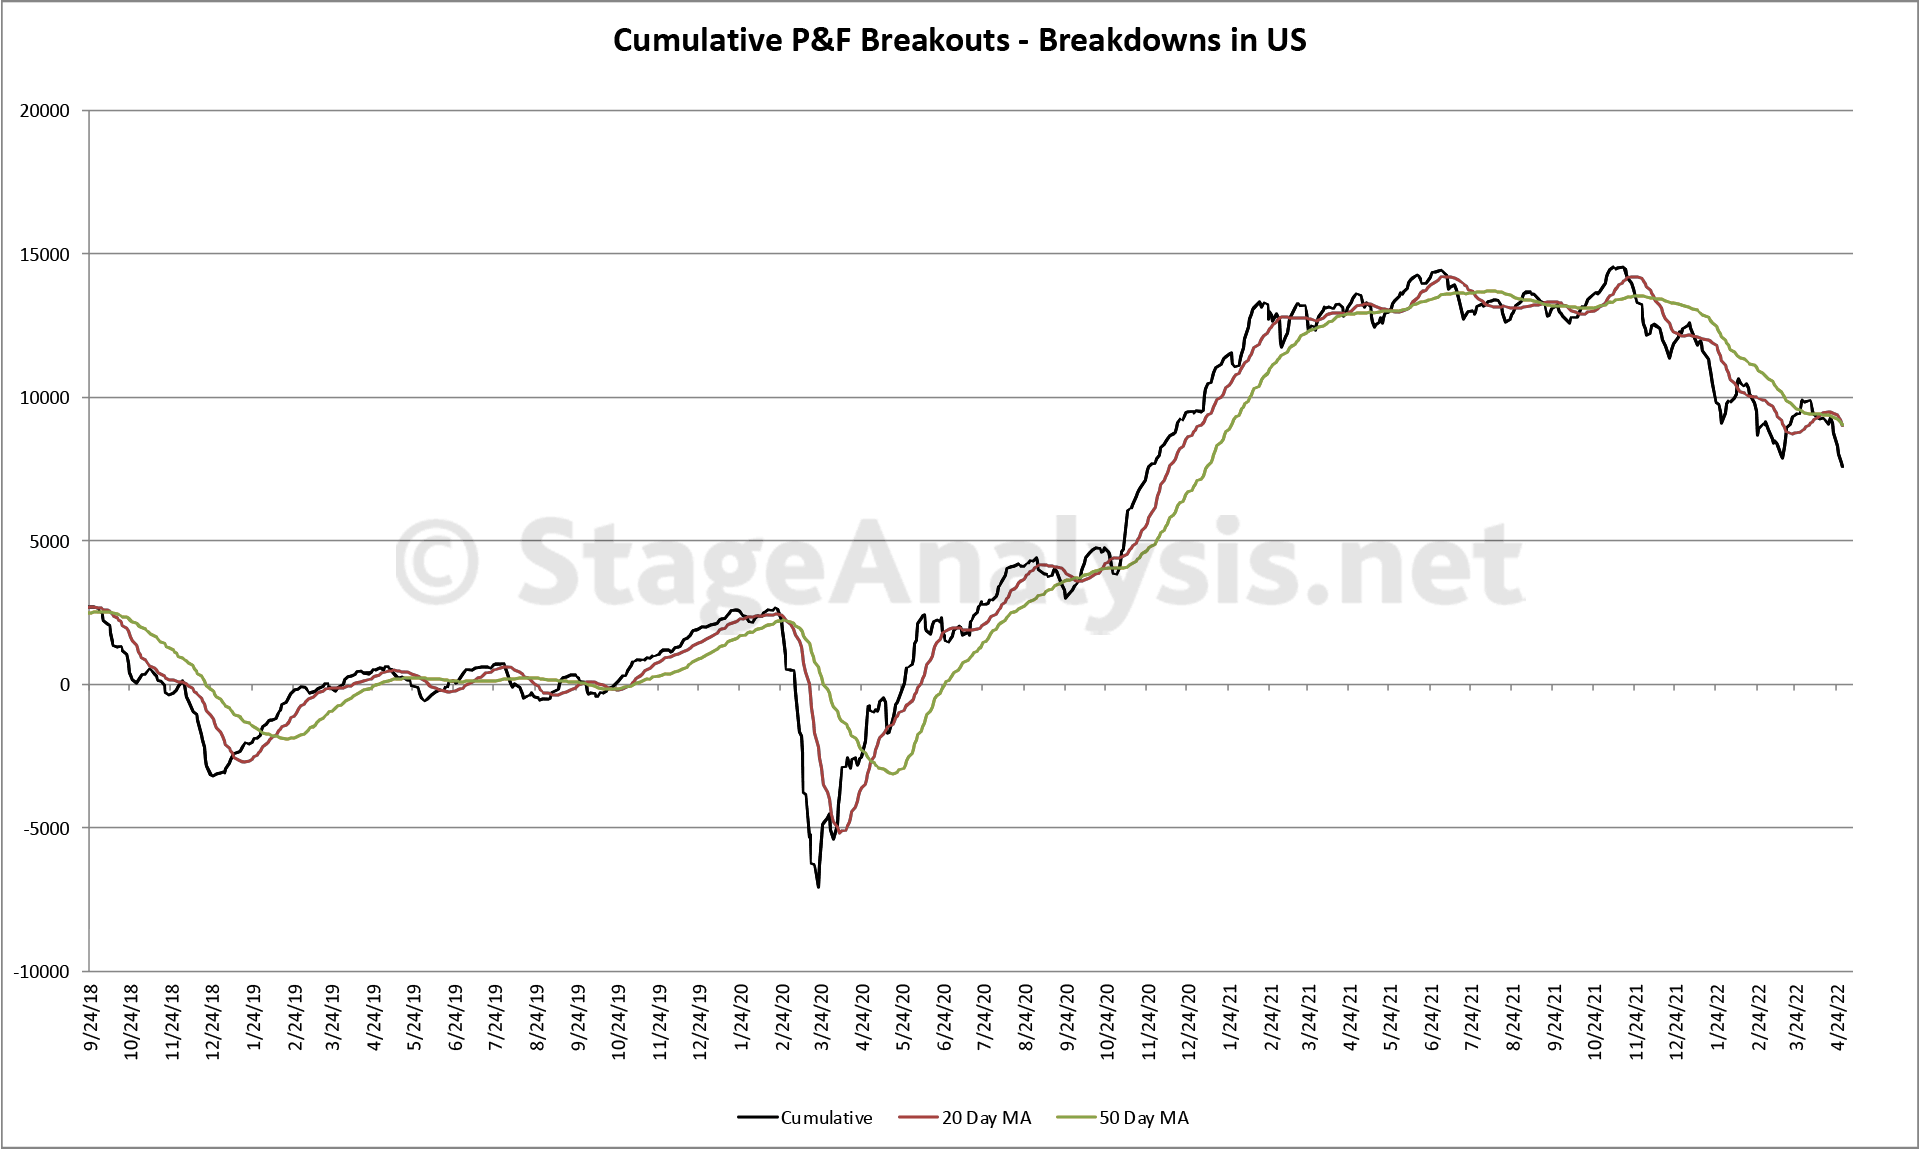
Totals for the week:
+211 double top stock breakouts
-1392 double bottom stock breakdowns
-1181 net stock breakouts - stock breakdowns
Status: Difficult Environment with Stage 4 continuation breakdown
Market Breadth: Percentage of Stocks Above their 50 Day, 150 Day & 200 Day Moving Averages Combined
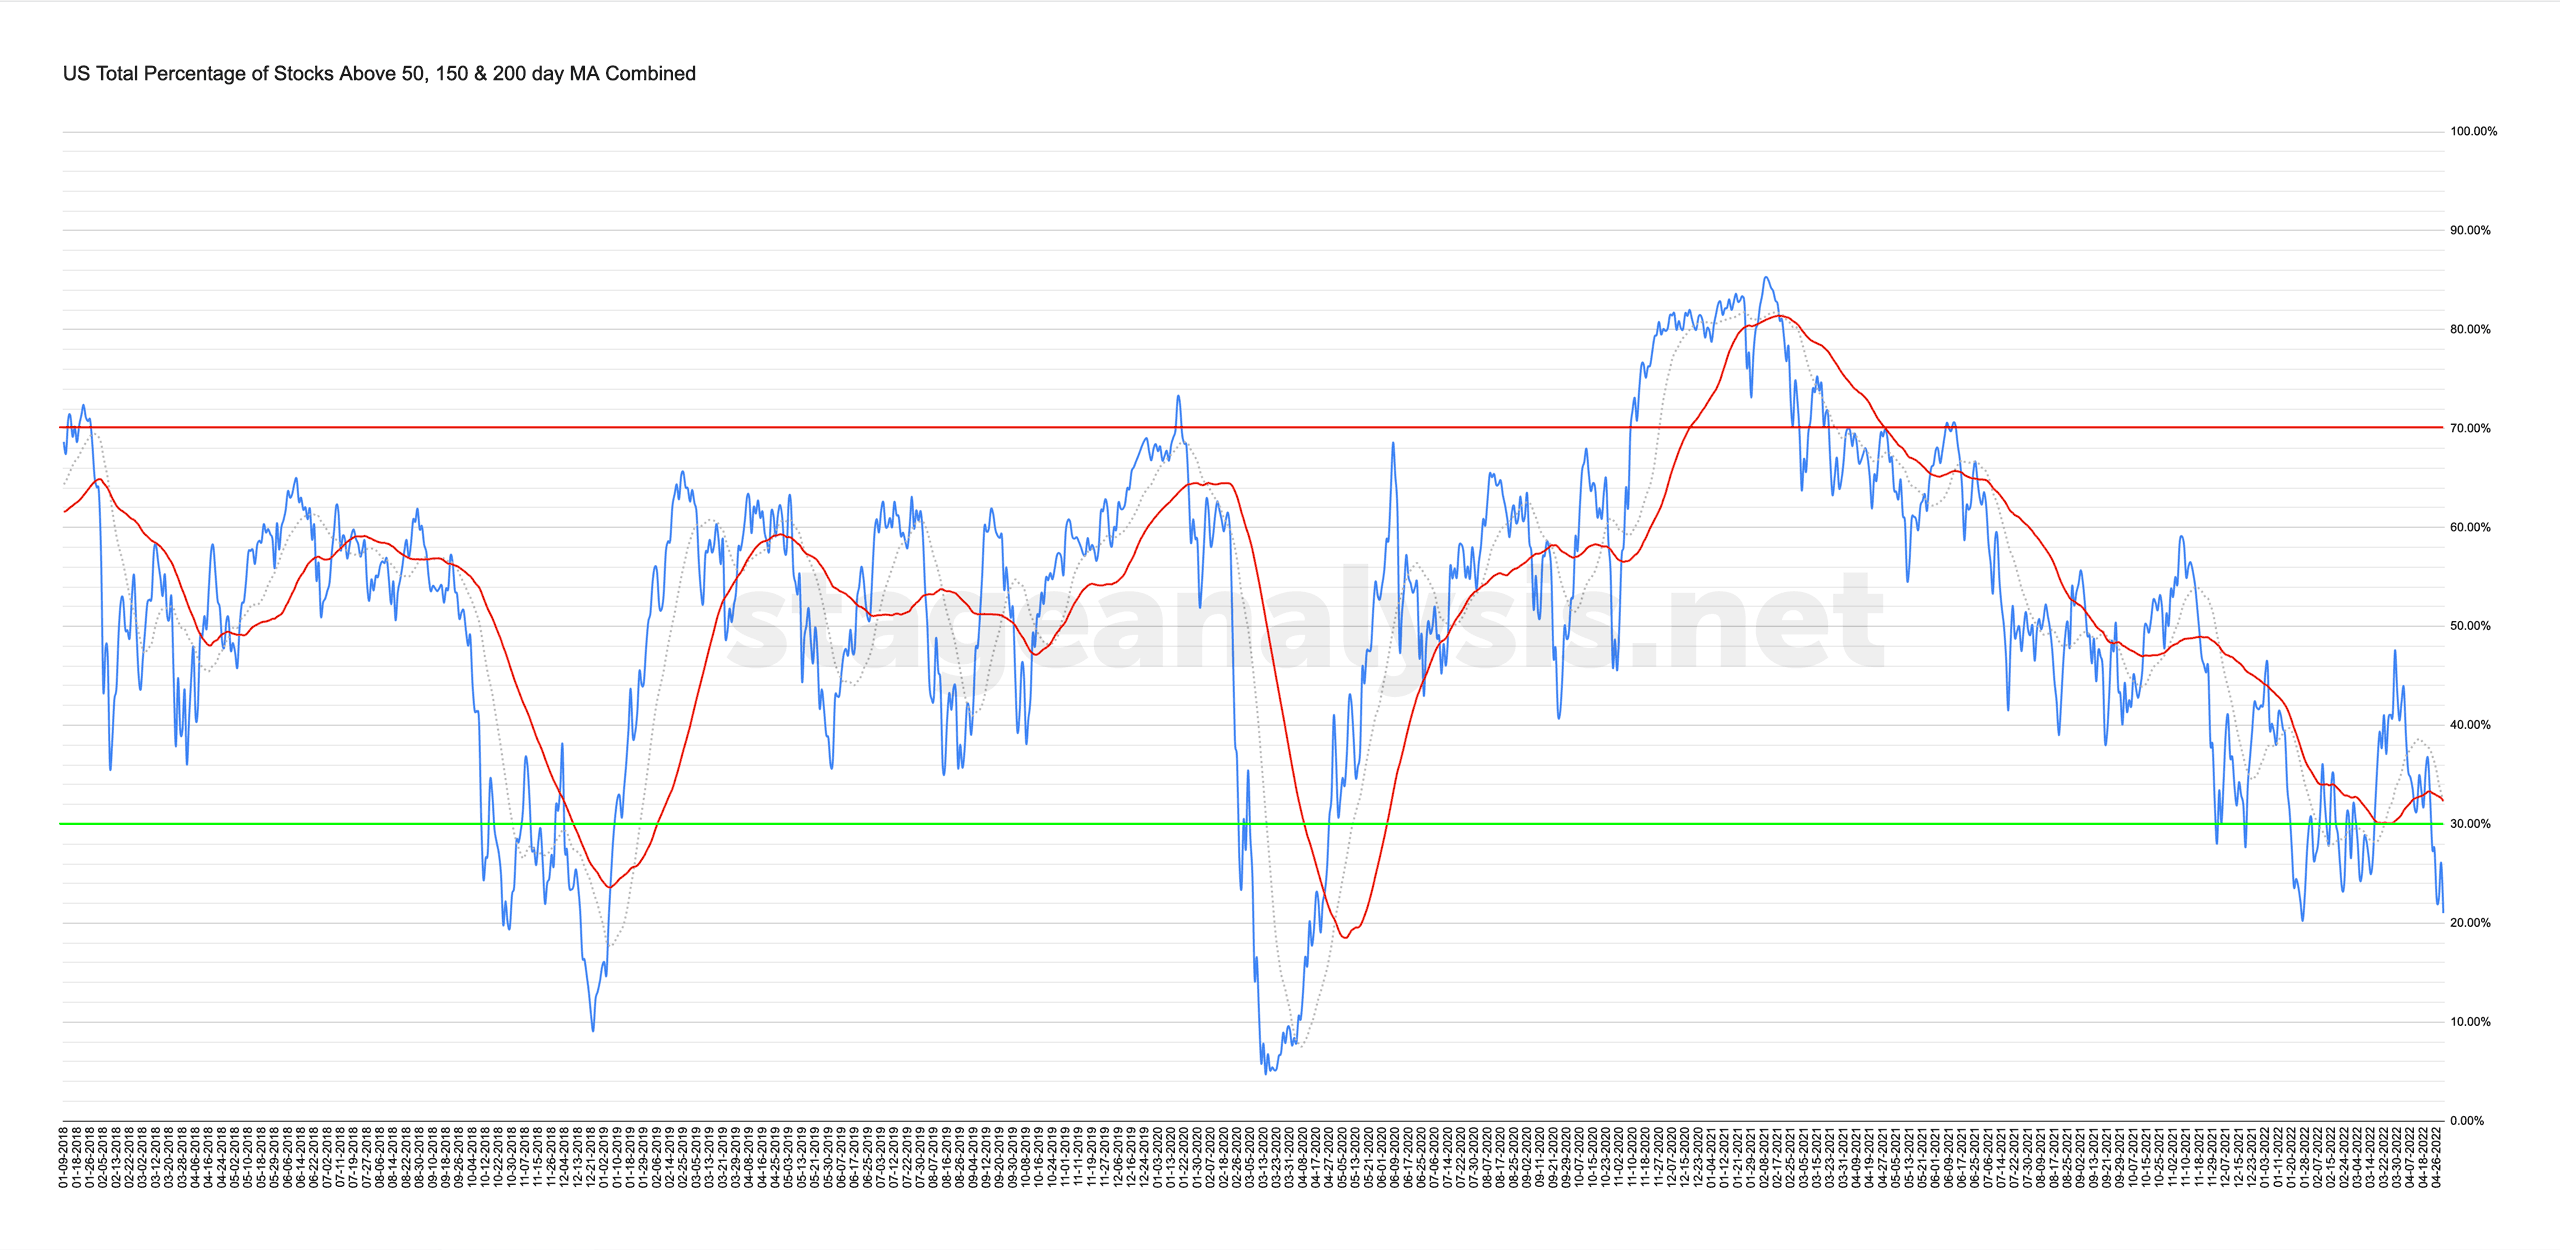
21.01% (-6.51% 1wk)
Status: Difficult Environment in Stage 4 zone
View the full post at: Market Breadth: Percentage of Stocks Above their 50 Day, 150 Day & 200 Day Moving Averages Combined
Final thoughts
Deterioration across the whole US stock market this week, with previously strong groups joining in with the selling that has been dominant in the Technology, Consumer Discretionary and growth stocks for a while now. So the under the surface Stage 4 decline that has been present for many months now, is finally becoming more main stream, with the large cap stock indexes finally succumbing to the pressure.
Therefore extreme caution on the long side seems prudent in the near term.
Become a Stage Analysis Member:
To see more like this – US Stocks watchlist posts, detailed videos each weekend, use our unique Stage Analysis tools, such as the US Stocks & ETFs Screener, Charts, Market Breadth, Group Relative Strength and more...
Join Today
Disclaimer: For educational purpose only. Not investment advice. Seek professional advice from a financial advisor before making any investing decisions.