
Market Breadth: Percentage of Stocks Above their 50 Day, 150 Day & 200 Day Moving Averages Combined
The full post is available to view by members only. For immediate access:
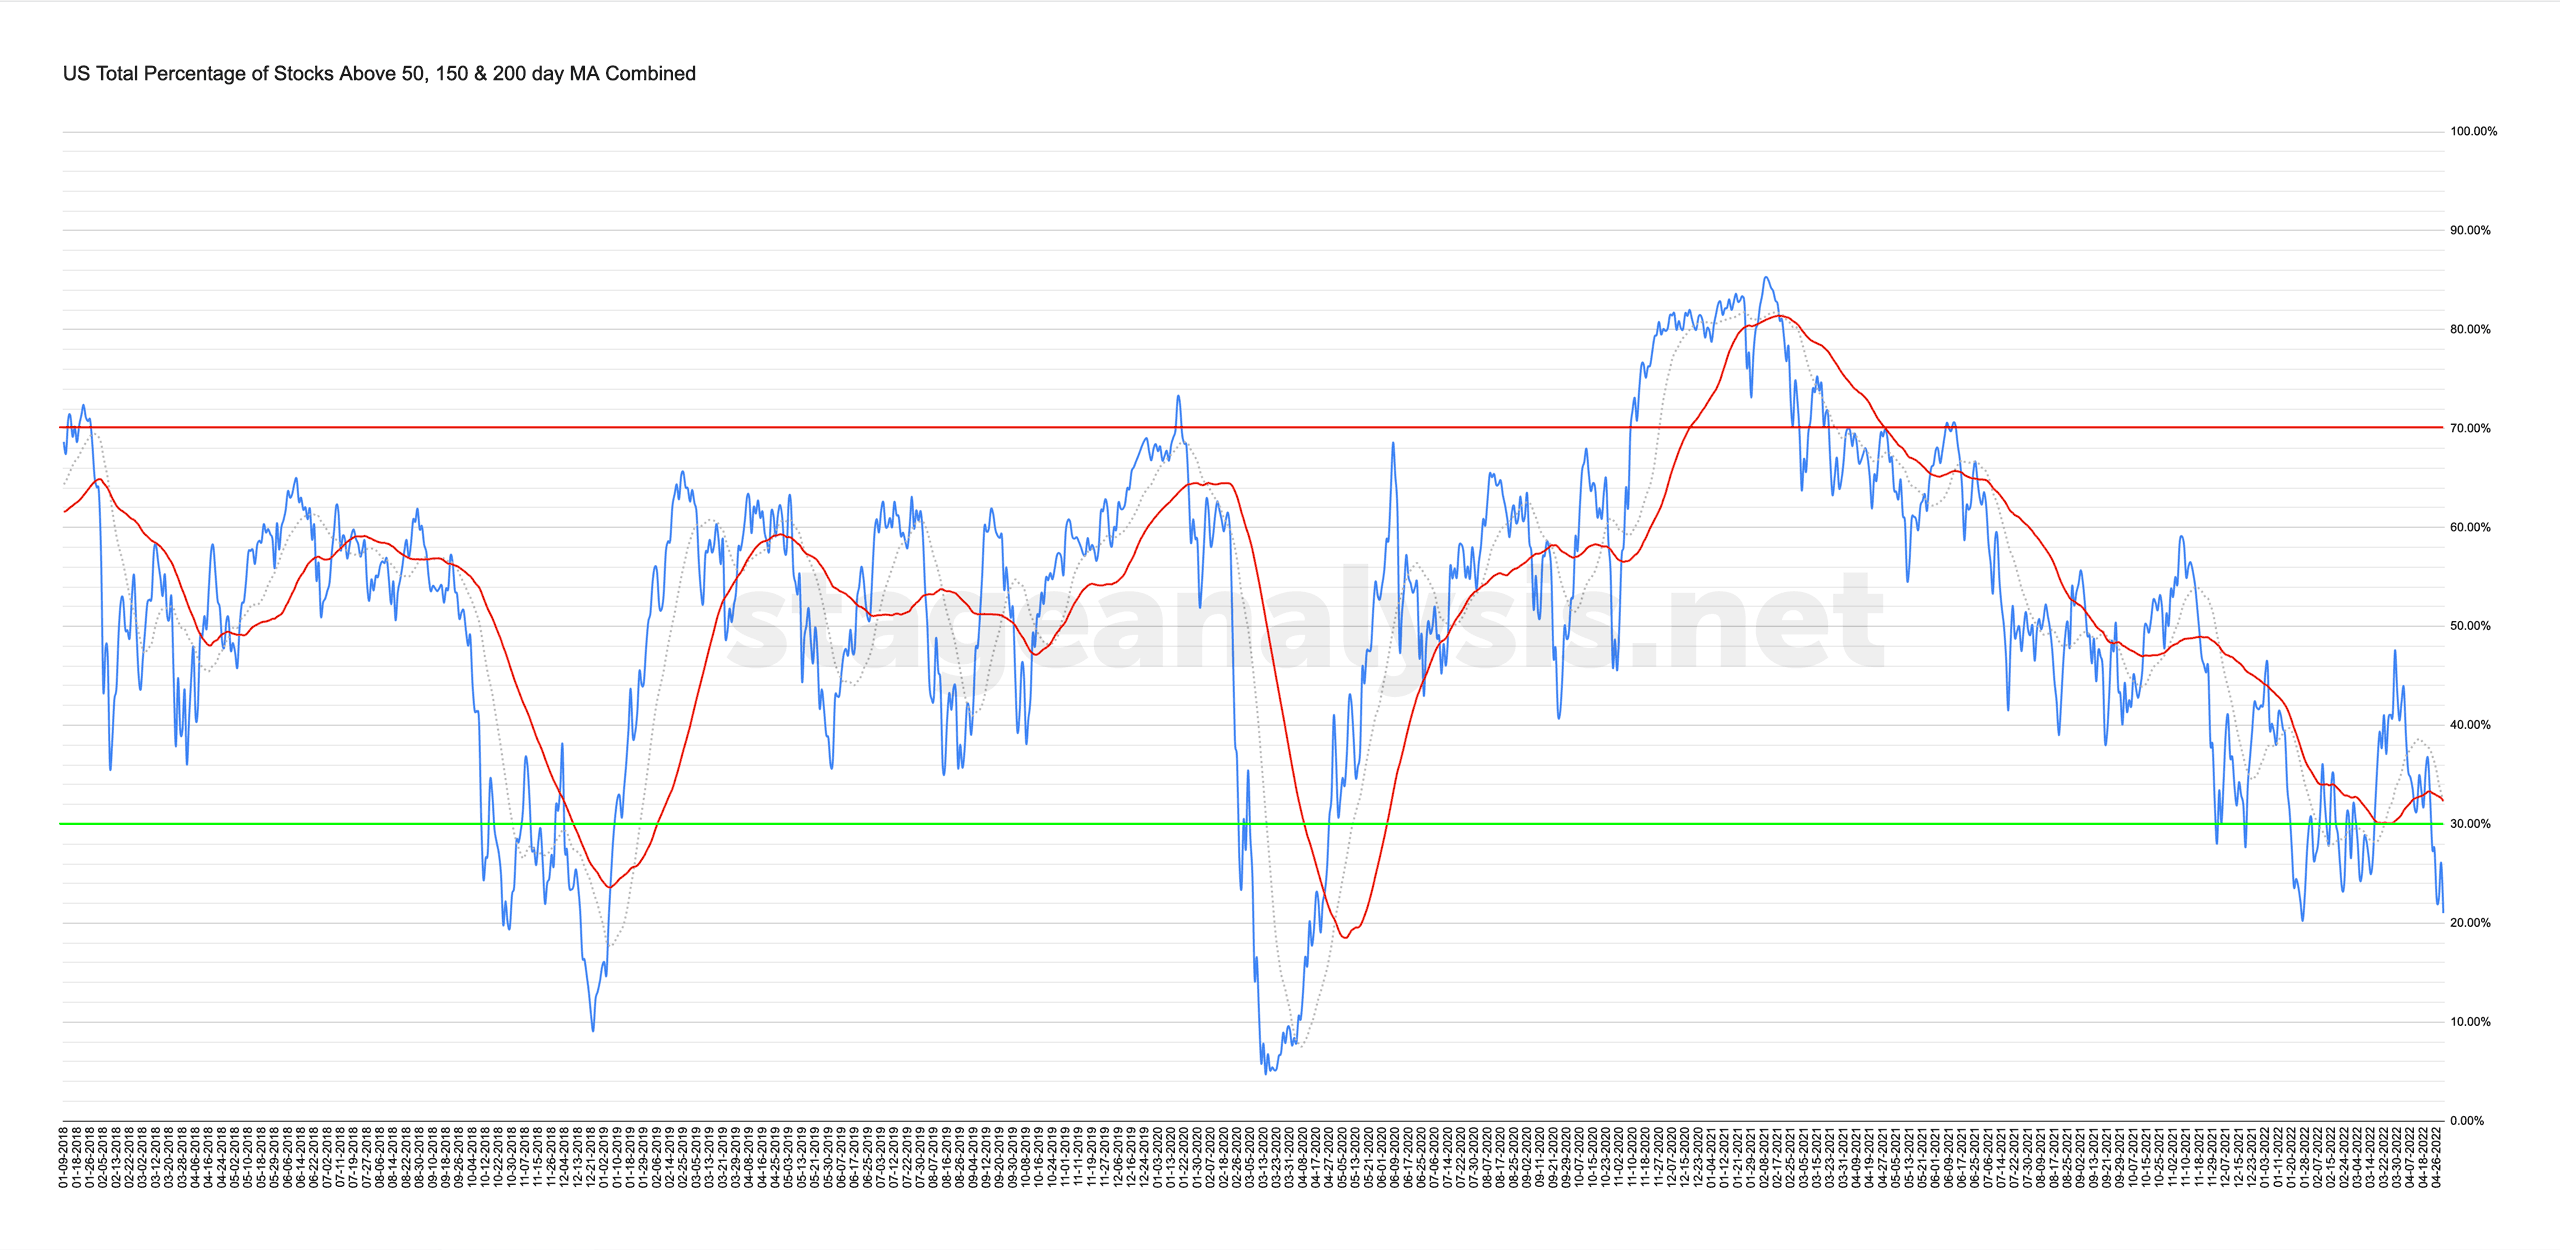
21.01% (-6.51% 1wk)
Status: Difficult Environment in Stage 4 zone
The US Total Percentage of Stocks Above their 50 Day, 150 Day & 200 Day Moving Averages Combined chart declined a further -6.51% this week to close the week at an extremely low figure of 21.01%. So only just over 1/5th of stocks in the US market are above their short, medium and long term moving averages, or another way of looking at it, is that 78.99% of stocks are below their MAs, and hence it is an extremely bearish reading that we've only reached a few times in the last five years. Which was during the last two Stage 4 declines in late 2018 and March 2020.
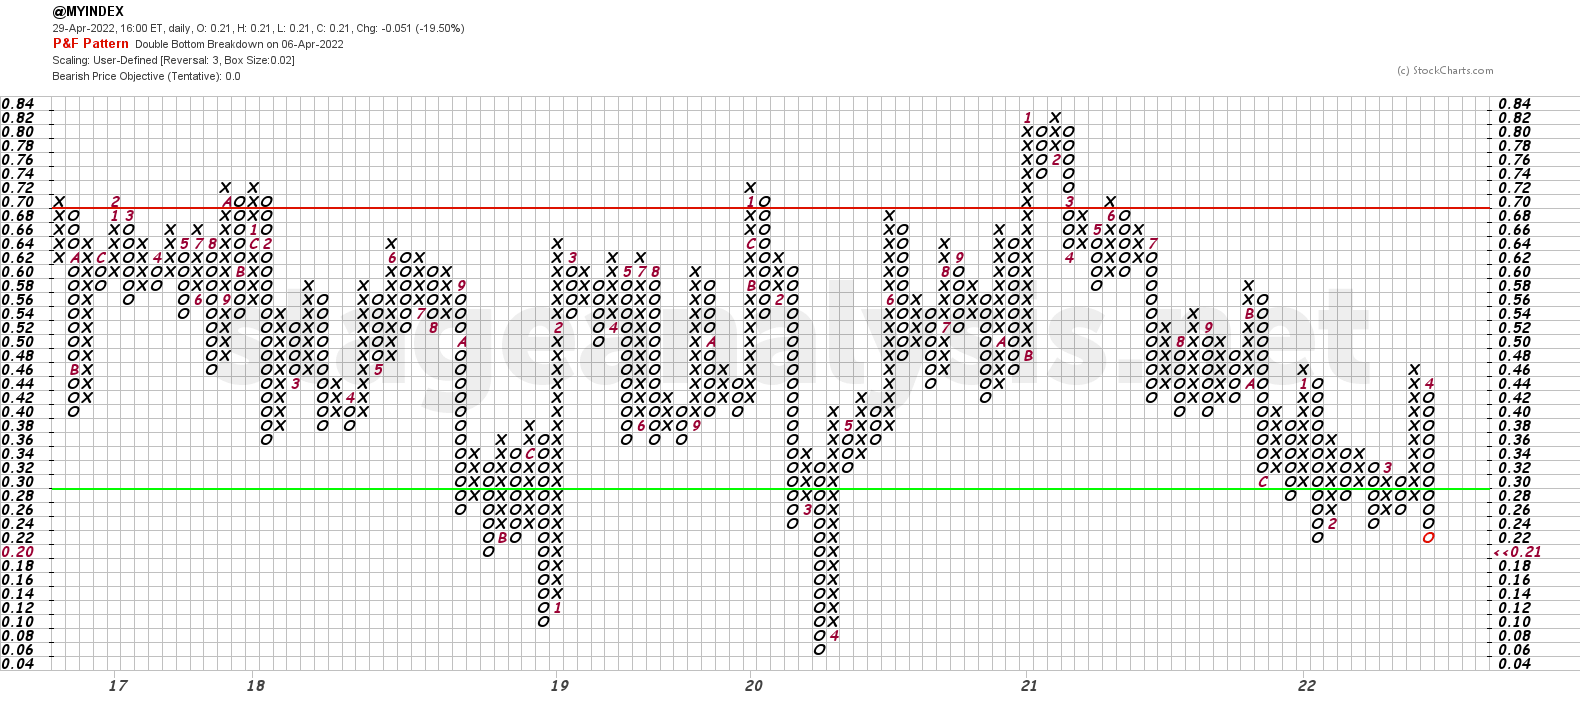
The Point and Figure chart (see below), added a further 3 Os to its current column with a double bottom breakdown on Tuesday, changing its P&F status to Bear Confirmed once more. So it remains on Defense (in a column of Os) and Difficult Environment Status in the lower zone, and hence the risk is now extremely elevated, with the possibility of a Stage 4 capitulation type move (climactic action) in the market significantly increased.
I'll discuss this in more detail in the members weekend video (due out later on Sunday afternoon EST)
Disclaimer: For educational purpose only. Not investment advice. Seek professional advice from a financial advisor before making any investing decisions.