
Market Breadth: Percentage of Stocks Above their 50 Day, 150 Day & 200 Day Moving Averages Combined
The full post is available to view by members only. For immediate access:
49.85% (+4.18% 1wk)
Status: Difficult Environment
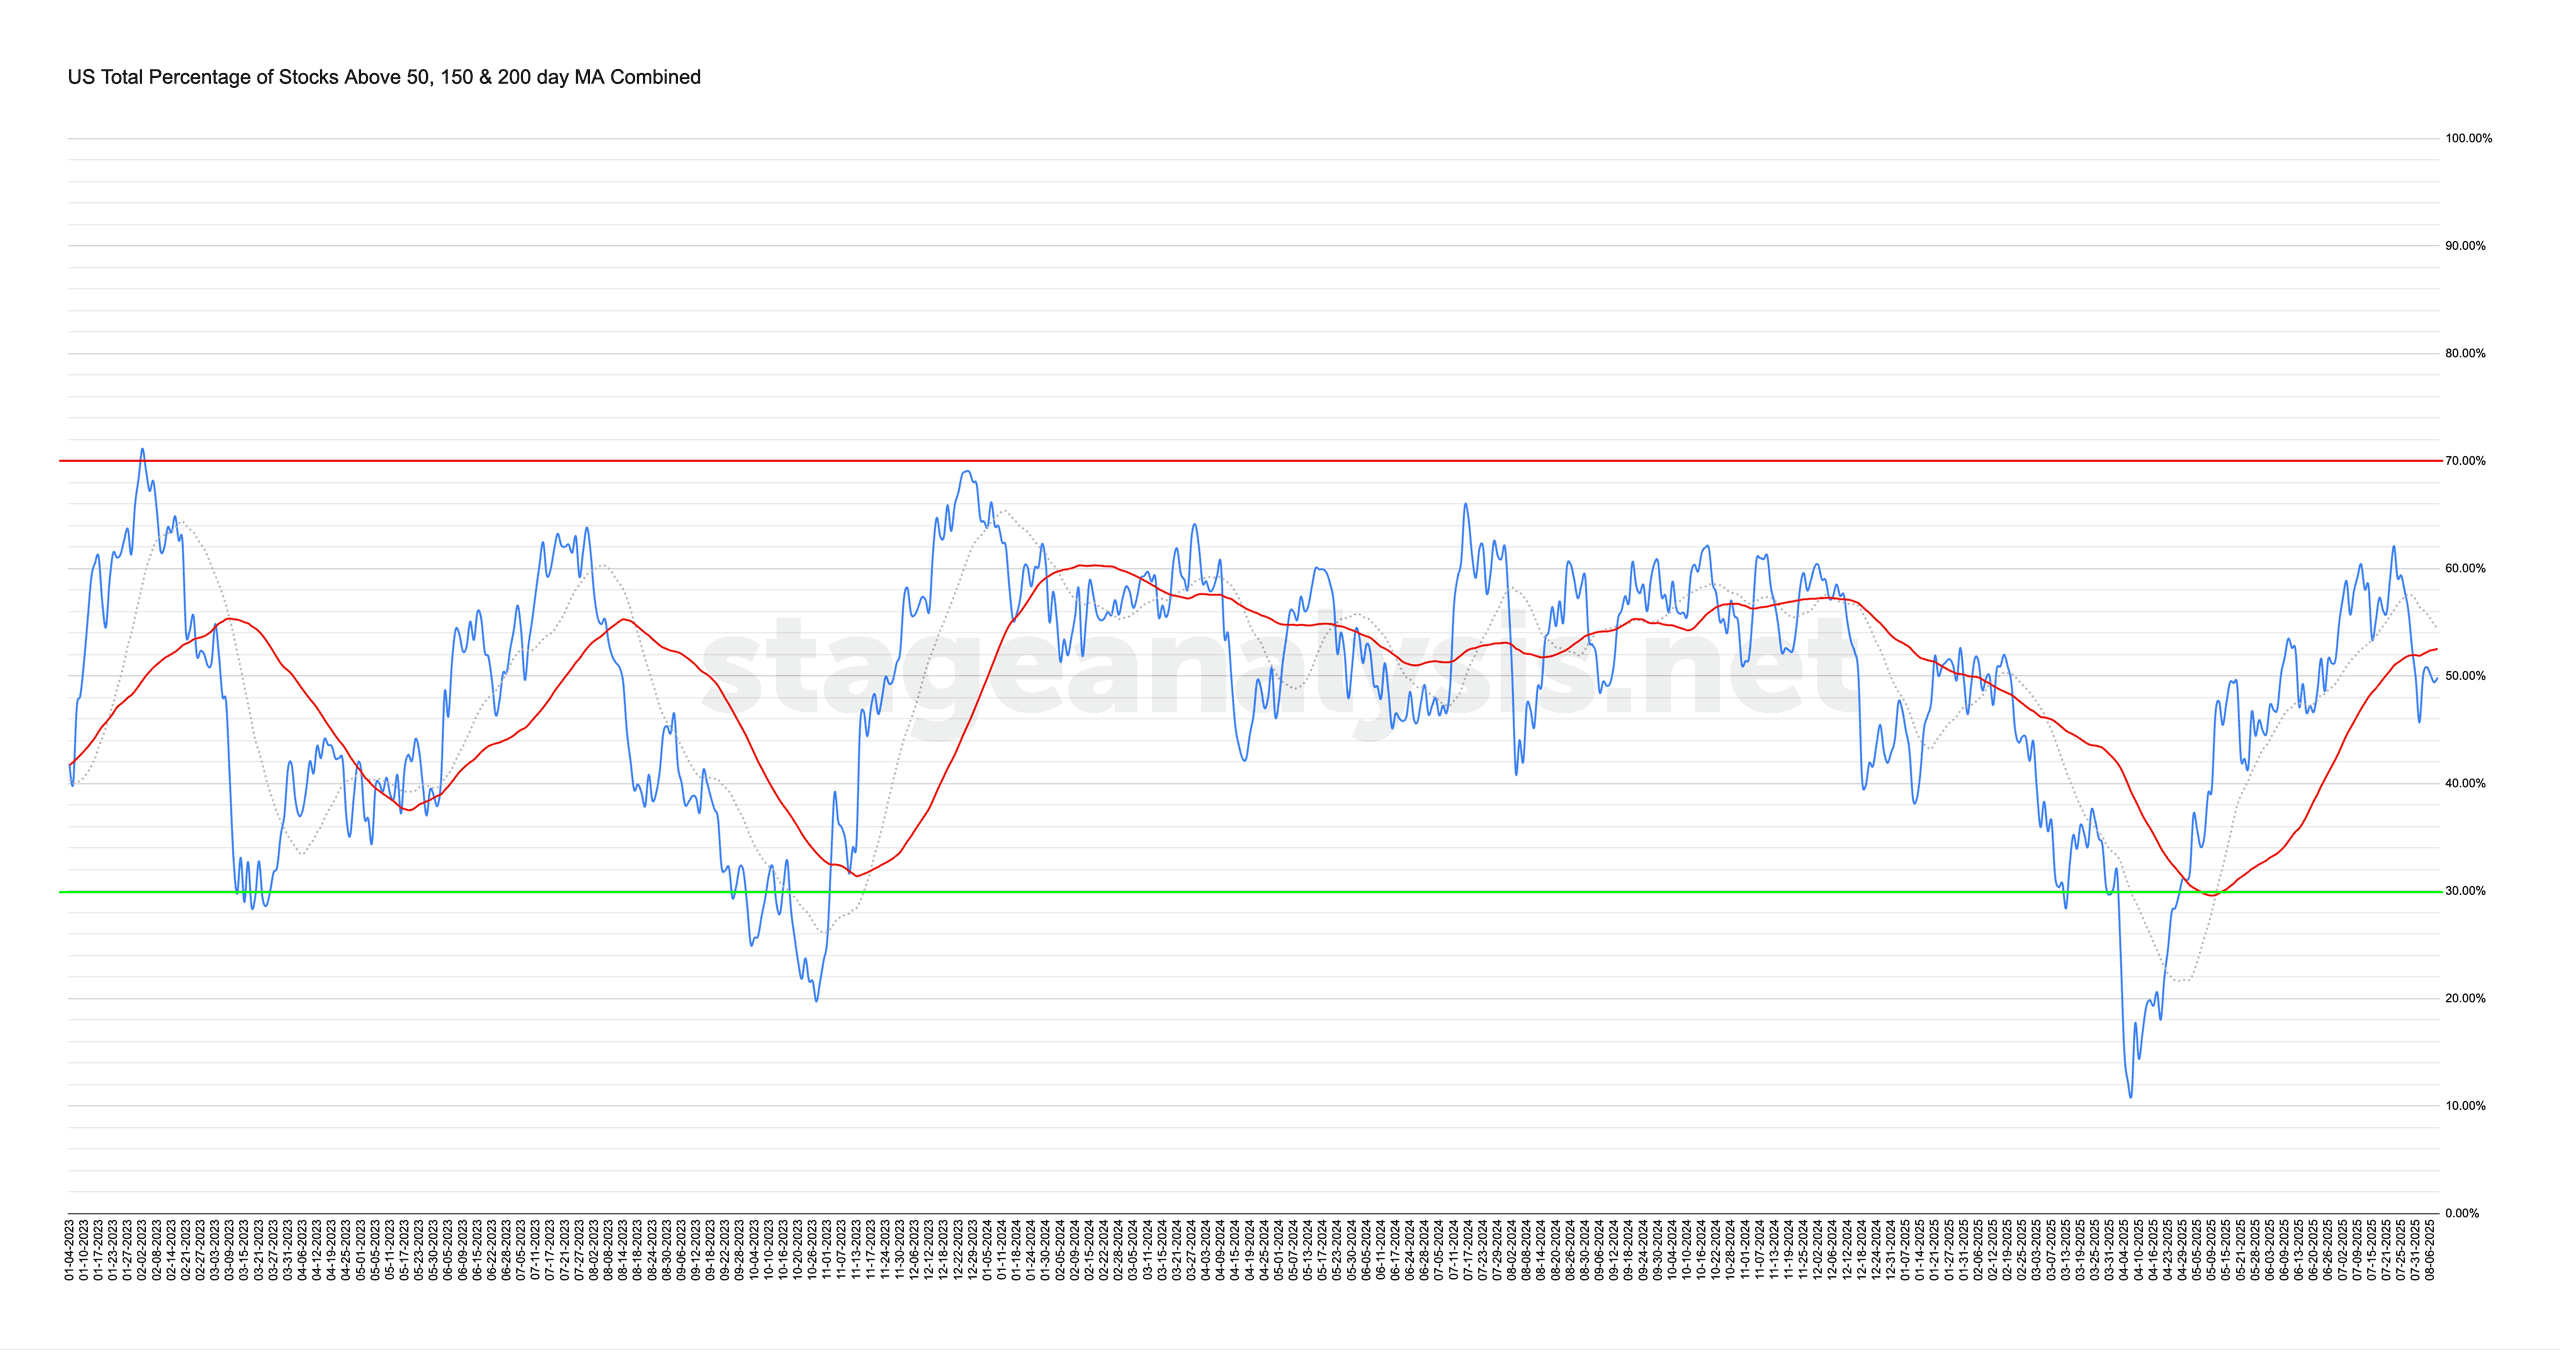
The US Total Percentage of Stocks above their 50 Day, 150 Day & 200 Day Moving Averages (shown above) increased by +4.18% this week.
Therefore, the overall combined average is at 49.85% in the US market (NYSE and Nasdaq markets combined) above their short, medium and long term moving averages.
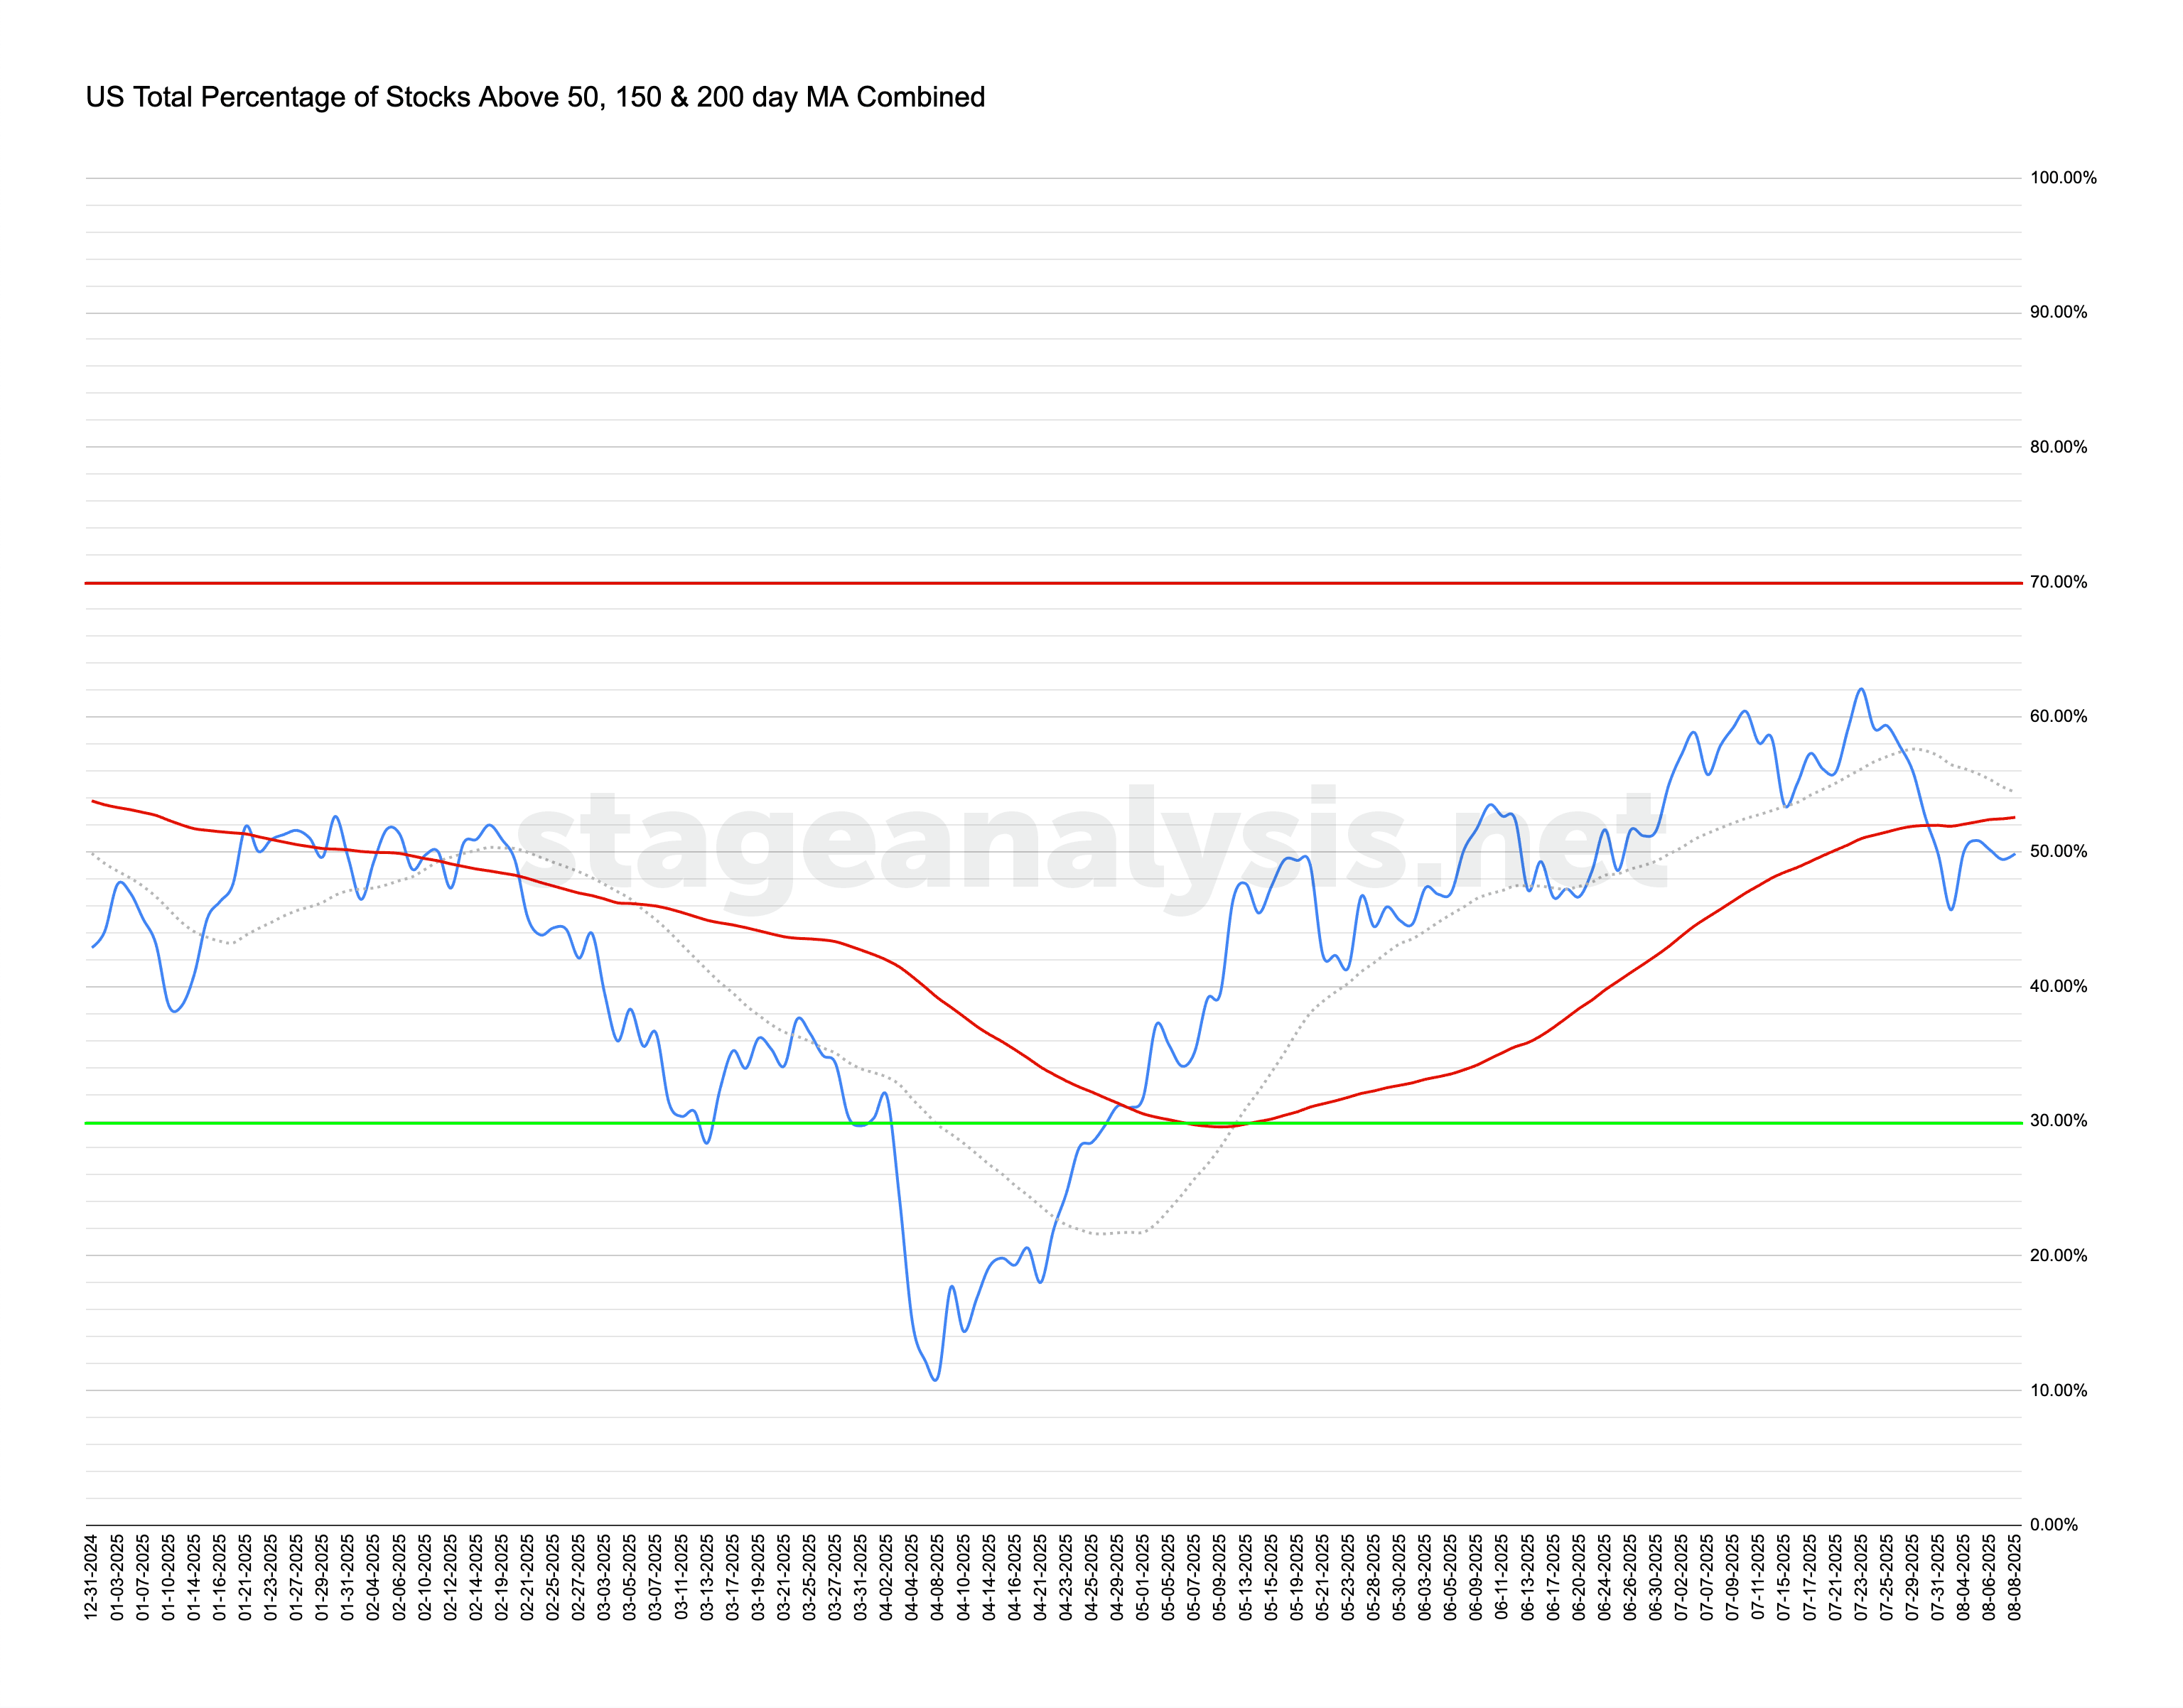
The combined average rebounded a little bit this week, regaining around 1/3 of the previous weeks decline, but it wasn't enough to regain either of the moving averages, closing -4.33% below its short-term 20 day MA and -2.69% below its 50 day MA (signal line). But in a very neutral overall field position, just under the 50% level.
So it remains on a Difficult Environment status to start the new week, but in close proximity of the moving averages. Hence, the very short-term breadth measures will be in particular focus next week.
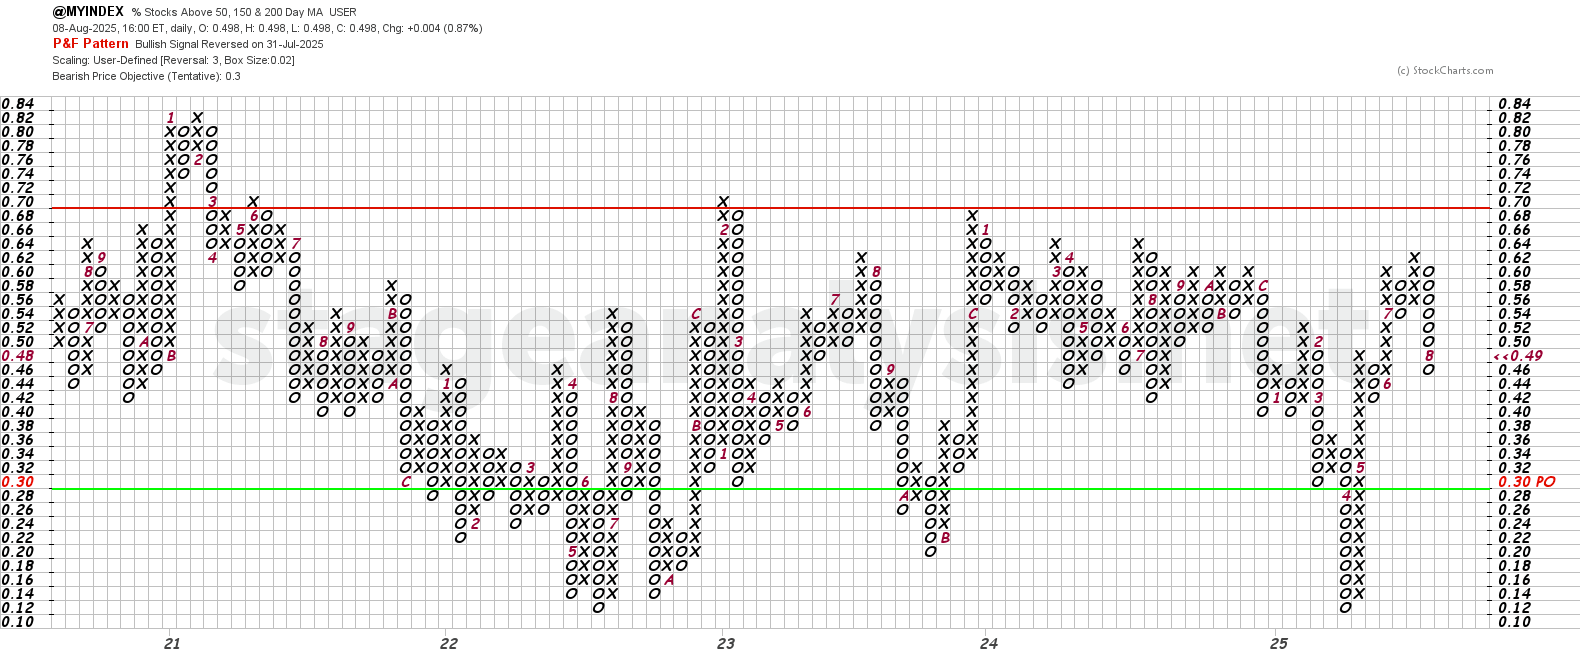
The Point and Figure (P&F) chart (shown above) was unchanged this week in a column of Os. So the P&F strategy remains on Defense (as it is in a column of Os), and P&F Bear Confirmed status in the middle of the field.
To reverse to a column of Xs (Offense) from the current position, it needs to close above the 52% level.
See the Bullish Percent article for more information on the P&F statuses.
Become a Stage Analysis Member:
To see more like this – US Stocks watchlist posts, detailed videos each weekend, use our unique Stage Analysis tools, such as the US Stocks & ETFs Screener, Charts, Market Breadth, Group Relative Strength and more...
Join Today
Disclaimer: For educational purpose only. Not investment advice. Seek professional advice from a financial advisor before making any investing decisions.