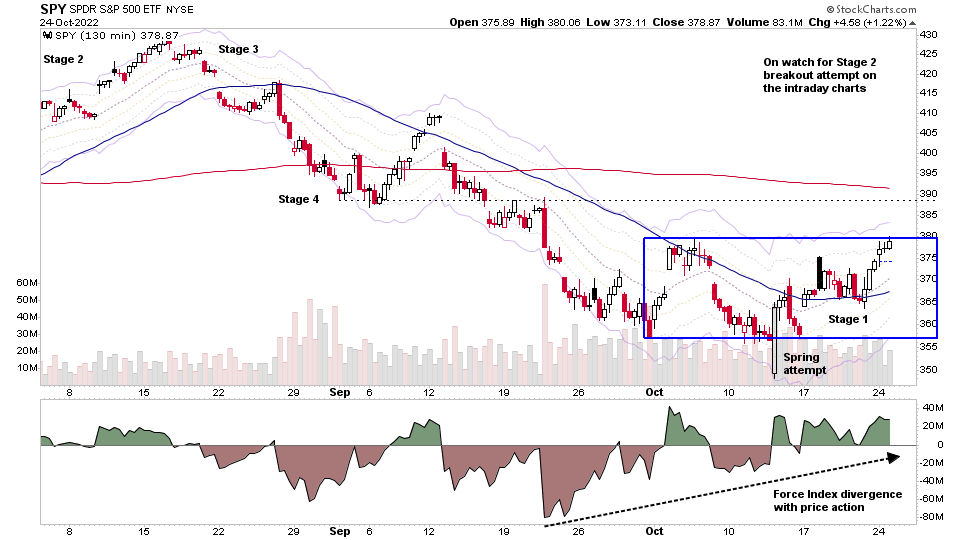
The S&P 500 (shown above via the SPY etf intraday 130 minute chart – 3 bars/day) continued higher towards the top of the October range that's developed as a Stage 1 base structure on the lower intraday timeframes, and is now testing the top of the range...
Read More

Blog
23 October, 2022
Stage Analysis Members Video Part 2 – 23 October 2022 (58 mins)
Part 2 of the regular members weekend video discussing the market, commodities, industry groups and market breadth to determine the weight of evidence.
Read More
23 October, 2022
Stage Analysis Members Video Part 1 – 23 October 2022 (43 mins)
Part 1 of the weekend video discussing the watchlist stocks from Thursday and the Weekend watchlist posts.
Read More
23 October, 2022
US Stocks Watchlist – 23 October 2022
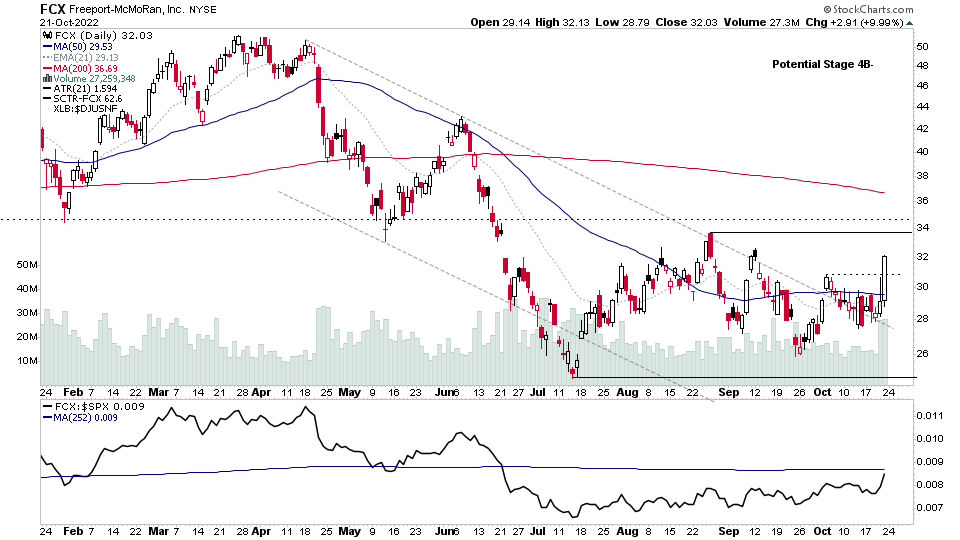
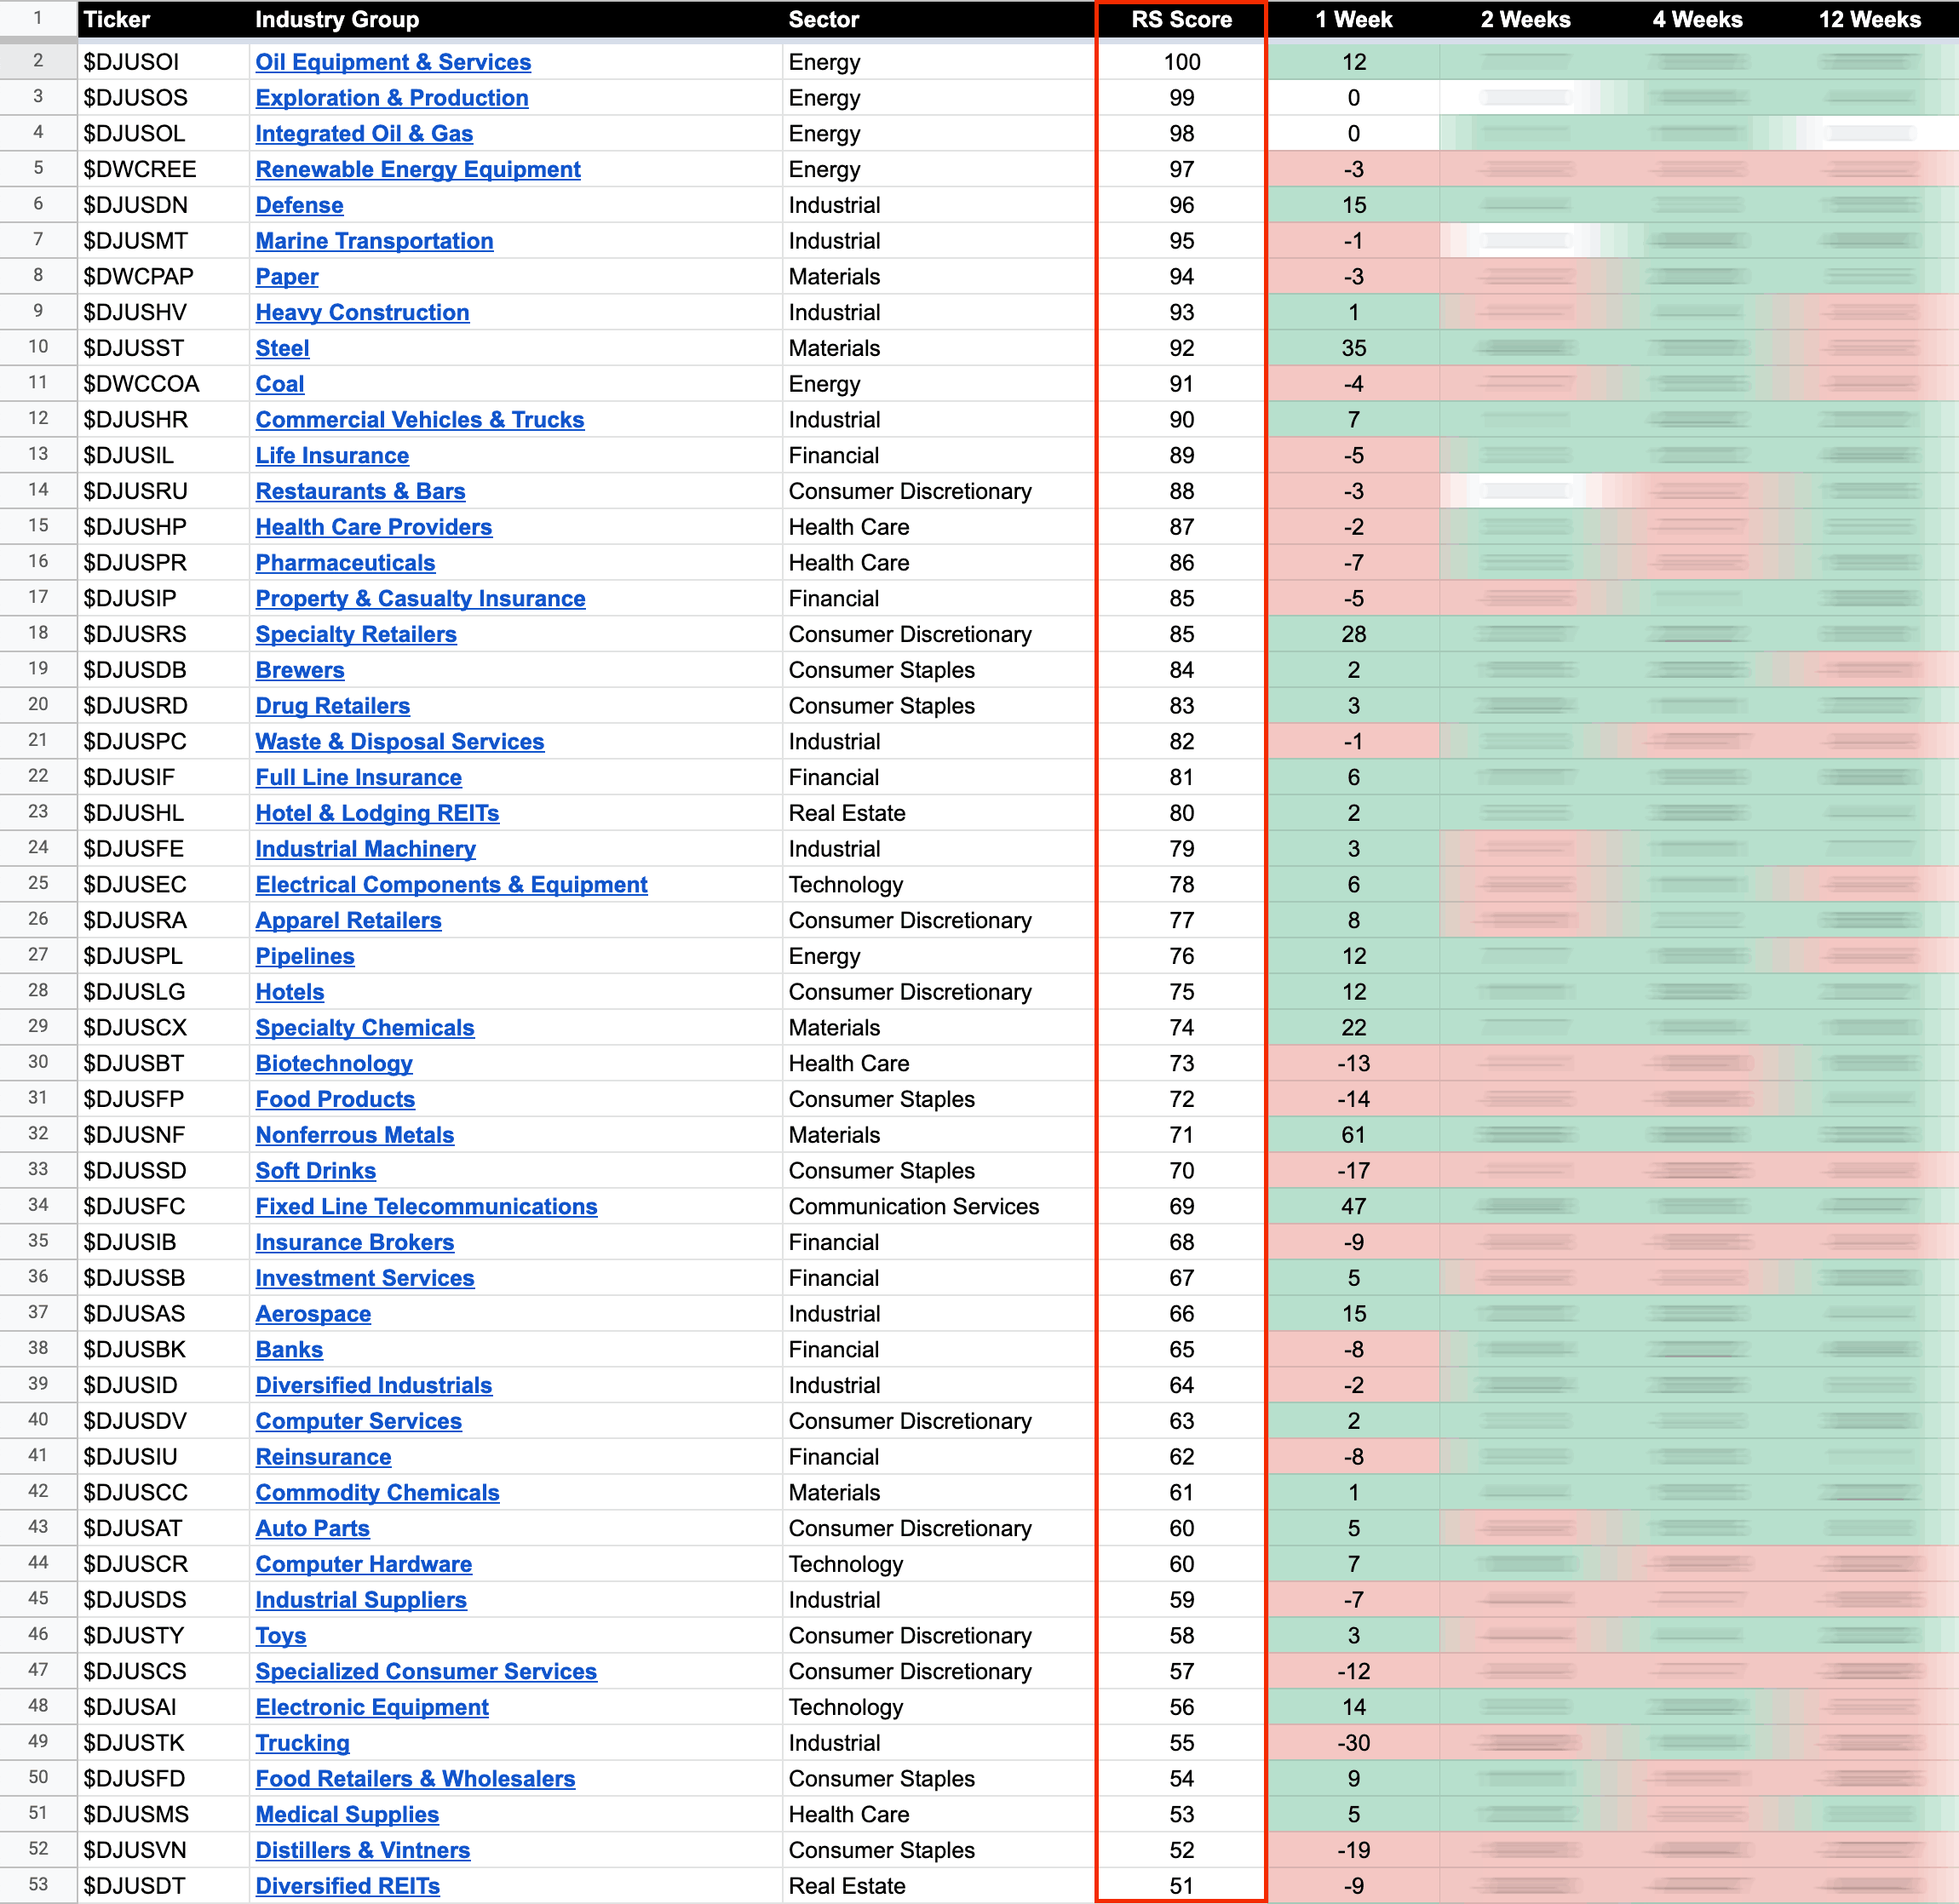
I noted the relative strength in the Nonferrous Metals and Steel groups in the RS rankings blog post on Friday, which have also featured strongly in the watchlist scans this weekend, as well as a number of other areas such as Gold Mining (Gold and Silver stocks) and the strength in some of the Technology groups as money rotated from more defensive groups/sectors into the more speculative areas on Friday...
Read More
22 October, 2022
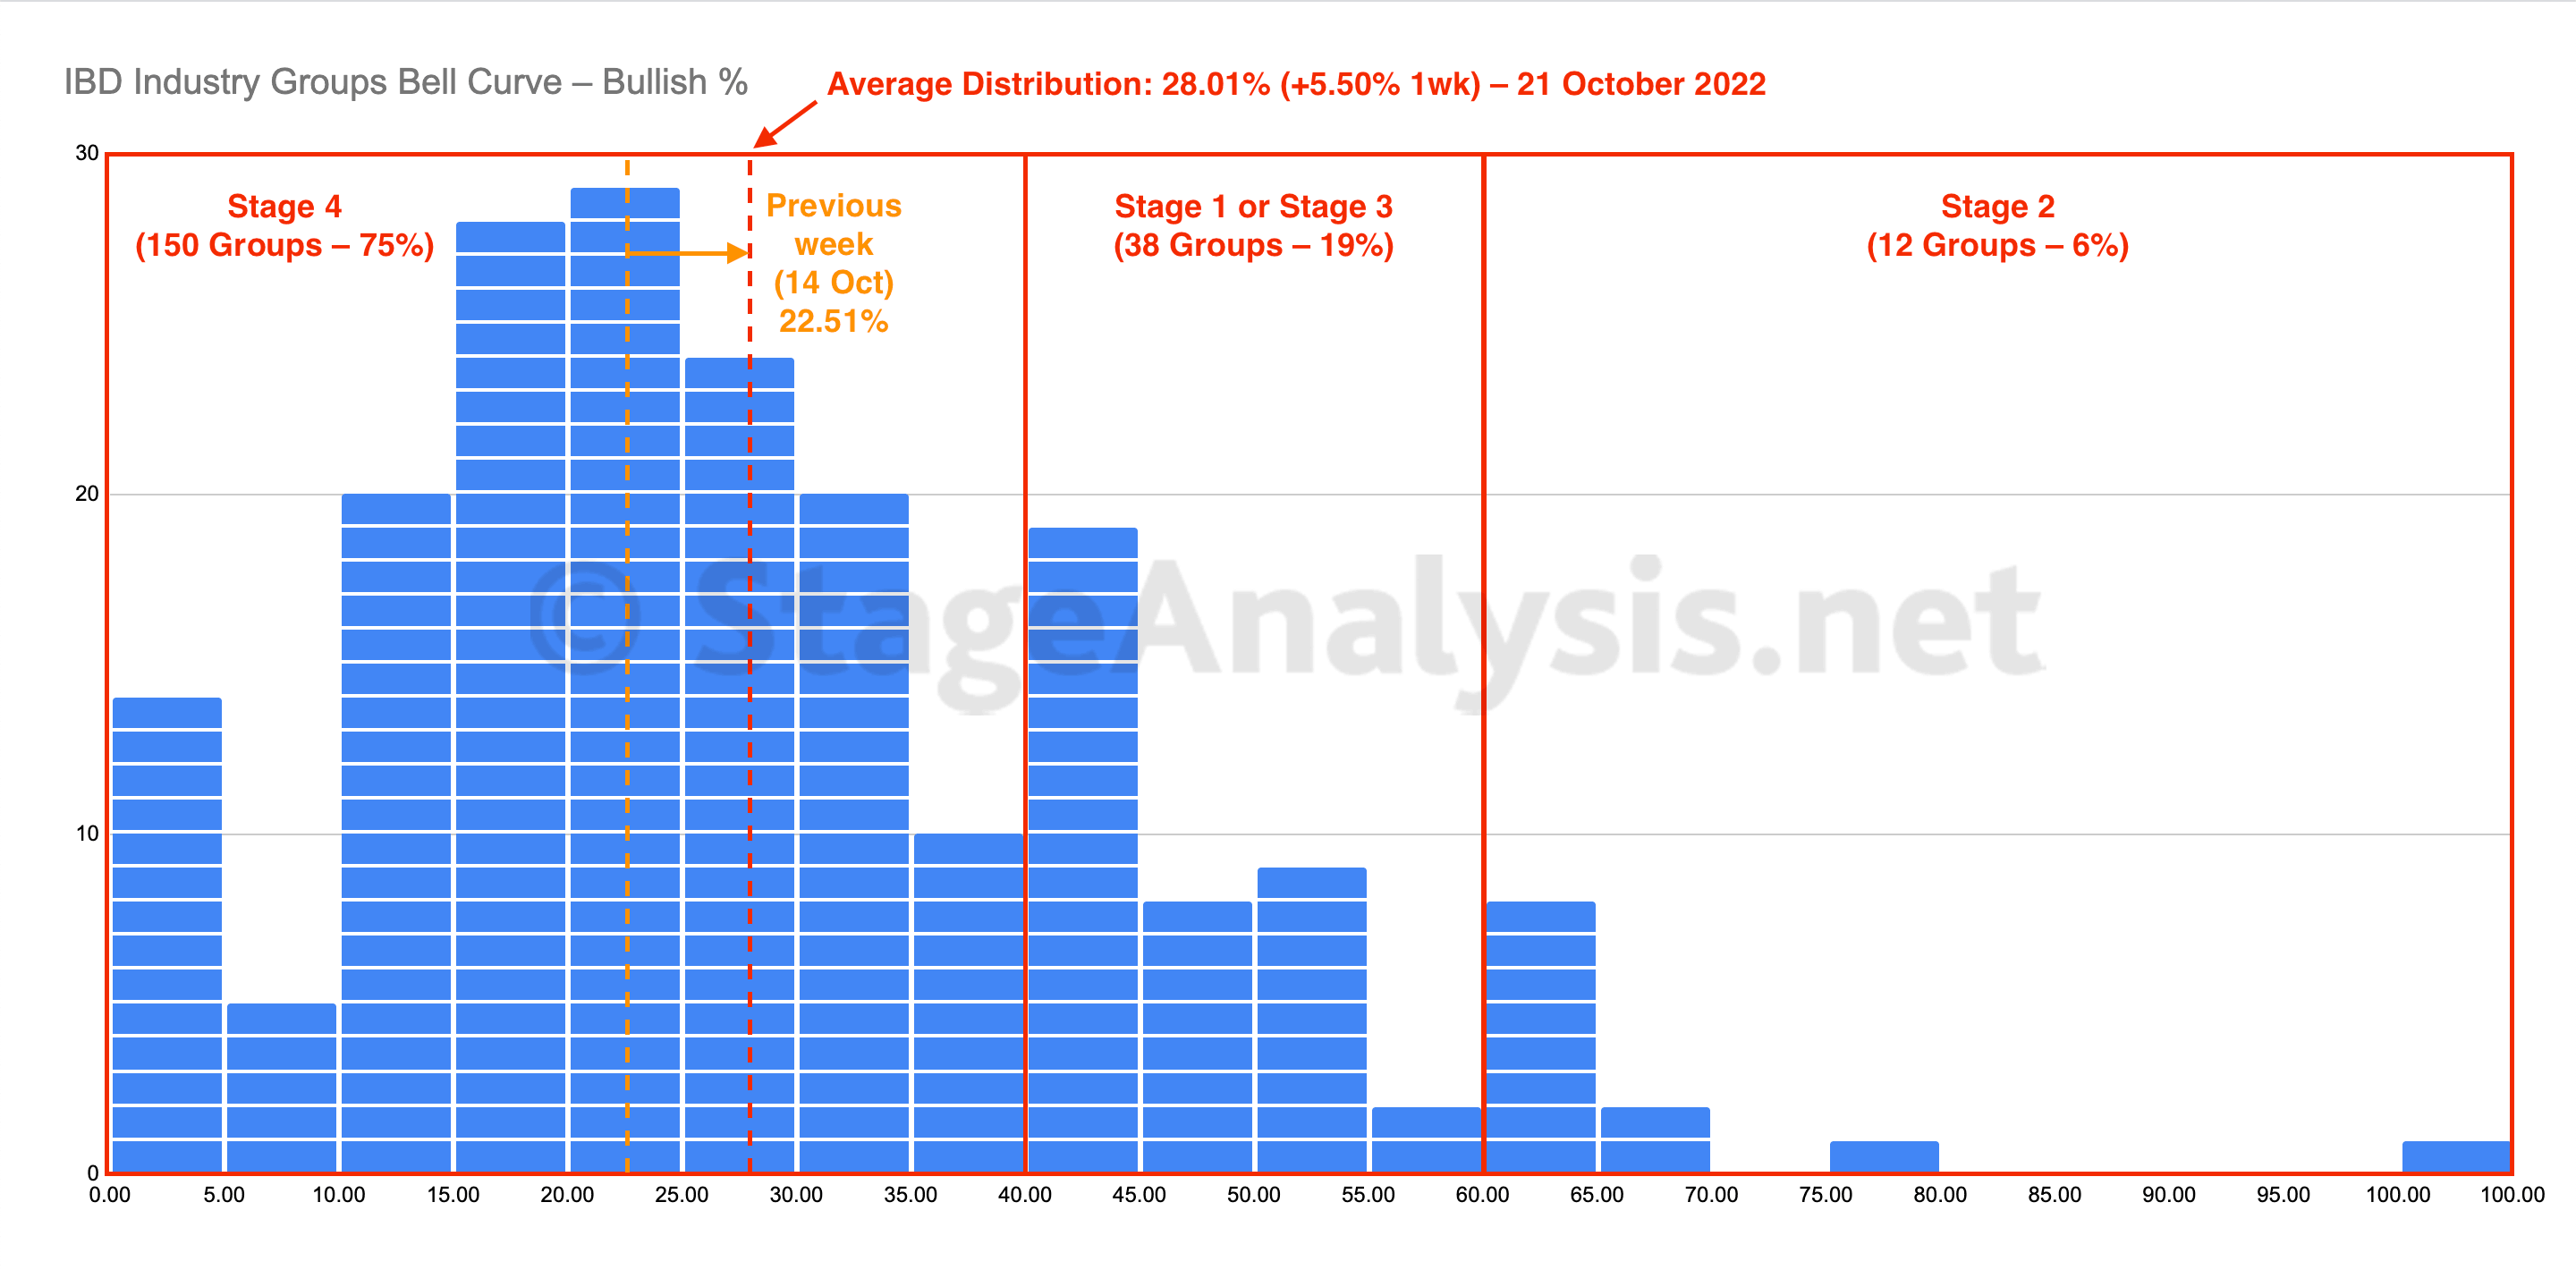
IBD Industry Groups Bell Curve – Bullish Percent
The IBD Industry Groups Bell Curve – Bullish Percent improved over the last week with 24 groups (-12%) less in the Stage 4 zone, and 14 groups (+7%) more groups in the neutral Stage 1 / Stage 3 zone and 10 groups (+5%) more moving into the Stage 2 zone...
Read More
22 October, 2022
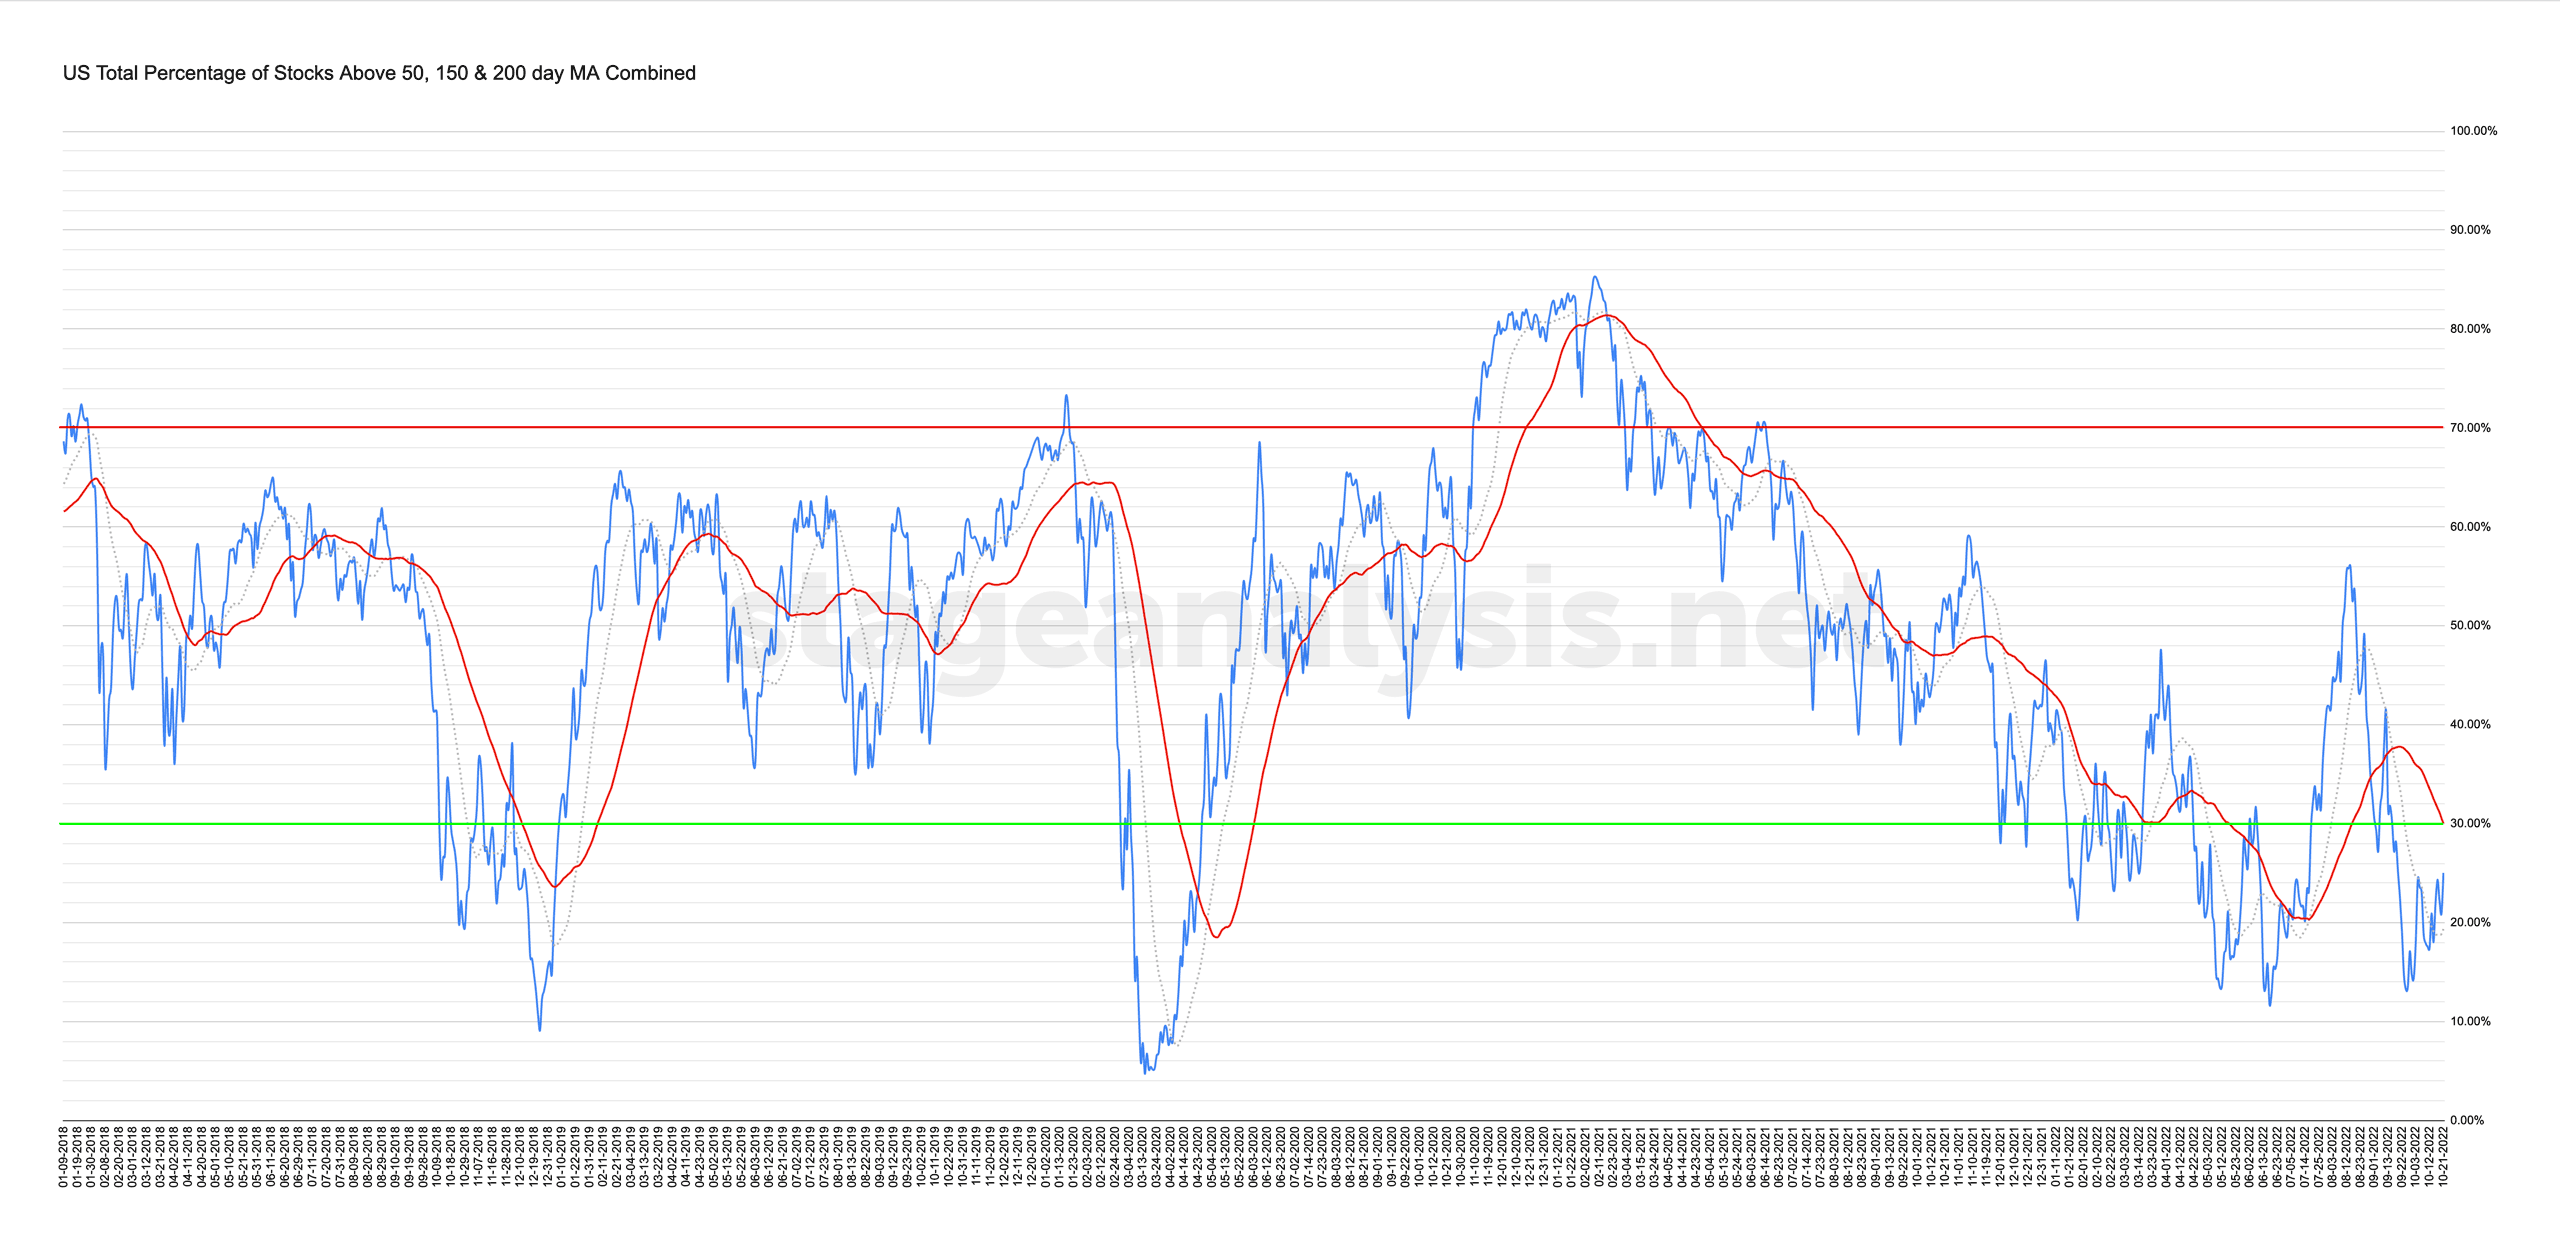
Market Breadth: Percentage of Stocks Above their 50 Day, 150 Day & 200 Day Moving Averages Combined
Custom Percentage of Stocks Above Their 50 Day, 150 Day & 200 Day Moving Averages Combined Market Breadth Charts for the Overall US Market, NYSE and Nasdaq for Market Timing and Strategy.
Read More
21 October, 2022
US Stocks Industry Groups Relative Strength Rankings
The purpose of the Relative Strength (RS) tables is to track the short, medium and long term RS changes of the individual groups to find the new leadership earlier than the crowd...
Read More
20 October, 2022
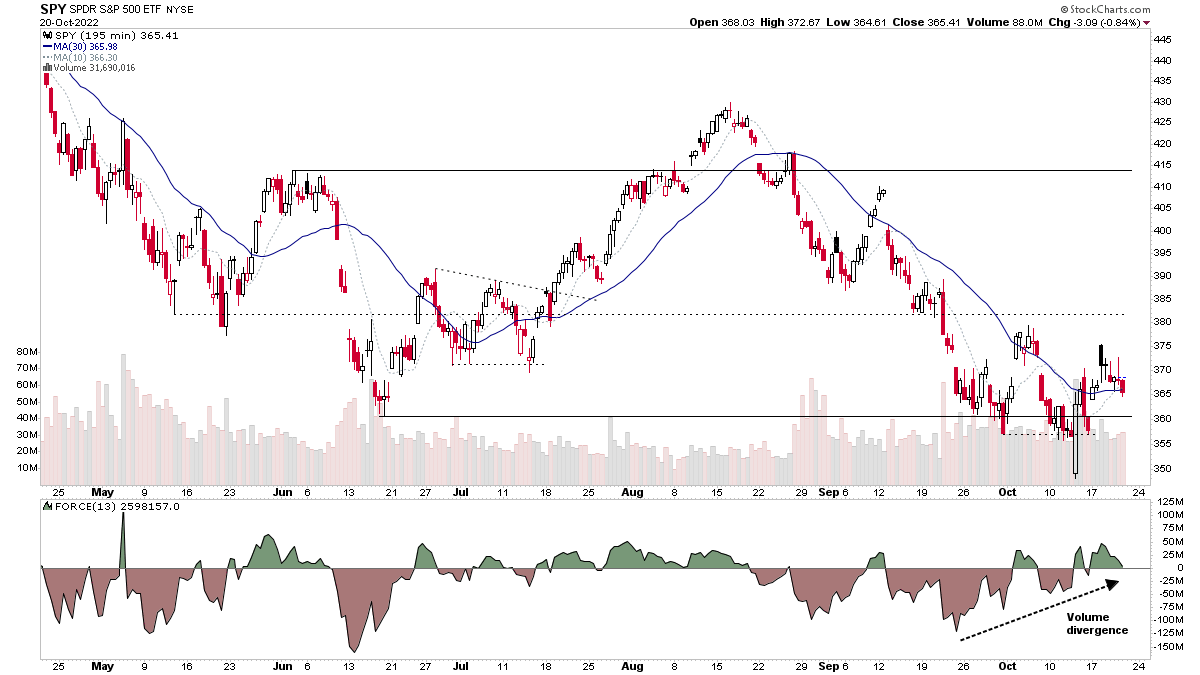
Stock Market Update and the US Stocks Watchlist – 20 October 2022
The S&P 500 and other major stock market indexes pulled back for another day, but remains above the swing low that formed a week ago on heavy volume on the 13th October...
Read More
19 October, 2022
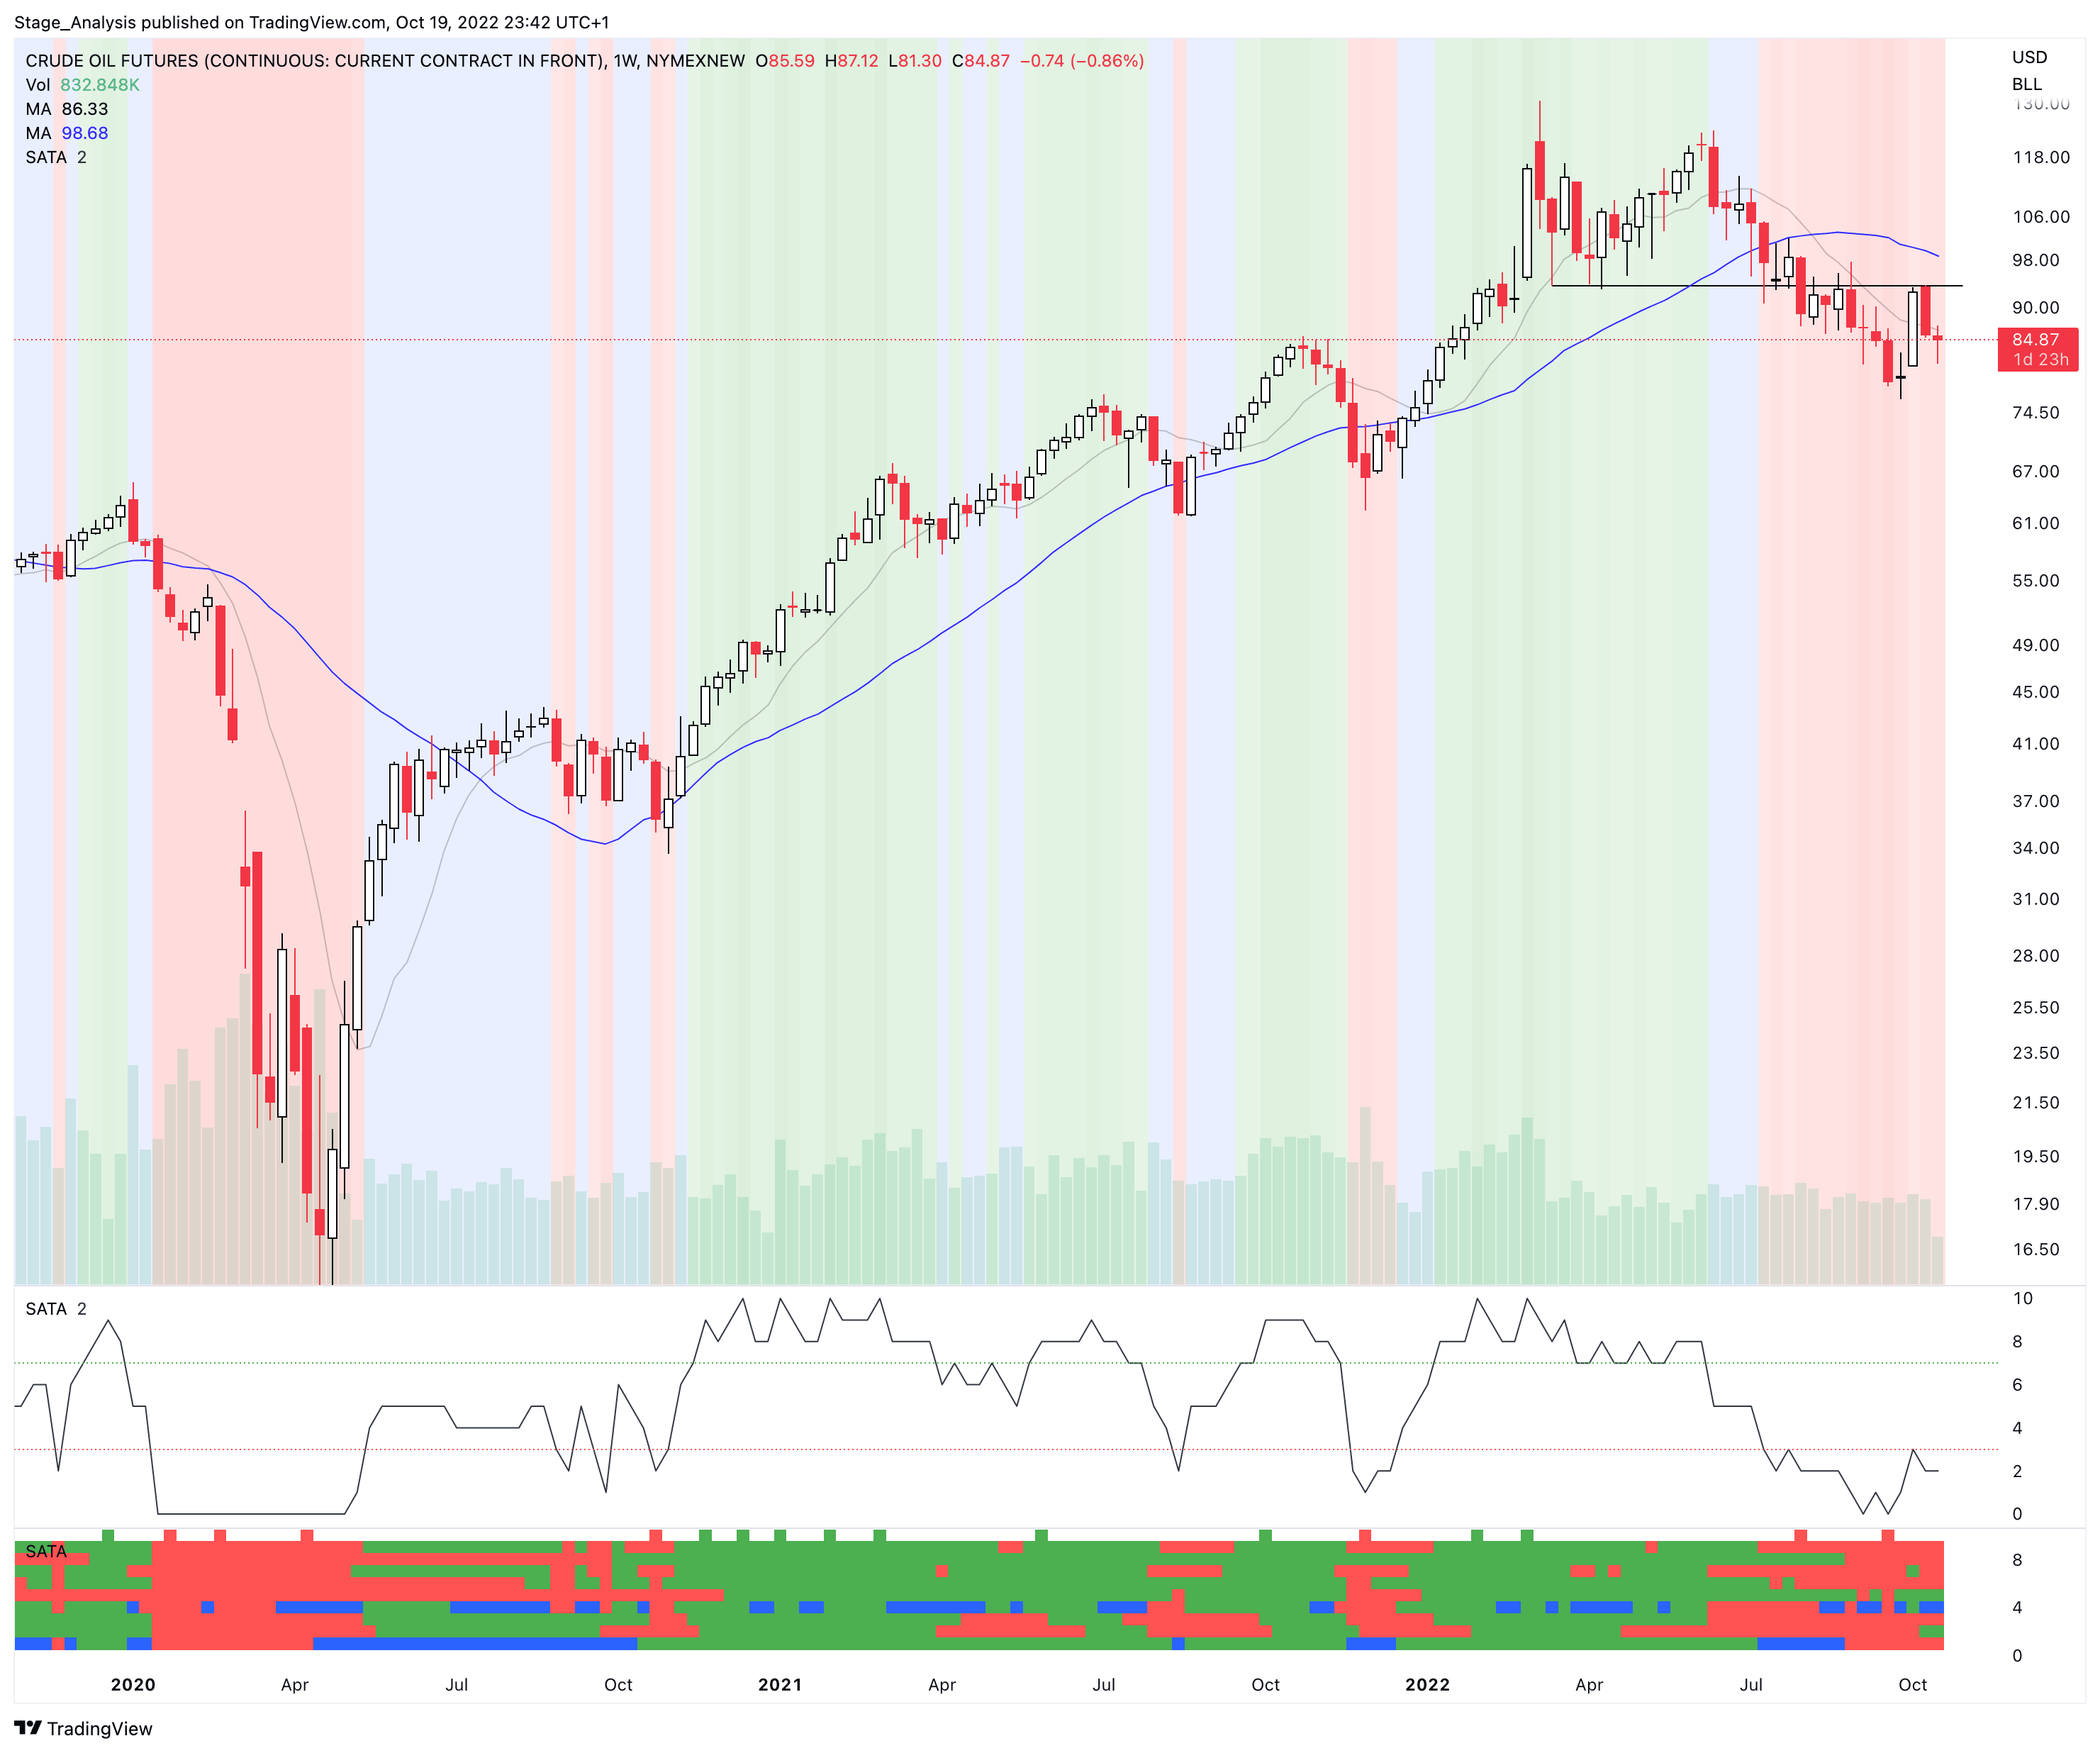
Stage Analysis Members Midweek Video – 19 October 2022 (54 mins)
The members midweek video, this week discussing the divergence in Crude Oil Futures and the breakout attempts in the Oil stocks. Then a look at the market indexes, short-term market breadth and Stage Analysis of some of the weeks key earnings results so far...
Read More
18 October, 2022
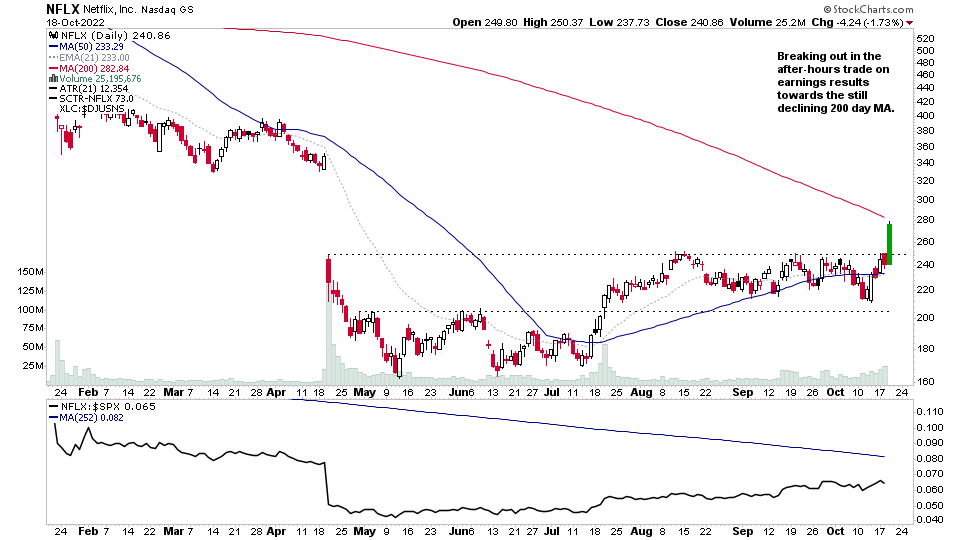
Earnings Movers and the US Stocks Watchlist – 18 October 2022
NFLX (Netflix) from the Earnings Watchlist is the strongest mover of todays earnings results, breaking out of its six-month base structure in the after-hours trading and approaching the still declining 200 day MA...
Read More