
Stage Analysis Members Weekend Video – 14 August 2022 (1hr 32mins)
14 August, 2022The full post is available to view by members only. For immediate access:
This weeks Stage Analysis Members weekend video begins with a detailed run through of the weekend watchlist stocks on multiple timeframes, with live markups of the charts and explanations of what we are looking for in each. Plus a look at a few Stage 2 breakout attempts from the week.
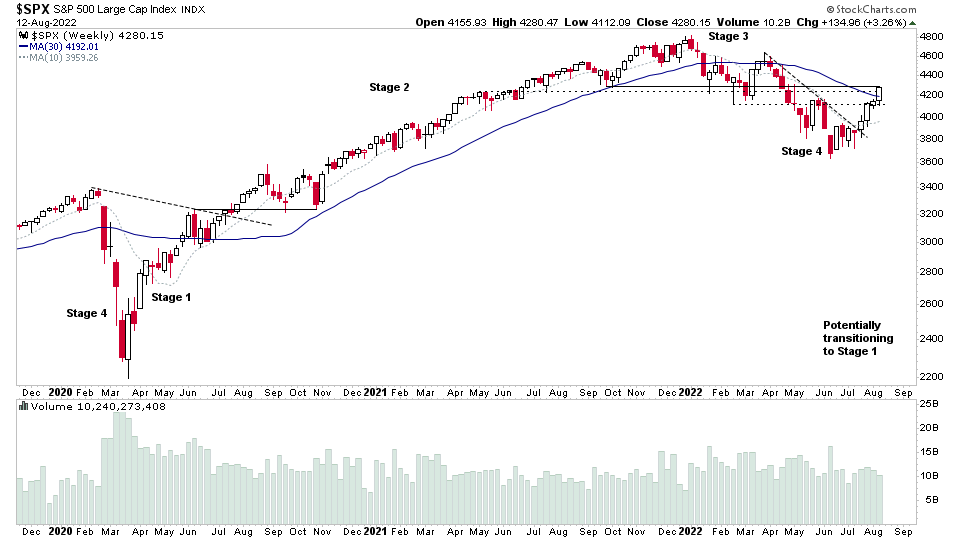
Then a look at the Major Indexes i.e the S&P 500, Nasdaq Composite, Russell 2000 and more, which are potentially transitioning into Stage 1. Followed by the Industry Group Relative Strength Rankings, which are an essential part of the Stage Analysis process, as strong group themes with volume are key in order to find outperformance.
The IBD Industry Groups Bullish Percent has moved back through the mid-range and is firmly in Stage 1 territory. So I discuss the shifts over the last few months, and give a snapshot of the current market health.
Then to finish this weeks video, I discuss the Market Breadth charts in order to determine the Weight of Evidence. Which is weighting more to the positive side, with multiple breadth indicators now on positive statuses. But getting extended in the short-term.
Become a Stage Analysis Member:
To see more like this – US Stocks watchlist posts, detailed videos each weekend, use our unique Stage Analysis tools, such as the US Stocks & ETFs Screener, Charts, Market Breadth, Group Relative Strength and more...
Join Today
Disclaimer: For educational purpose only. Not investment advice. Seek professional advice from a financial advisor before making any investing decisions.