
Market Breadth: Percentage of Stocks Above their 50 Day, 150 Day & 200 Day Moving Averages Combined
The full post is available to view by members only. For immediate access:
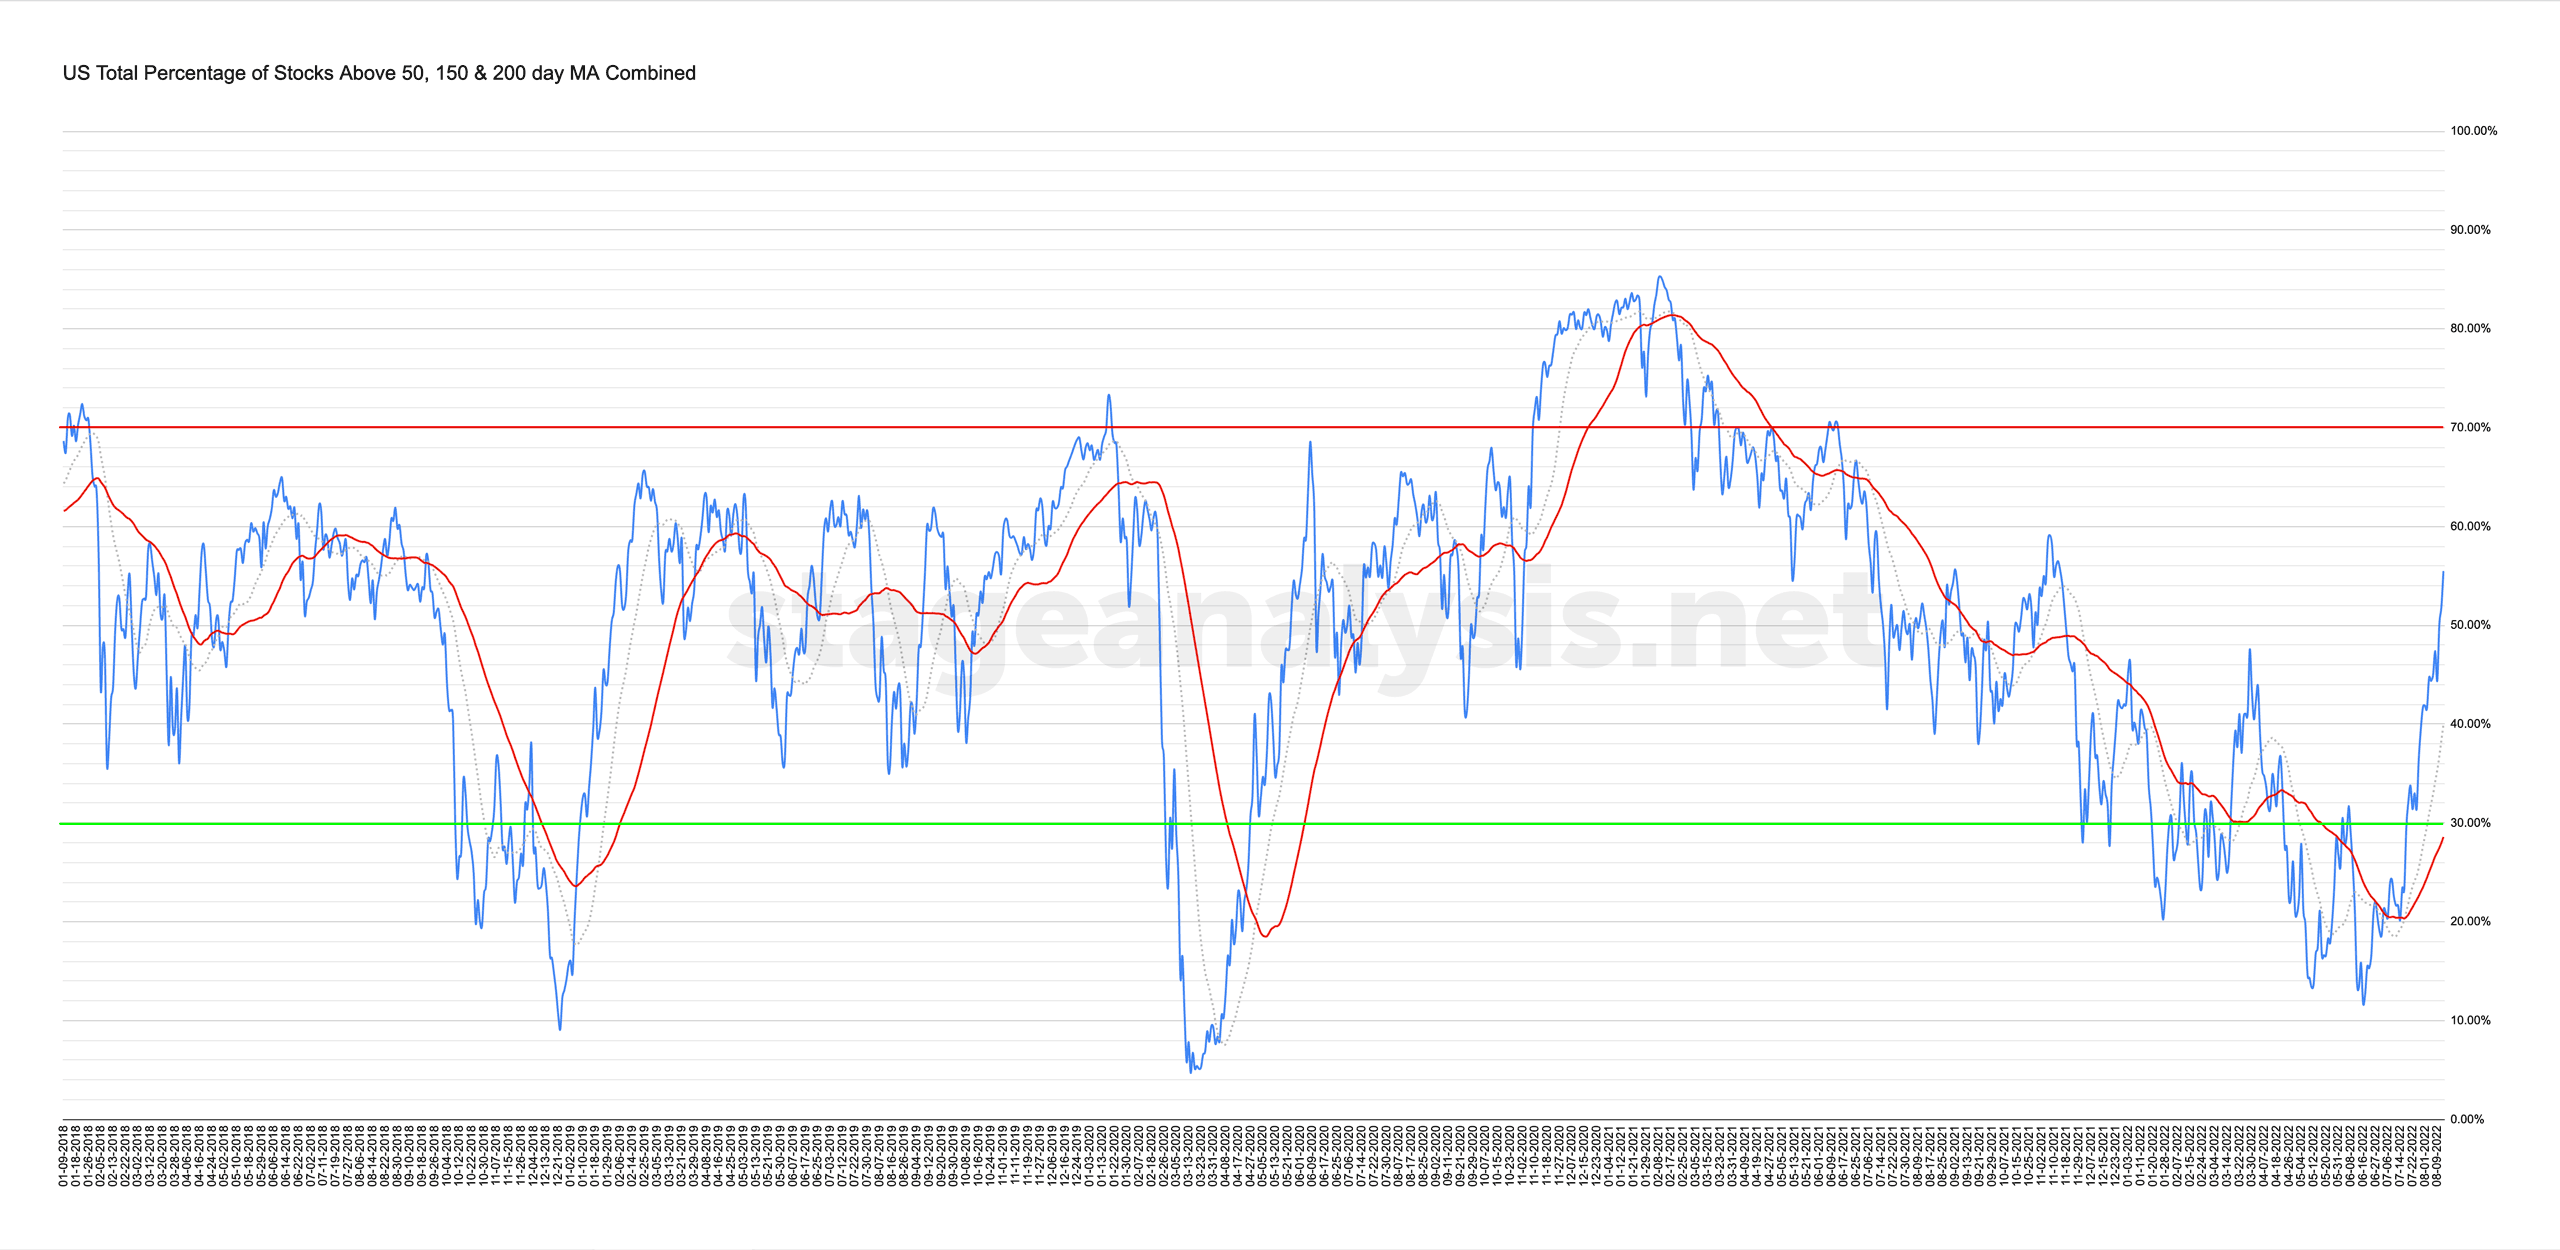
55.50% (+10.48% 1wk)
Status: Positive Environment in the Stage 1 zone
The US Total Percentage of Stocks Above their 50 Day, 150 Day & 200 Day Moving Averages expanded further from its own 50 day MA to close the week at 55.50%, with a gain of +10.48% for the week. So it is now in the upper mid range of the chart, which is the Stage 1 zone, when moving up from the lower zone, and so remains on Positive Environment status currently.
I talked in last weeks post about the need for the overall average to push further from its own 50 day MA in order to match the kind of strength that what we saw at the start of the prior two transitions towards Stage 1 behaviour in the market in January 2019 and April/May 2020, which we have seen some of this week with the overall average now at 26.91% above it's own 50 day MA. Which is a level its reached only during those two periods in the last 5 years.
But I will talk more about this and all of the other combined moving average breadth charts from the full members post in detail during the Stage Analysis Members weekend video – which is scheduled for later on Sunday afternoon EST.
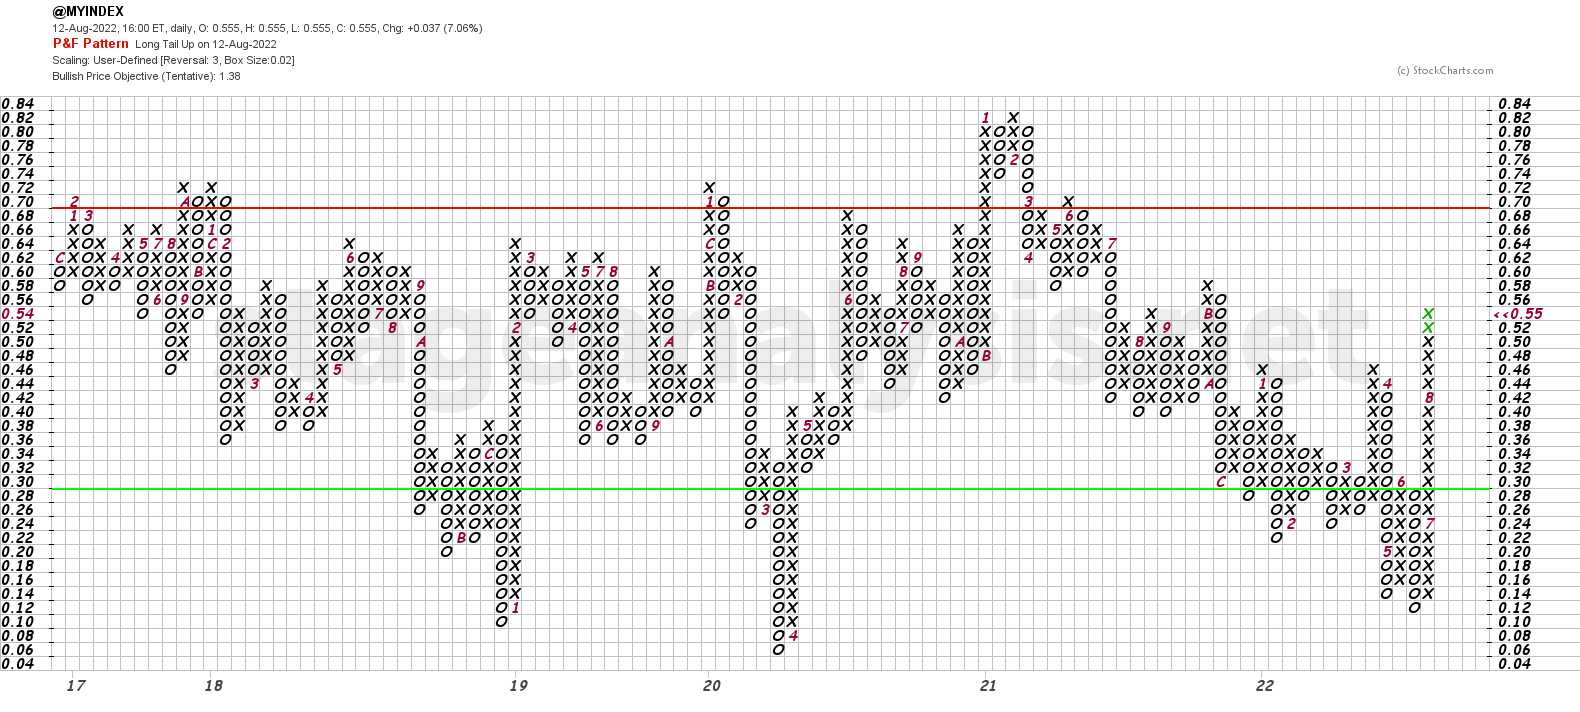
The Point & Figure chart (shown above) added 5 further Xs to its current column, and so remains on P&F Bull Confirmed status, and managed to overcome the January and March breadth highs, and so it is now at its highest level since November.
Become a Stage Analysis Member:
To see more like this – US Stocks watchlist posts, detailed videos each weekend, use our unique Stage Analysis tools, such as the US Stocks & ETFs Screener, Charts, Market Breadth, Group Relative Strength and more...
Join Today
Disclaimer: For educational purpose only. Not investment advice. Seek professional advice from a financial advisor before making any investing decisions.