
Stage Analysis Members Midweek Video – 11 May 2022 (1hr 14mins)
12 May, 2022This weeks Stage Analysis Members Midweek Video features analysis of the major indexes Stage 4 declines and the VIX. Plus a detailed look at the mega caps stocks with AAPL (Apple) attempting to breakdown in Stage 4 today and join the other large cap stocks already in Stage 4.
Then in the members only content I discuss the IBD Industry Group Bell Curve – Bullish % chart and the change over the last week, and how to use it. Plus the Market Breadth Update with a look at some long term charts of the moving average breadth, as well the bullish percent indexes and new highs - new lows cumulative charts for the US market, Nasdaq, NYSE, S&P 1500 and S&P 500. I then move onto the Earnings Reactions from this week that I was watching, and analysis of the energy groups to help to determine whether they've put in a short term high or not.
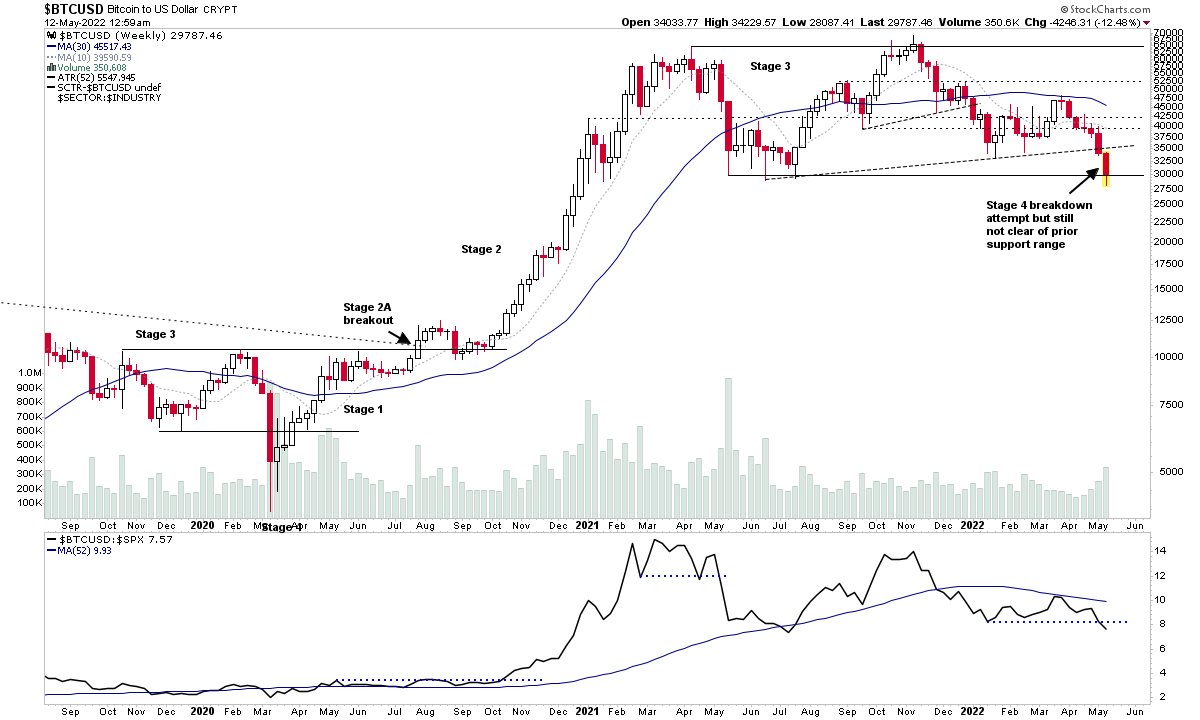
In the final part of the video I cover the Stage 4 breakdown attempts in Bitcoin and Ethereum and the liquidation type moves seen today in a large amount of the altcoins. And to finish I discuss the recent Upthrust After Distribution (UTAD) and Test type behaviour that has been seen in the Gold and Silver charts.
Become a Stage Analysis Member:
To see more like this – US Stocks watchlist posts, detailed videos each weekend, use our unique Stage Analysis tools, such as the US Stocks & ETFs Screener, Charts, Market Breadth, Group Relative Strength and more...
Join Today
Disclaimer: For educational purpose only. Not investment advice. Seek professional advice from a financial advisor before making any investing decisions.