
Stage Analysis Members Weekend Video - 24 April 2022 (1hr 30mins)
24 April, 2022The full post is available to view by members only. For immediate access:
This weekends Stage Analysis Members Video features analysis of the Major US Stock Market Indexes – S&P 500, Nasdaq Composite, Russell 2000 and the individual US Market Sectors Stages.
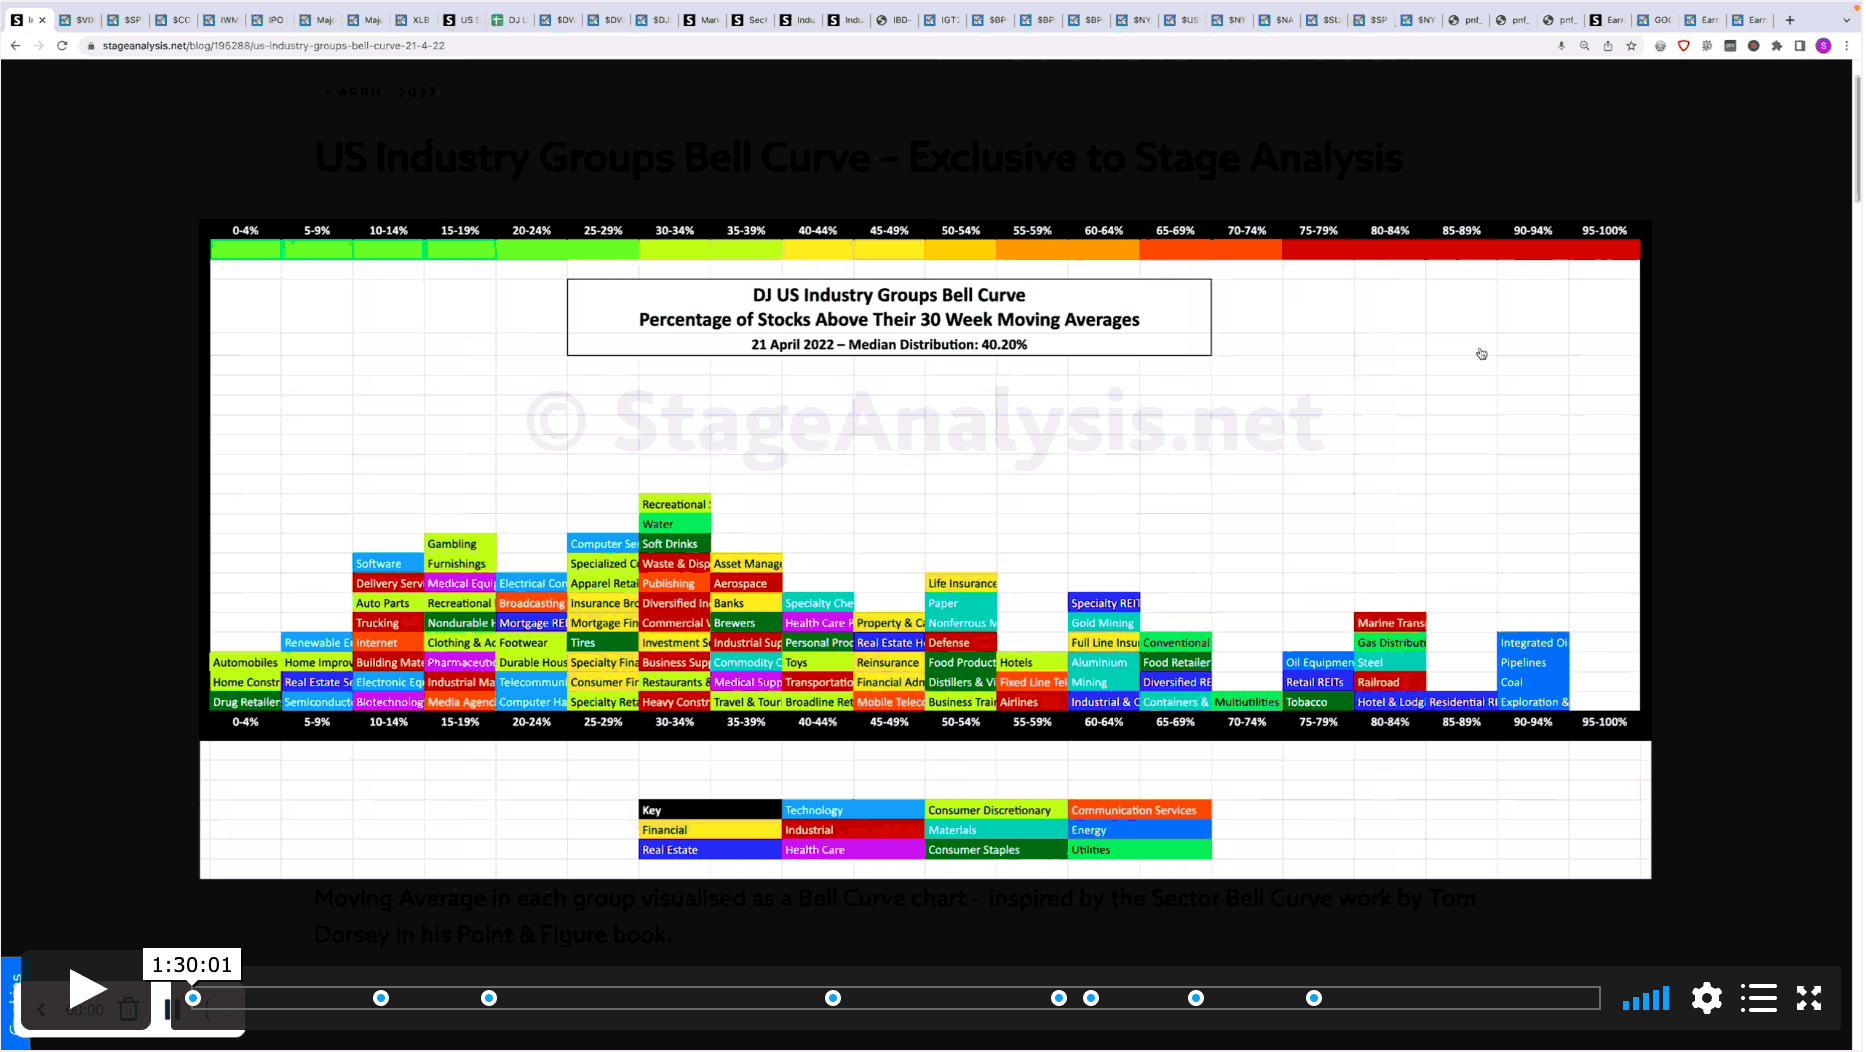
Plus the a detailed look at the US Industry Groups Relative Strength focusing on the Change of Behaviour in the strongest RS groups. The Moving Average Breadth charts in order to help to determine the Weight of Evidence – which a pivotal part of Stan Weinstein's Stage Analysis method. The custom Sector Breadth charts and the exclusive US Industry Group Bell Curve, with a review of the changing distribution and group positions since I last featured it on the 7th April. The rest of the market breadth charts – including the Advance Decline Line, New High New Lows and custom breadth charts.
And finally a look through this weeks pivotal Earnings Watchlist, with so many large/mega cap stocks reporting.
Become a Stage Analysis Member:
To see more like this – US Stocks watchlist posts, detailed videos each weekend, use our unique Stage Analysis tools, such as the US Stocks & ETFs Screener, Charts, Market Breadth, Group Relative Strength and more...
Join Today
Disclaimer: For educational purpose only. Not investment advice. Seek professional advice from a financial advisor before making any investing decisions.