The Stage Analysis members weekend video featuring the regular content with the major US Indexes, the futures charts, US Industry Groups RS Rankings, IBD Industry Groups Bell Curve - Bullish Percent, the Market Breadth Update to help to determine the Weight of Evidence and finishing with the US Stocks Watchlist in detail on multiple timeframes.
Read More

Blog
05 February, 2023
Stage Analysis Members Video – 5 February 2023 (1hr 31mins)
04 February, 2023
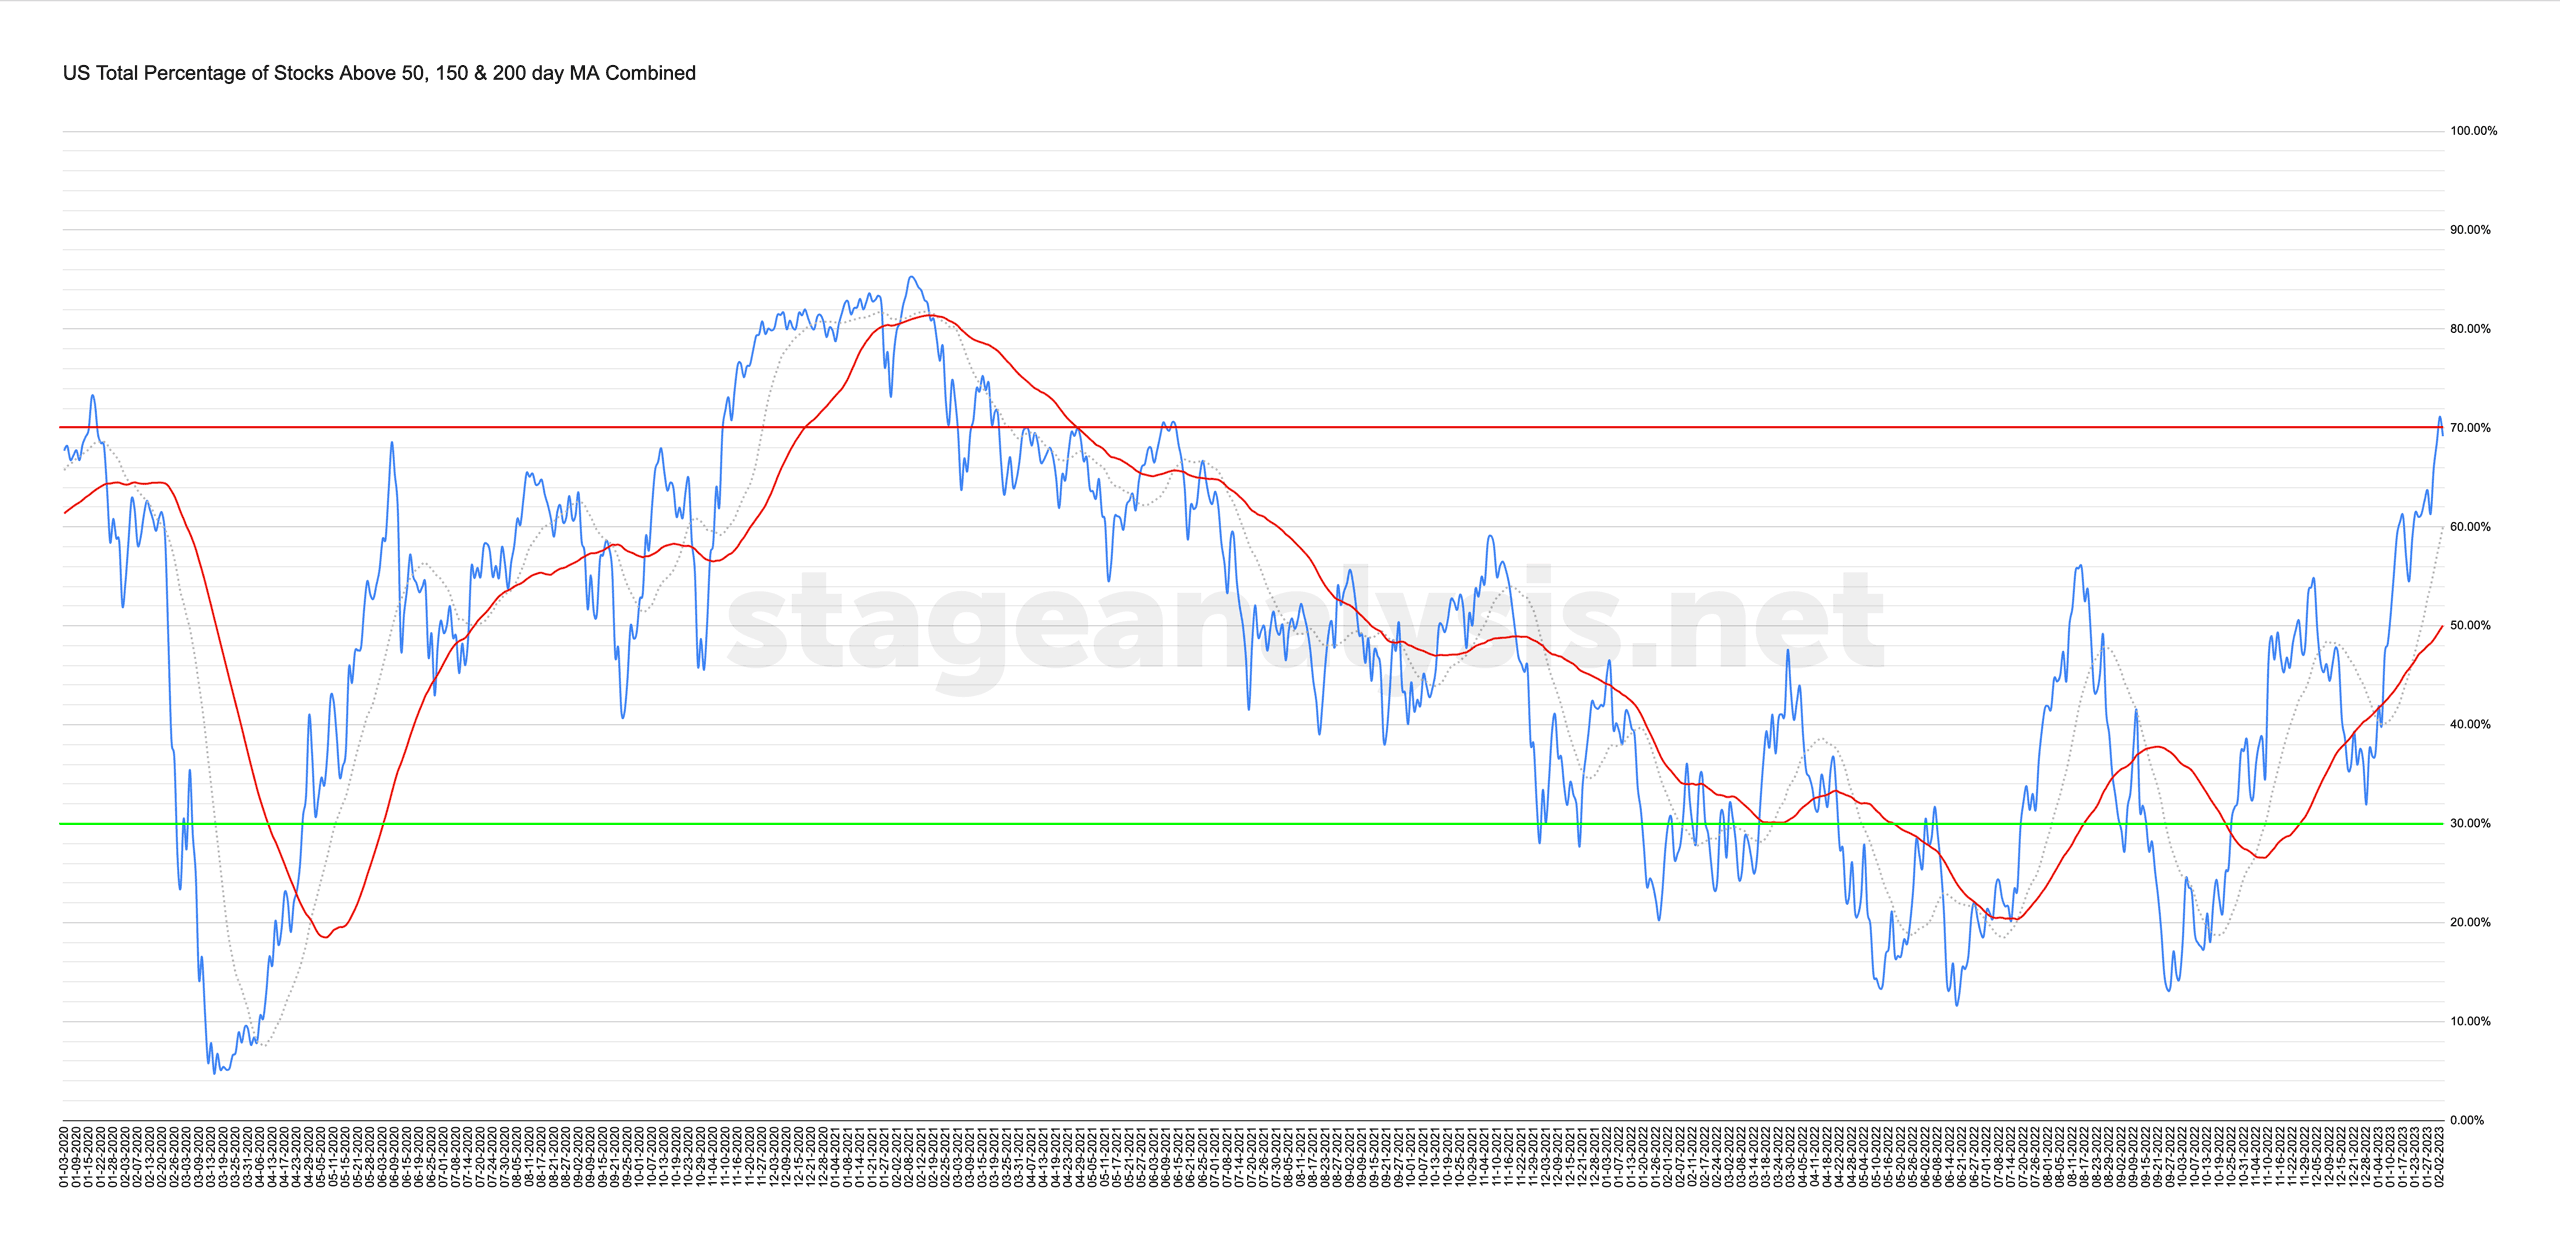
Market Breadth: Percentage of Stocks Above their 50 Day, 150 Day & 200 Day Moving Averages Combined
Custom Percentage of Stocks Above Their 50 Day, 150 Day & 200 Day Moving Averages Combined Market Breadth Charts for the Overall US Market, NYSE and Nasdaq for Market Timing and Strategy.
Read More
01 February, 2023
Stage Analysis Members Video – 1 February 2023 (35 mins)
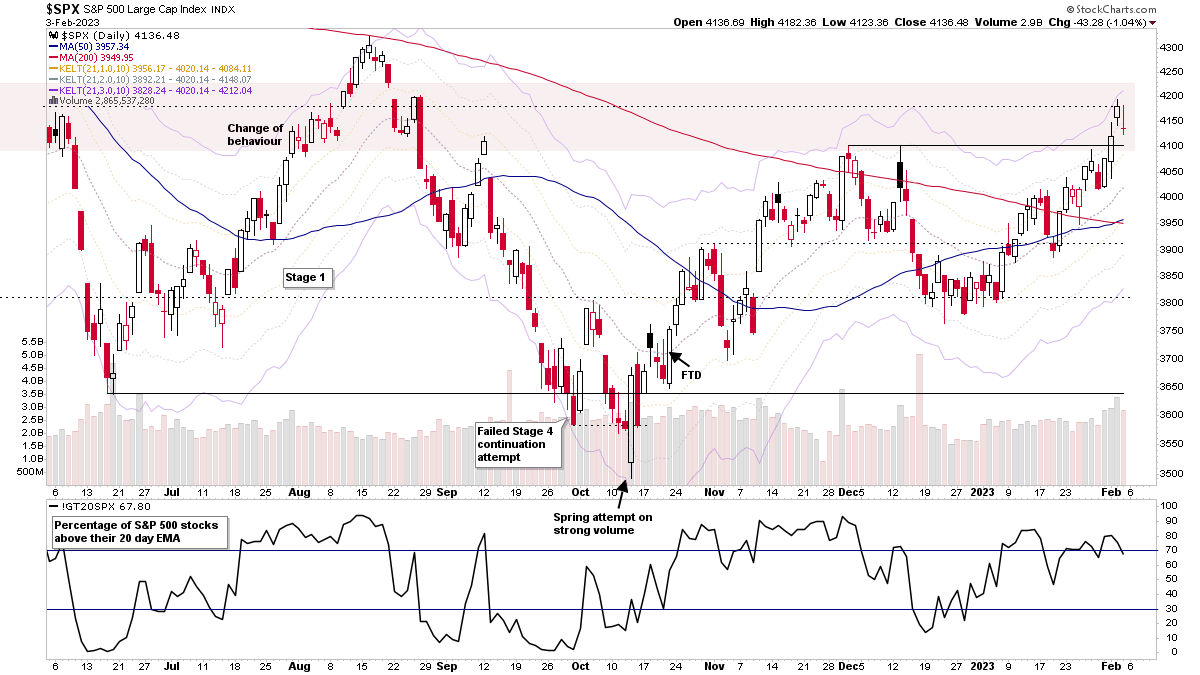
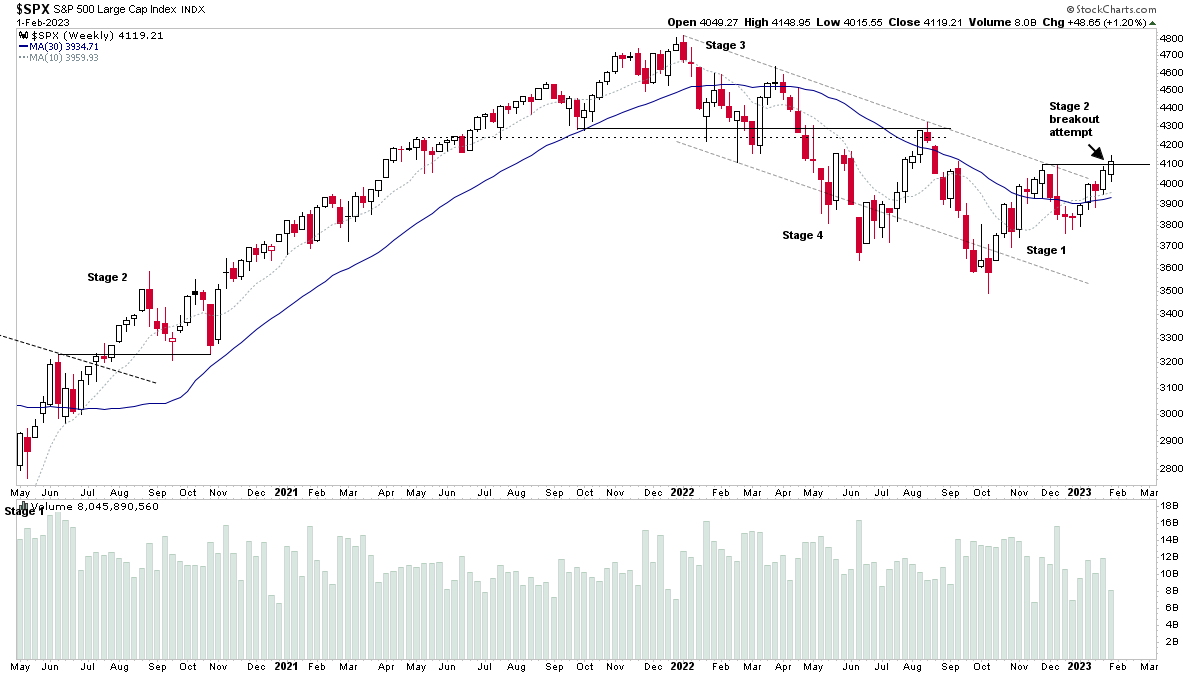
Stage Analysis Members midweek video discussing the Stage 2 breakout attempts in some of the major indexes, a look at the some of the key market breadth data, recent watchlist stocks and more on the small caps from yesterdays post.
Read More

23 January, 2023
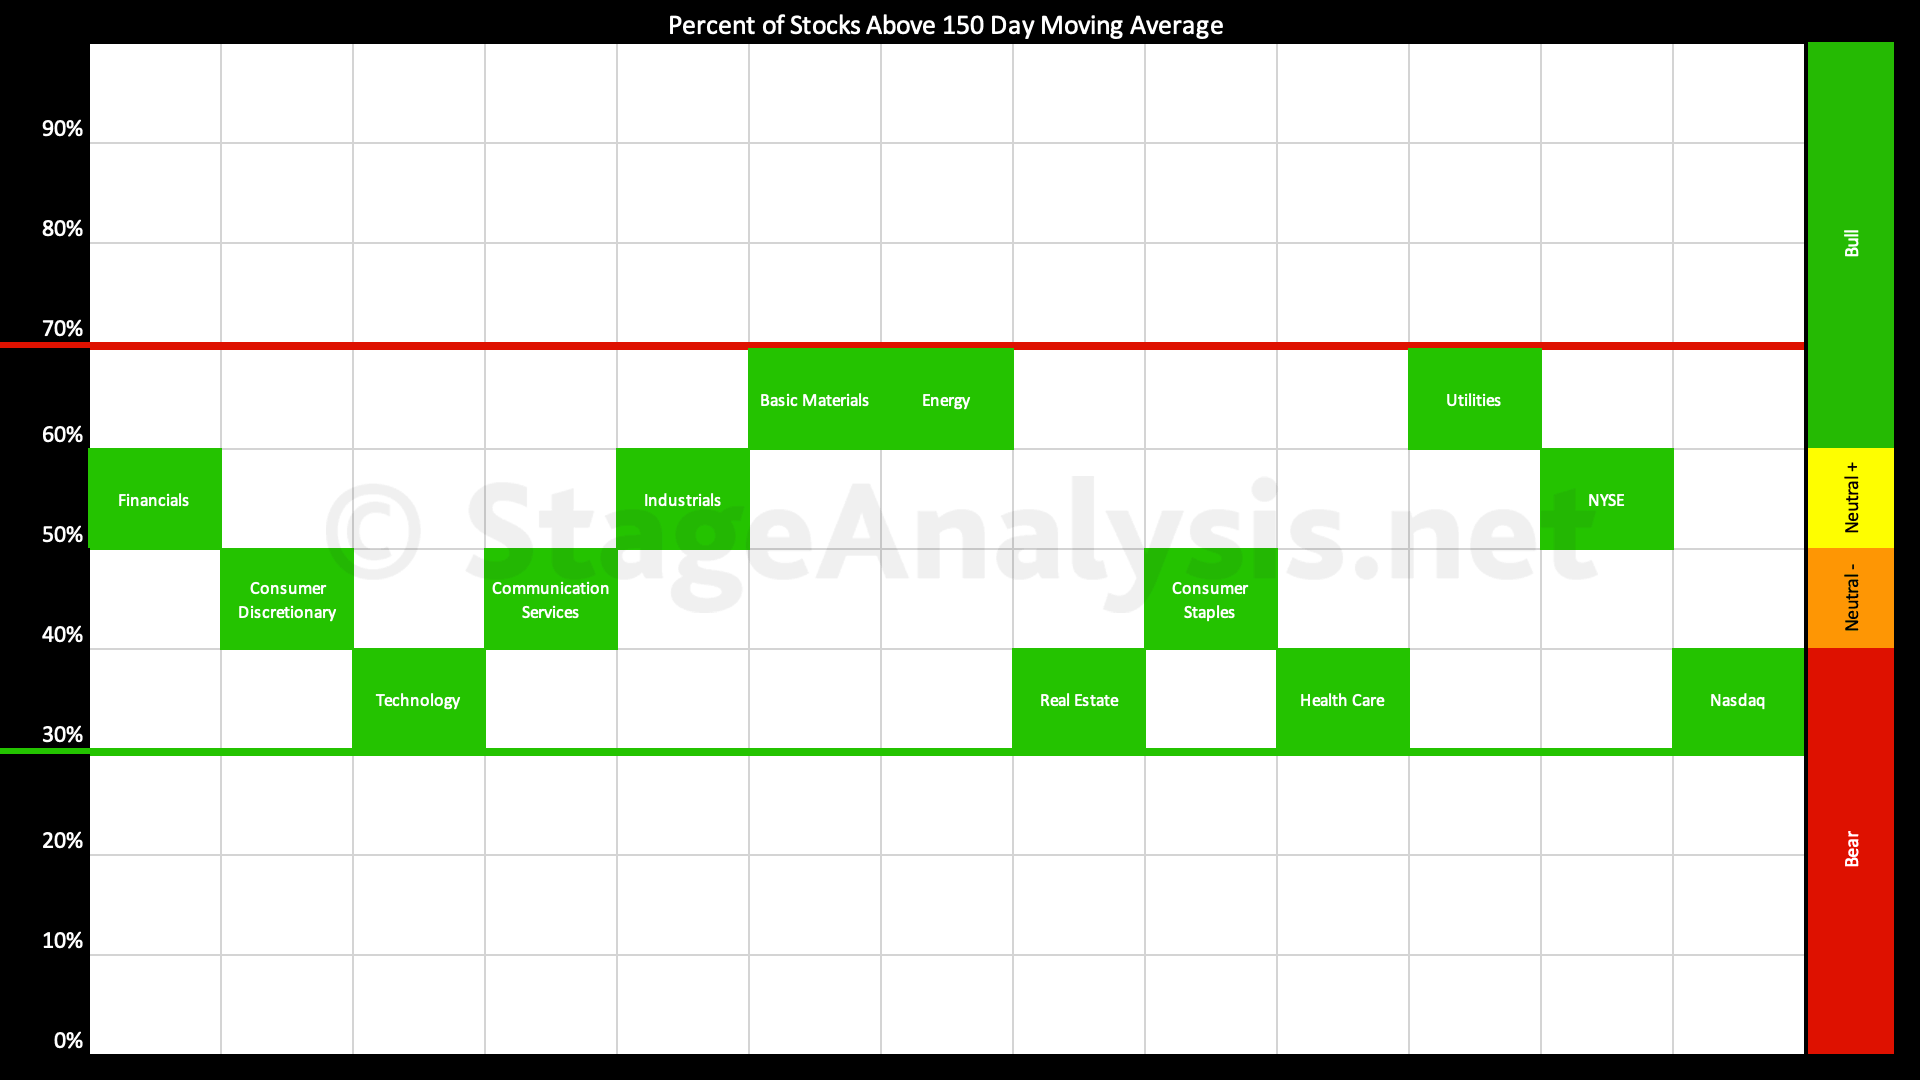
Sector Breadth: Percentage of US Stocks Above Their 150 day (30 Week) Moving Averages
The Percentage of US Stocks Above Their 150 day Moving Averages in the 11 major sectors has shown continued improvement over the last two weeks since the previous post of the 9th January 2023, increasing by a further +9.07% to 58.47% overall, which puts it at the top of the middle range (Neutral+), which is the Stage 1 zone.
Read More
22 January, 2023
Stage Analysis Members Video – 22 January 2023 (1hr 12mins)
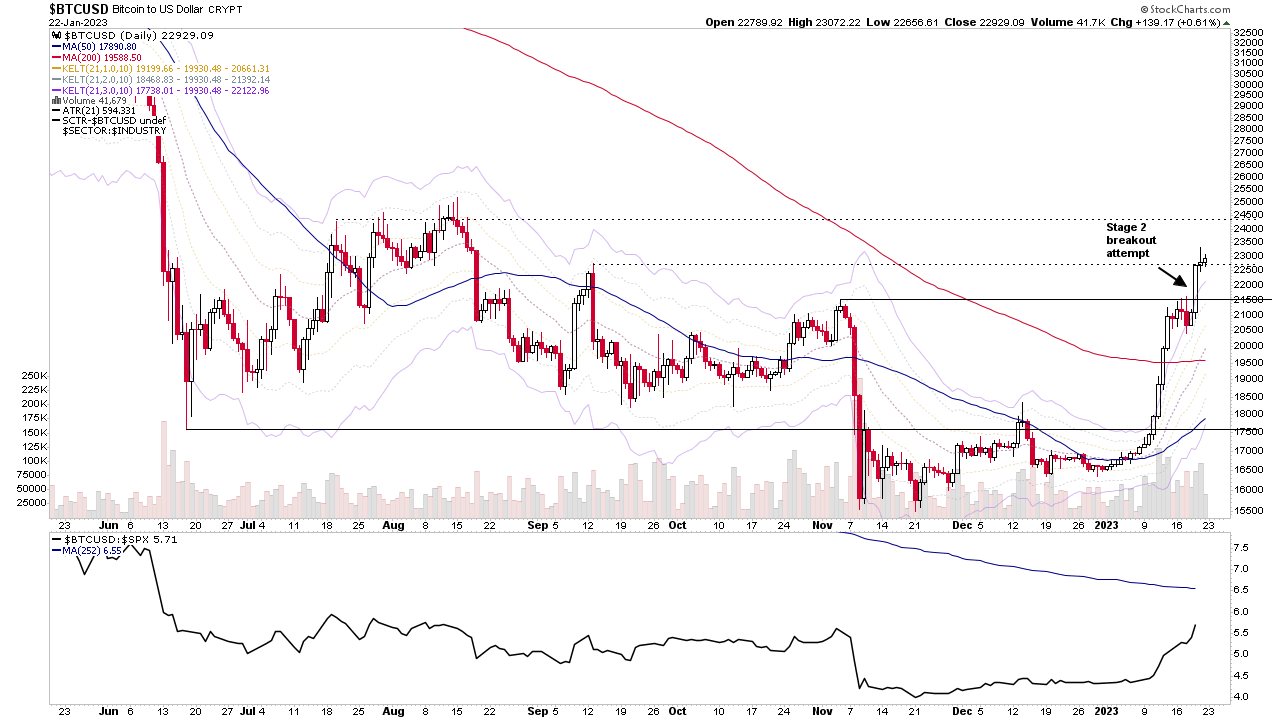
The Stage Analysis members weekend video featuring analysis of the early Stage breakout attempt in Bitcoin, and then the regular content with the major US Indexes, the futures charts, US Industry Groups RS Rankings, IBD Industry Groups Bell Curve - Bullish Percent, the Market Breadth Update to help to determine the Weight of Evidence and finishing with the US Stocks Watchlist in detail on multiple timeframes.
Read More
21 January, 2023
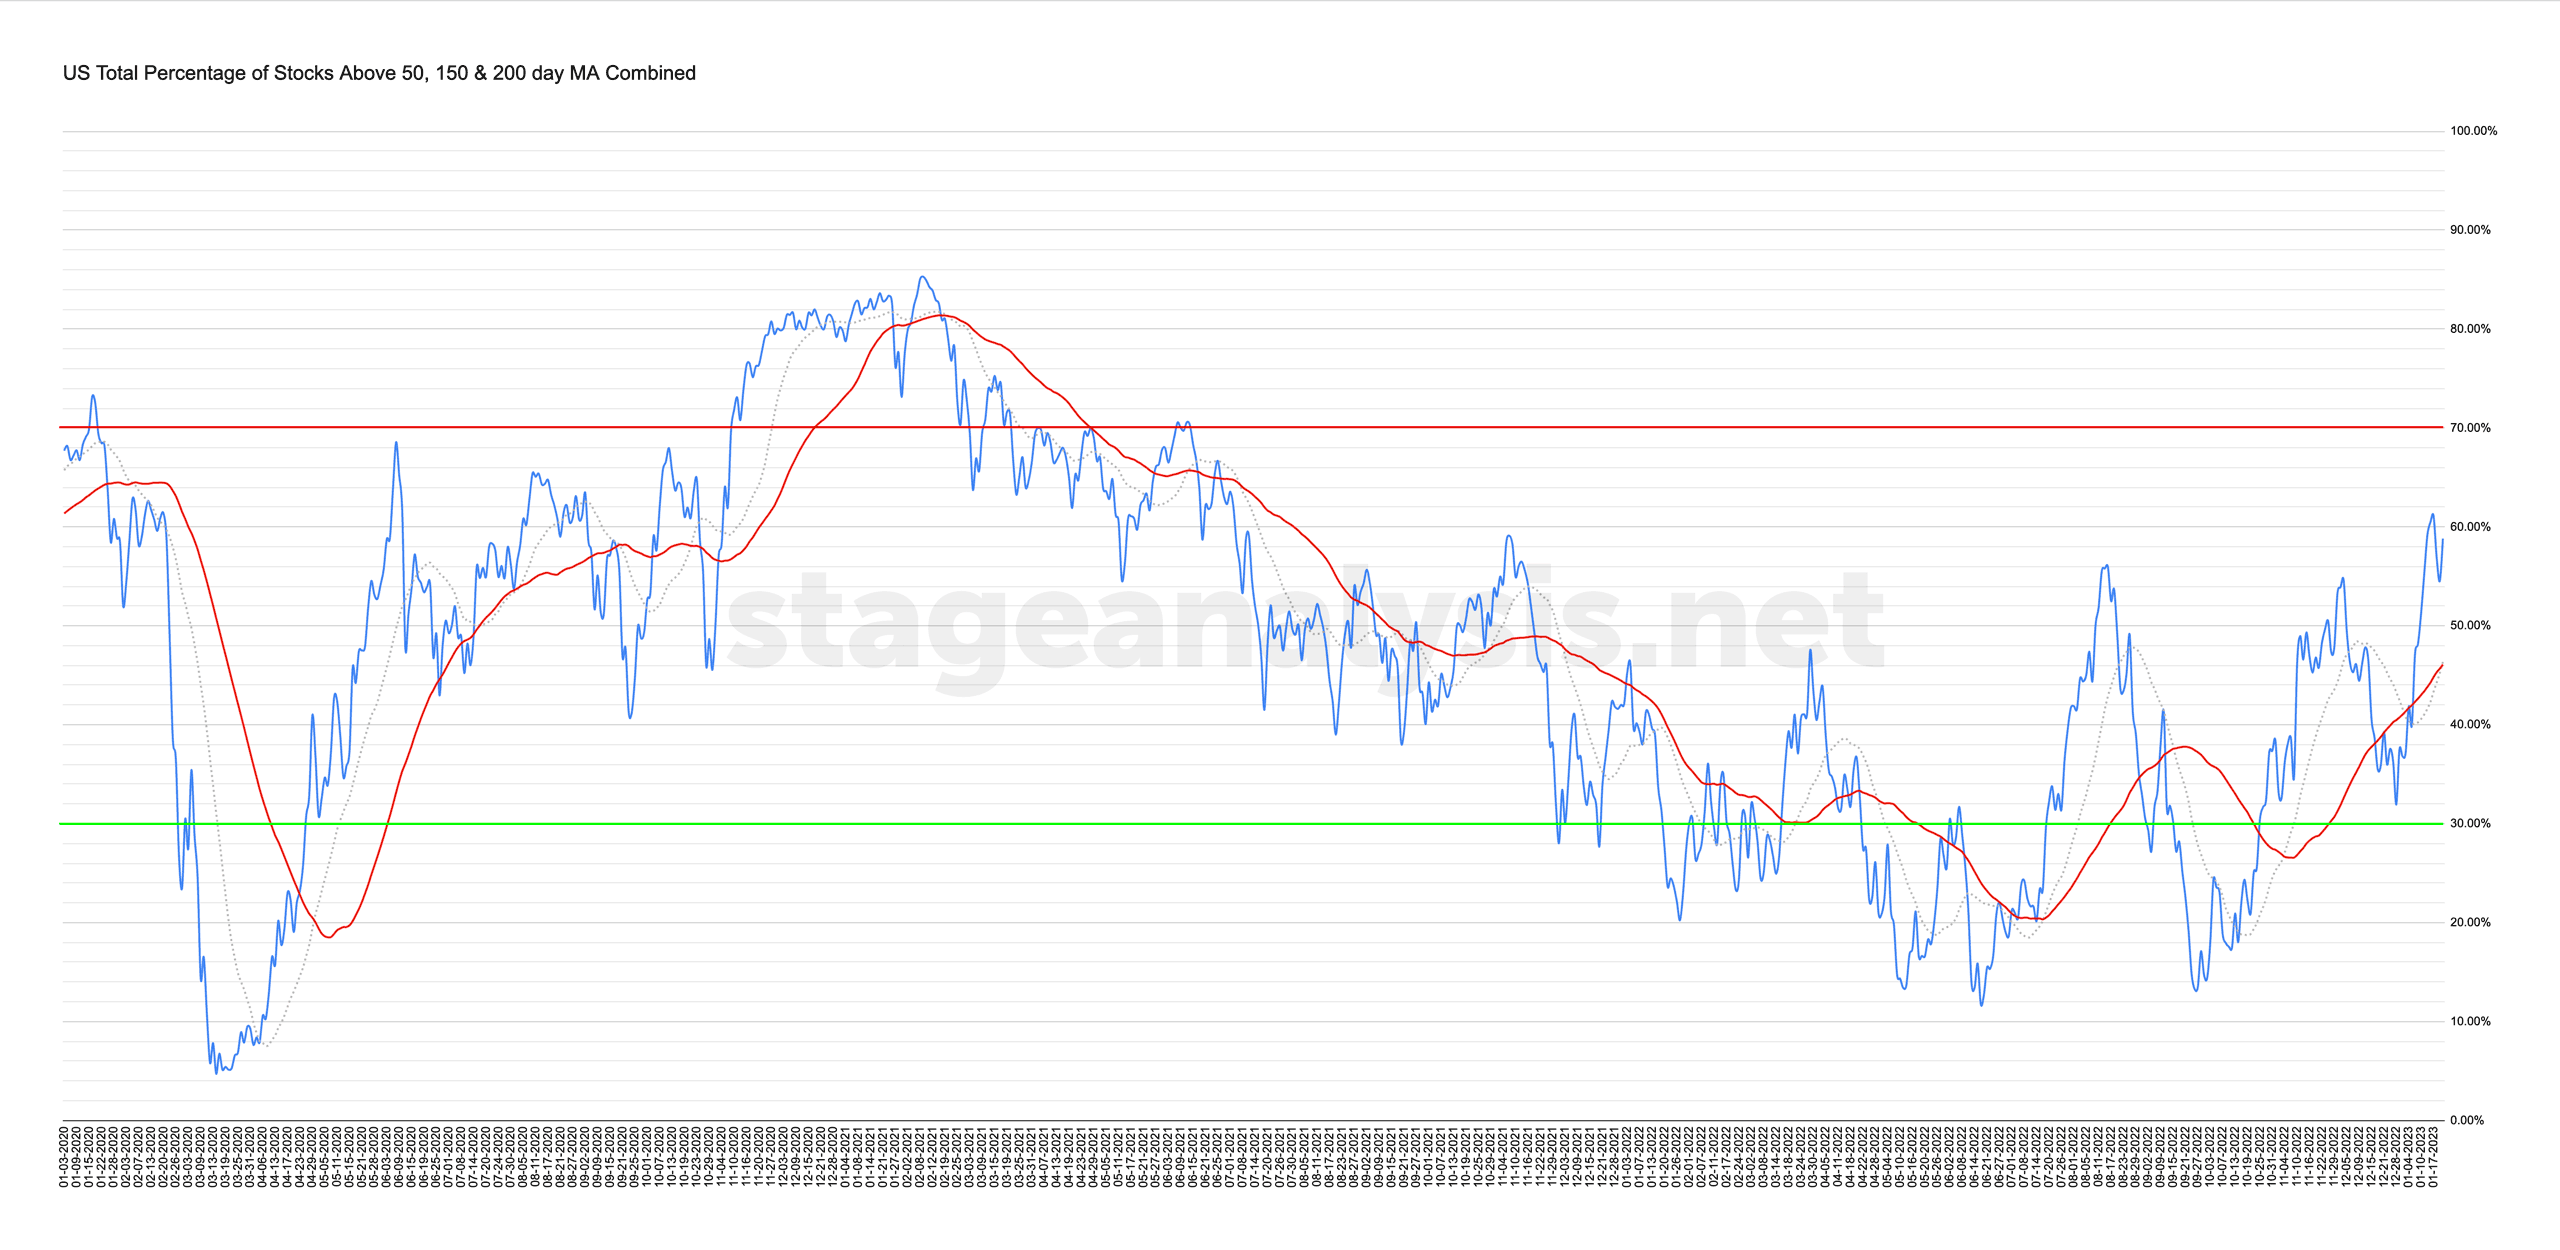
Market Breadth: Percentage of Stocks Above their 50 Day, 150 Day & 200 Day Moving Averages Combined
Custom Percentage of Stocks Above Their 50 Day, 150 Day & 200 Day Moving Averages Combined Market Breadth Charts for the Overall US Market, NYSE and Nasdaq for Market Timing and Strategy.
Read More
15 January, 2023
Stage Analysis Members Video – 15 January 2023 (1hr 15mins)
The Stage Analysis members weekend video featuring analysis of the major US Indexes as many approach their Stage 2 levels. Followed by a look at the futures charts, US Industry Groups RS Rankings, IBD Industry Groups Bell Curve - Bullish Percent, the Market Breadth Update to help to determine the Weight of Evidence and finishing with the US Stocks Watchlist in detail on multiple timeframes.
Read More
14 January, 2023
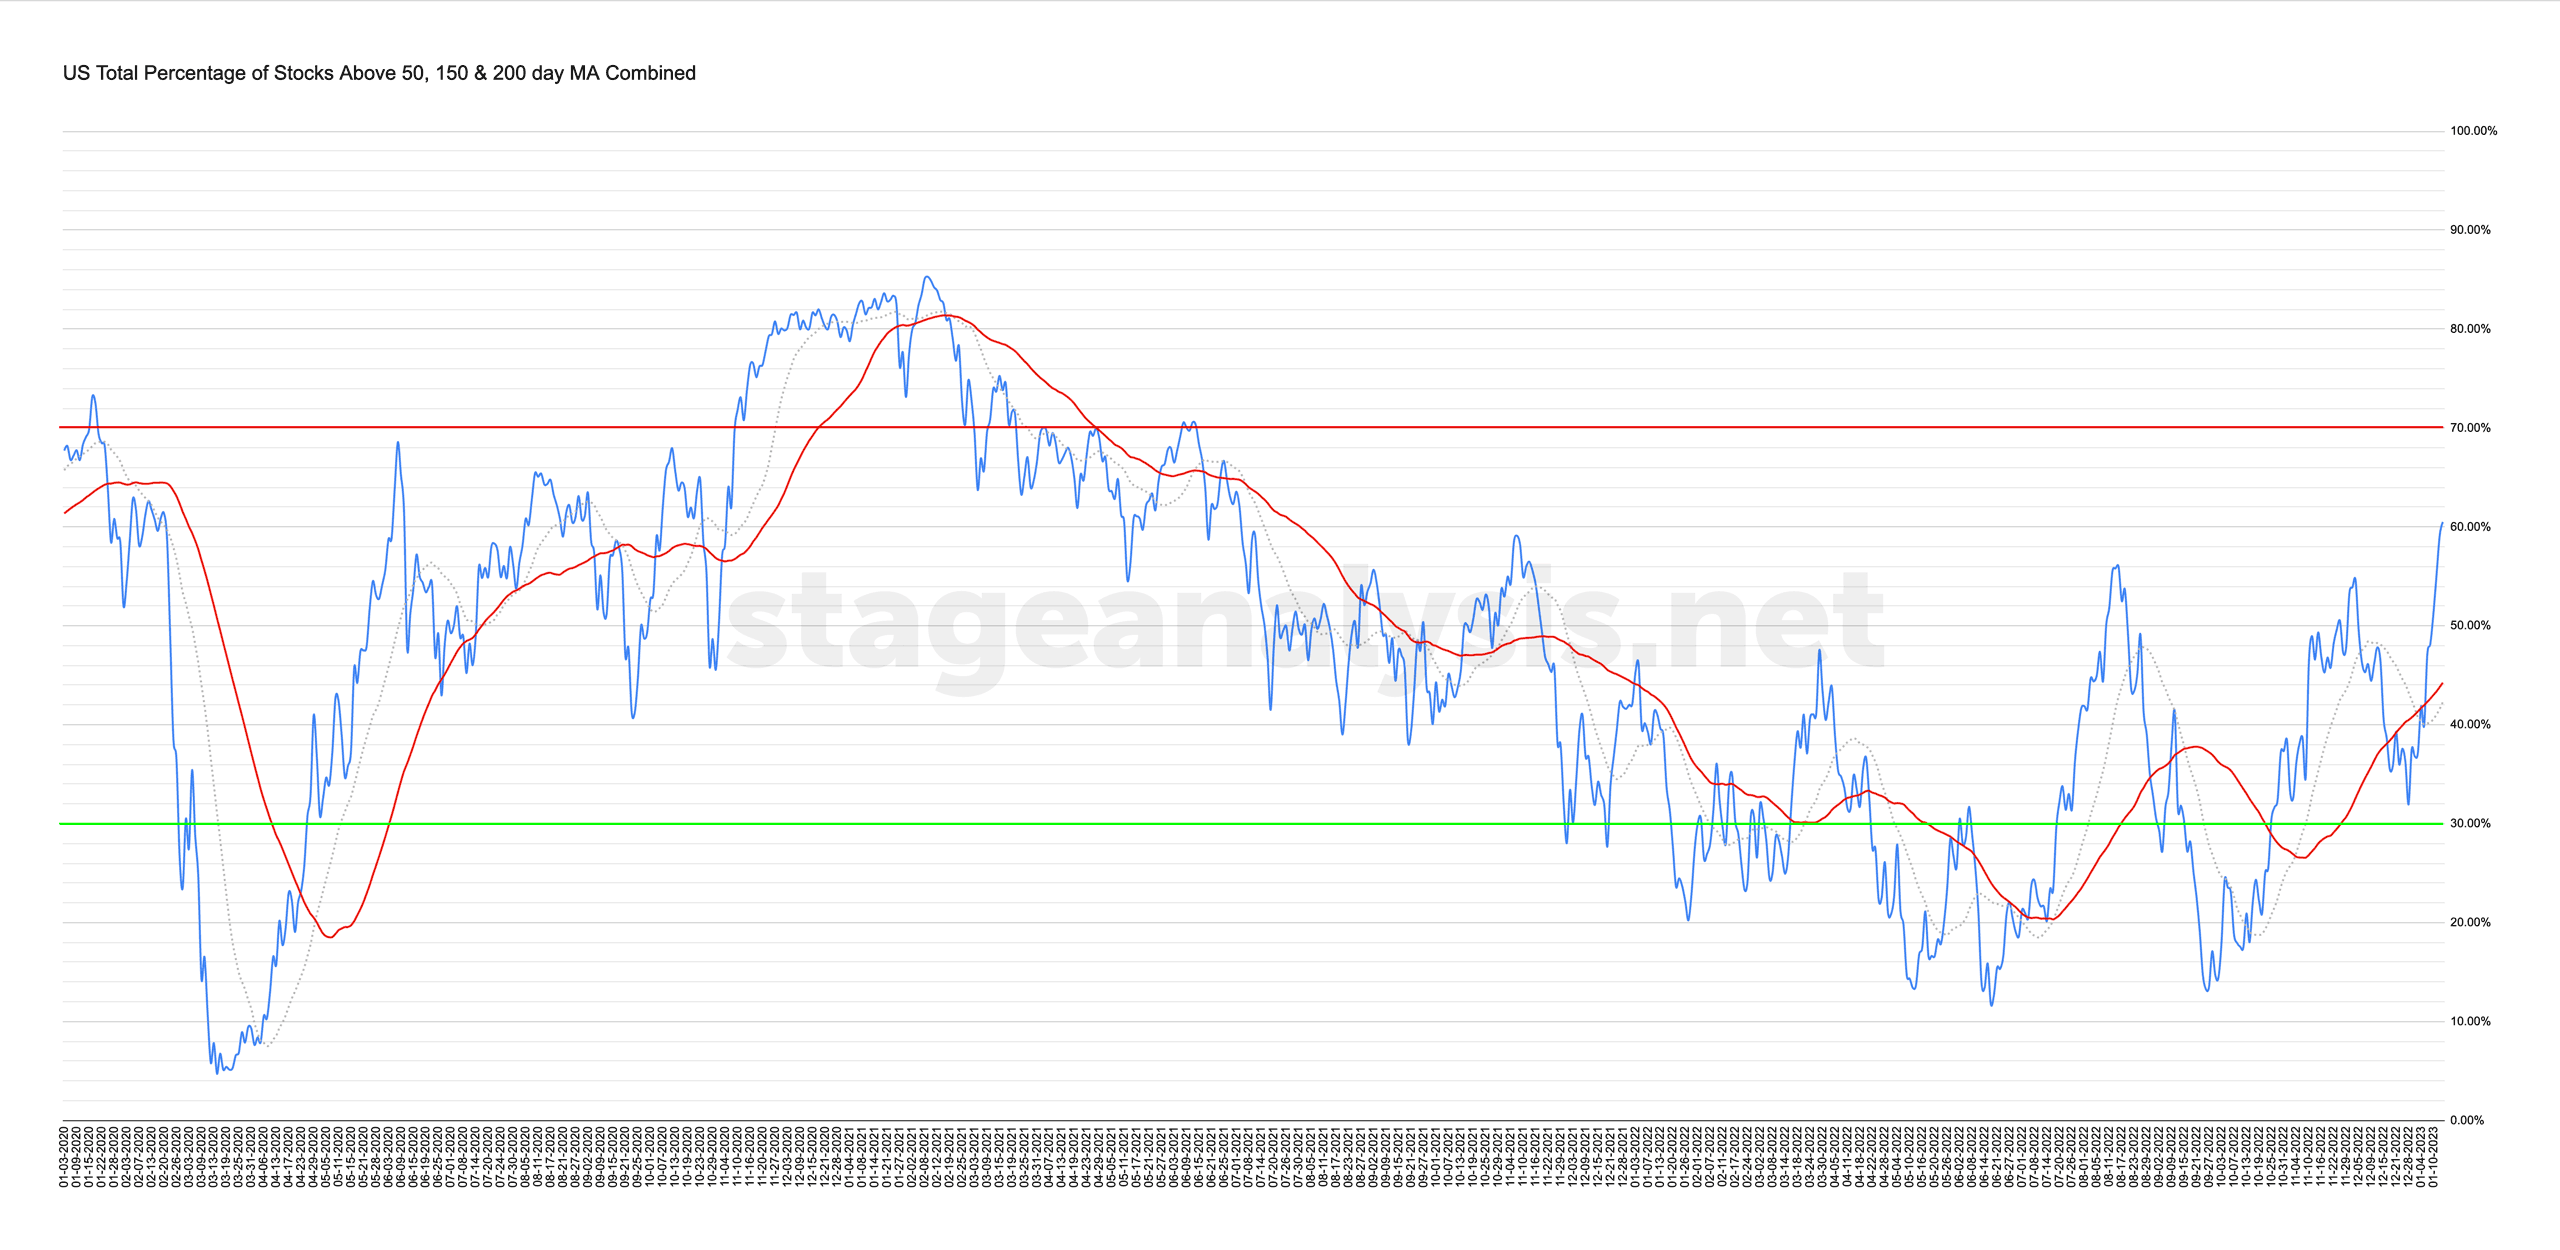
Market Breadth: Percentage of Stocks Above their 50 Day, 150 Day & 200 Day Moving Averages Combined
Custom Percentage of Stocks Above Their 50 Day, 150 Day & 200 Day Moving Averages Combined Market Breadth Charts for the Overall US Market, NYSE and Nasdaq for Market Timing and Strategy.
Read More
11 January, 2023
Early Stage 2 Groups & Stocks Special – 11 January 2023 (54 mins)
Stage Analysis Members midweek video with a special feature on the groups and stocks in early Stage 2, as more stocks continue to appear in the watchlist that are attempting to breakout or rebound in early Stage 2 or make continuation breakouts.
Read More
09 January, 2023
Sector Breadth: Percentage of US Stocks Above Their 150 day (30 Week) Moving Averages
The Percentage of US Stocks Above Their 150 day Moving Averages in the 11 major sectors has moved higher by +12.92% over the last three weeks since the previous post of the 19th December, and so the overall average is now at 49.40%, which is firmly back in the Stage 1 zone in the middle of the range.
Read More