
Market Breadth: Percentage of Stocks Above their 50 Day, 150 Day & 200 Day Moving Averages Combined
The full post is available to view by members only. For immediate access:
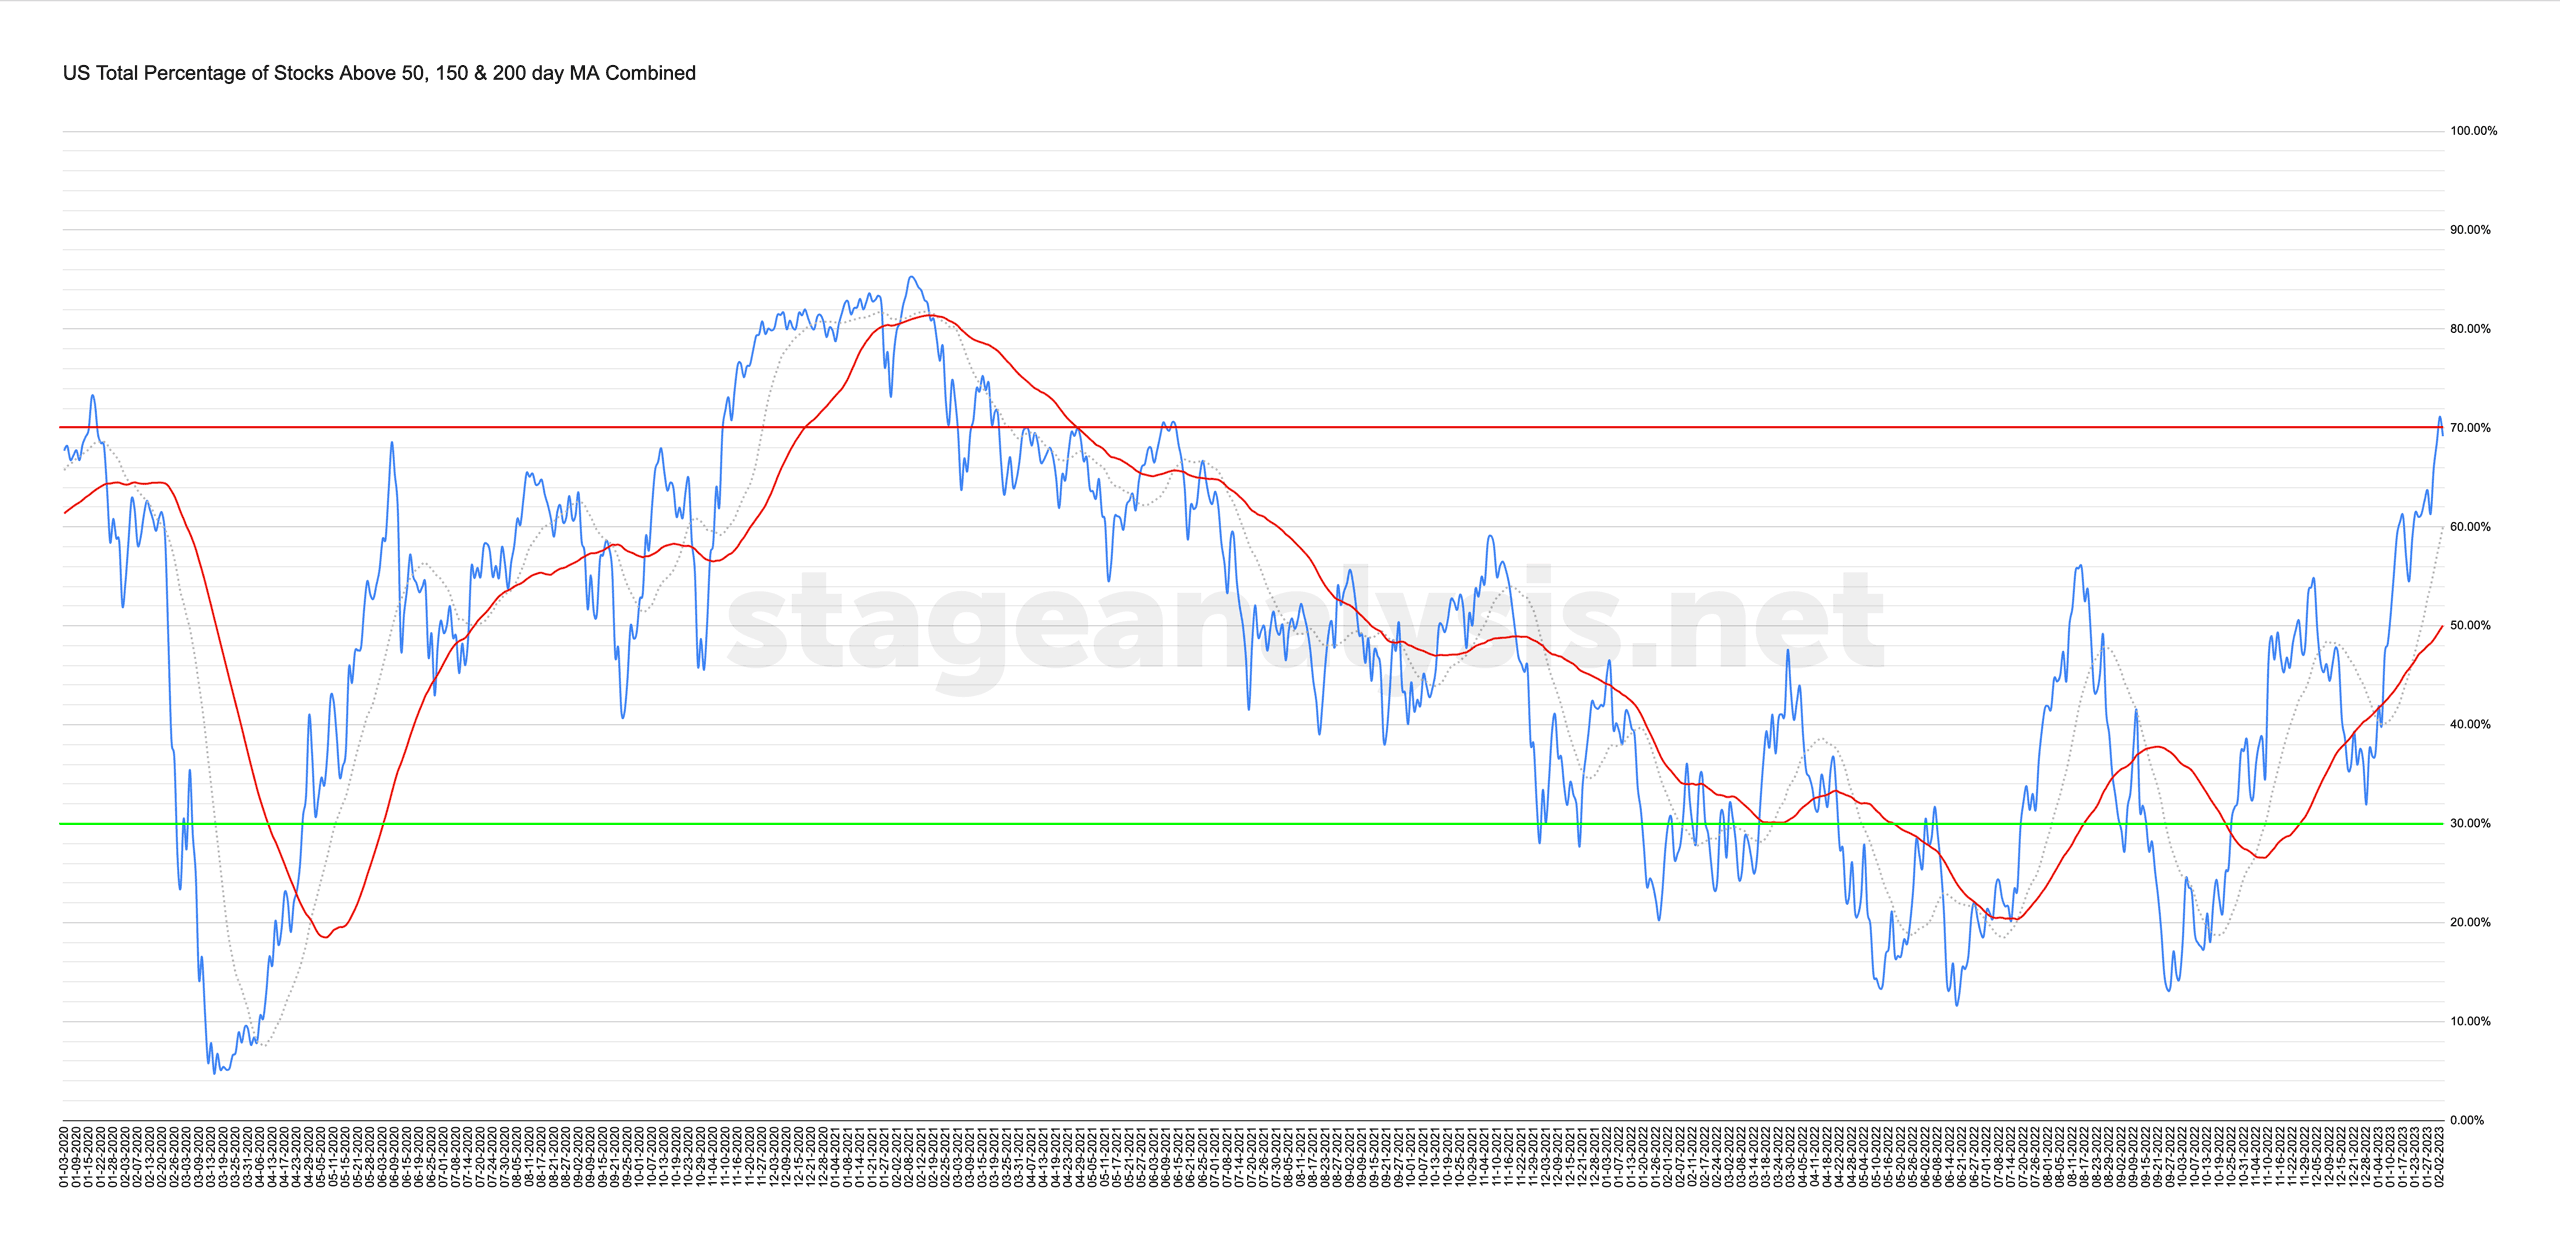
69.17% (+5.47% 1wk)
Status: Positive Environment – Stage 2 zone
The US Total Percentage of Stocks above their 50 Day, 150 Day & 200 Day Moving Averages (shown above) continued to expand over the last week, adding a further +5.47% and reaching the 70% level for the first time since June 2021, when it was on the decline. However, when coming from a lower level – as currently – it last reached the 70% level in November 2020, although it did get very close in June 2020, and that move was from the lower levels also.
The overall combined average now stands at 69.17% in the US market (NYSE and Nasdaq markets combined) above their short, medium and long term moving averages, which puts it at +19.14% above its own 50 day MA signal line.
So we consider its status as in a Positive Environment (as its above both rising MAs), and with the strong move above the 60% level, it is now considered in the Stage 2 zone. As more than two-thirds of stocks are above their short, medium and long term moving averages.
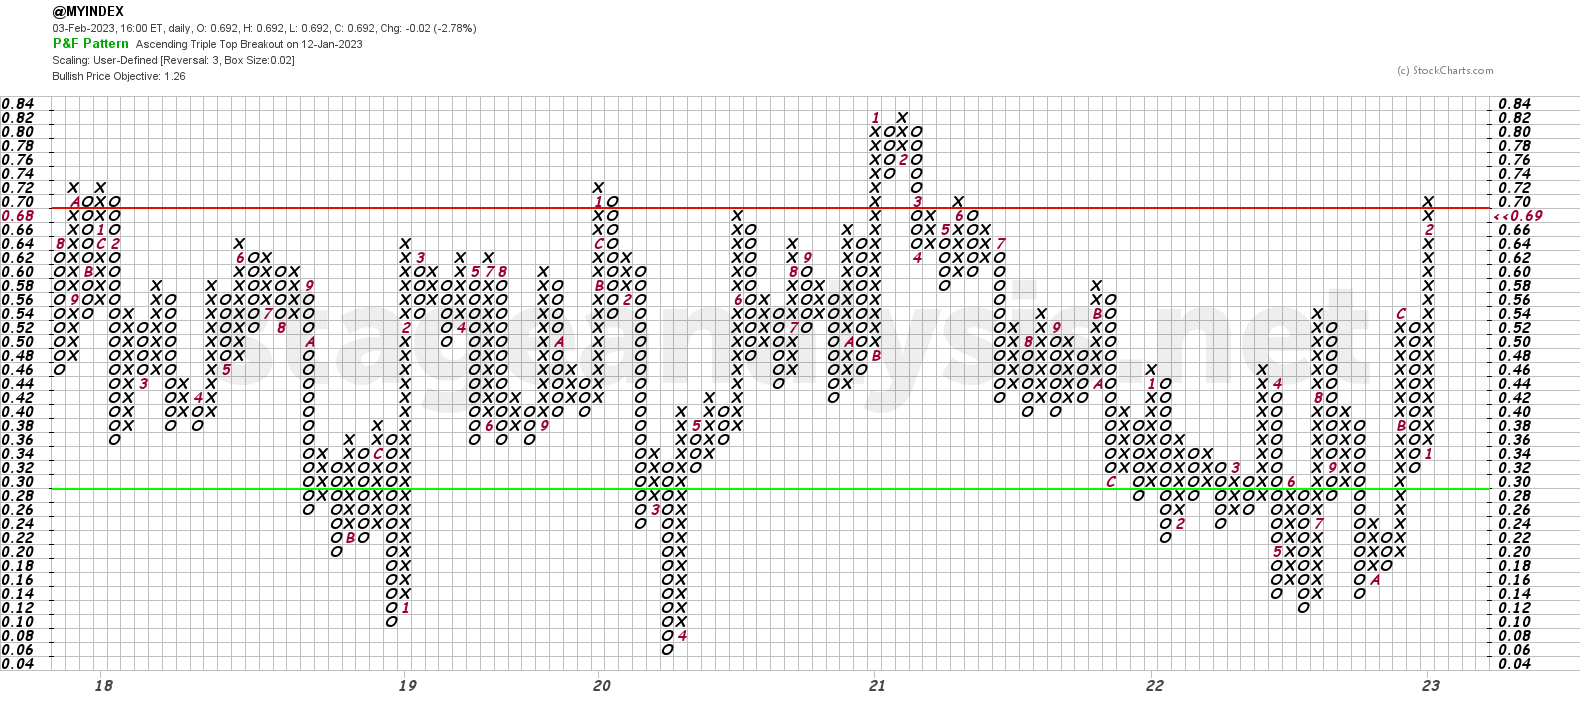
The Point and Figure (P&F) chart (shown above), added 4 Xs to the current column this week, touching into the upper zone and so it remains on Bull Confirmed status and on Offense (as it's in a column of Xs), which its been on since the reversal to Xs on the 4th January.
Become a Stage Analysis Member:
To see more like this – US Stocks watchlist posts, detailed videos each weekend, use our unique Stage Analysis tools, such as the US Stocks & ETFs Screener, Charts, Market Breadth, Group Relative Strength and more...
Join Today
Disclaimer: For educational purpose only. Not investment advice. Seek professional advice from a financial advisor before making any investing decisions.