
Market Breadth: Percentage of Stocks Above their 50 Day, 150 Day & 200 Day Moving Averages Combined
The full post is available to view by members only. For immediate access:
58.83% (-1.68% 1wk)
Status: Positive Environment – borderline between the Stage 1 and Stage 2 zones
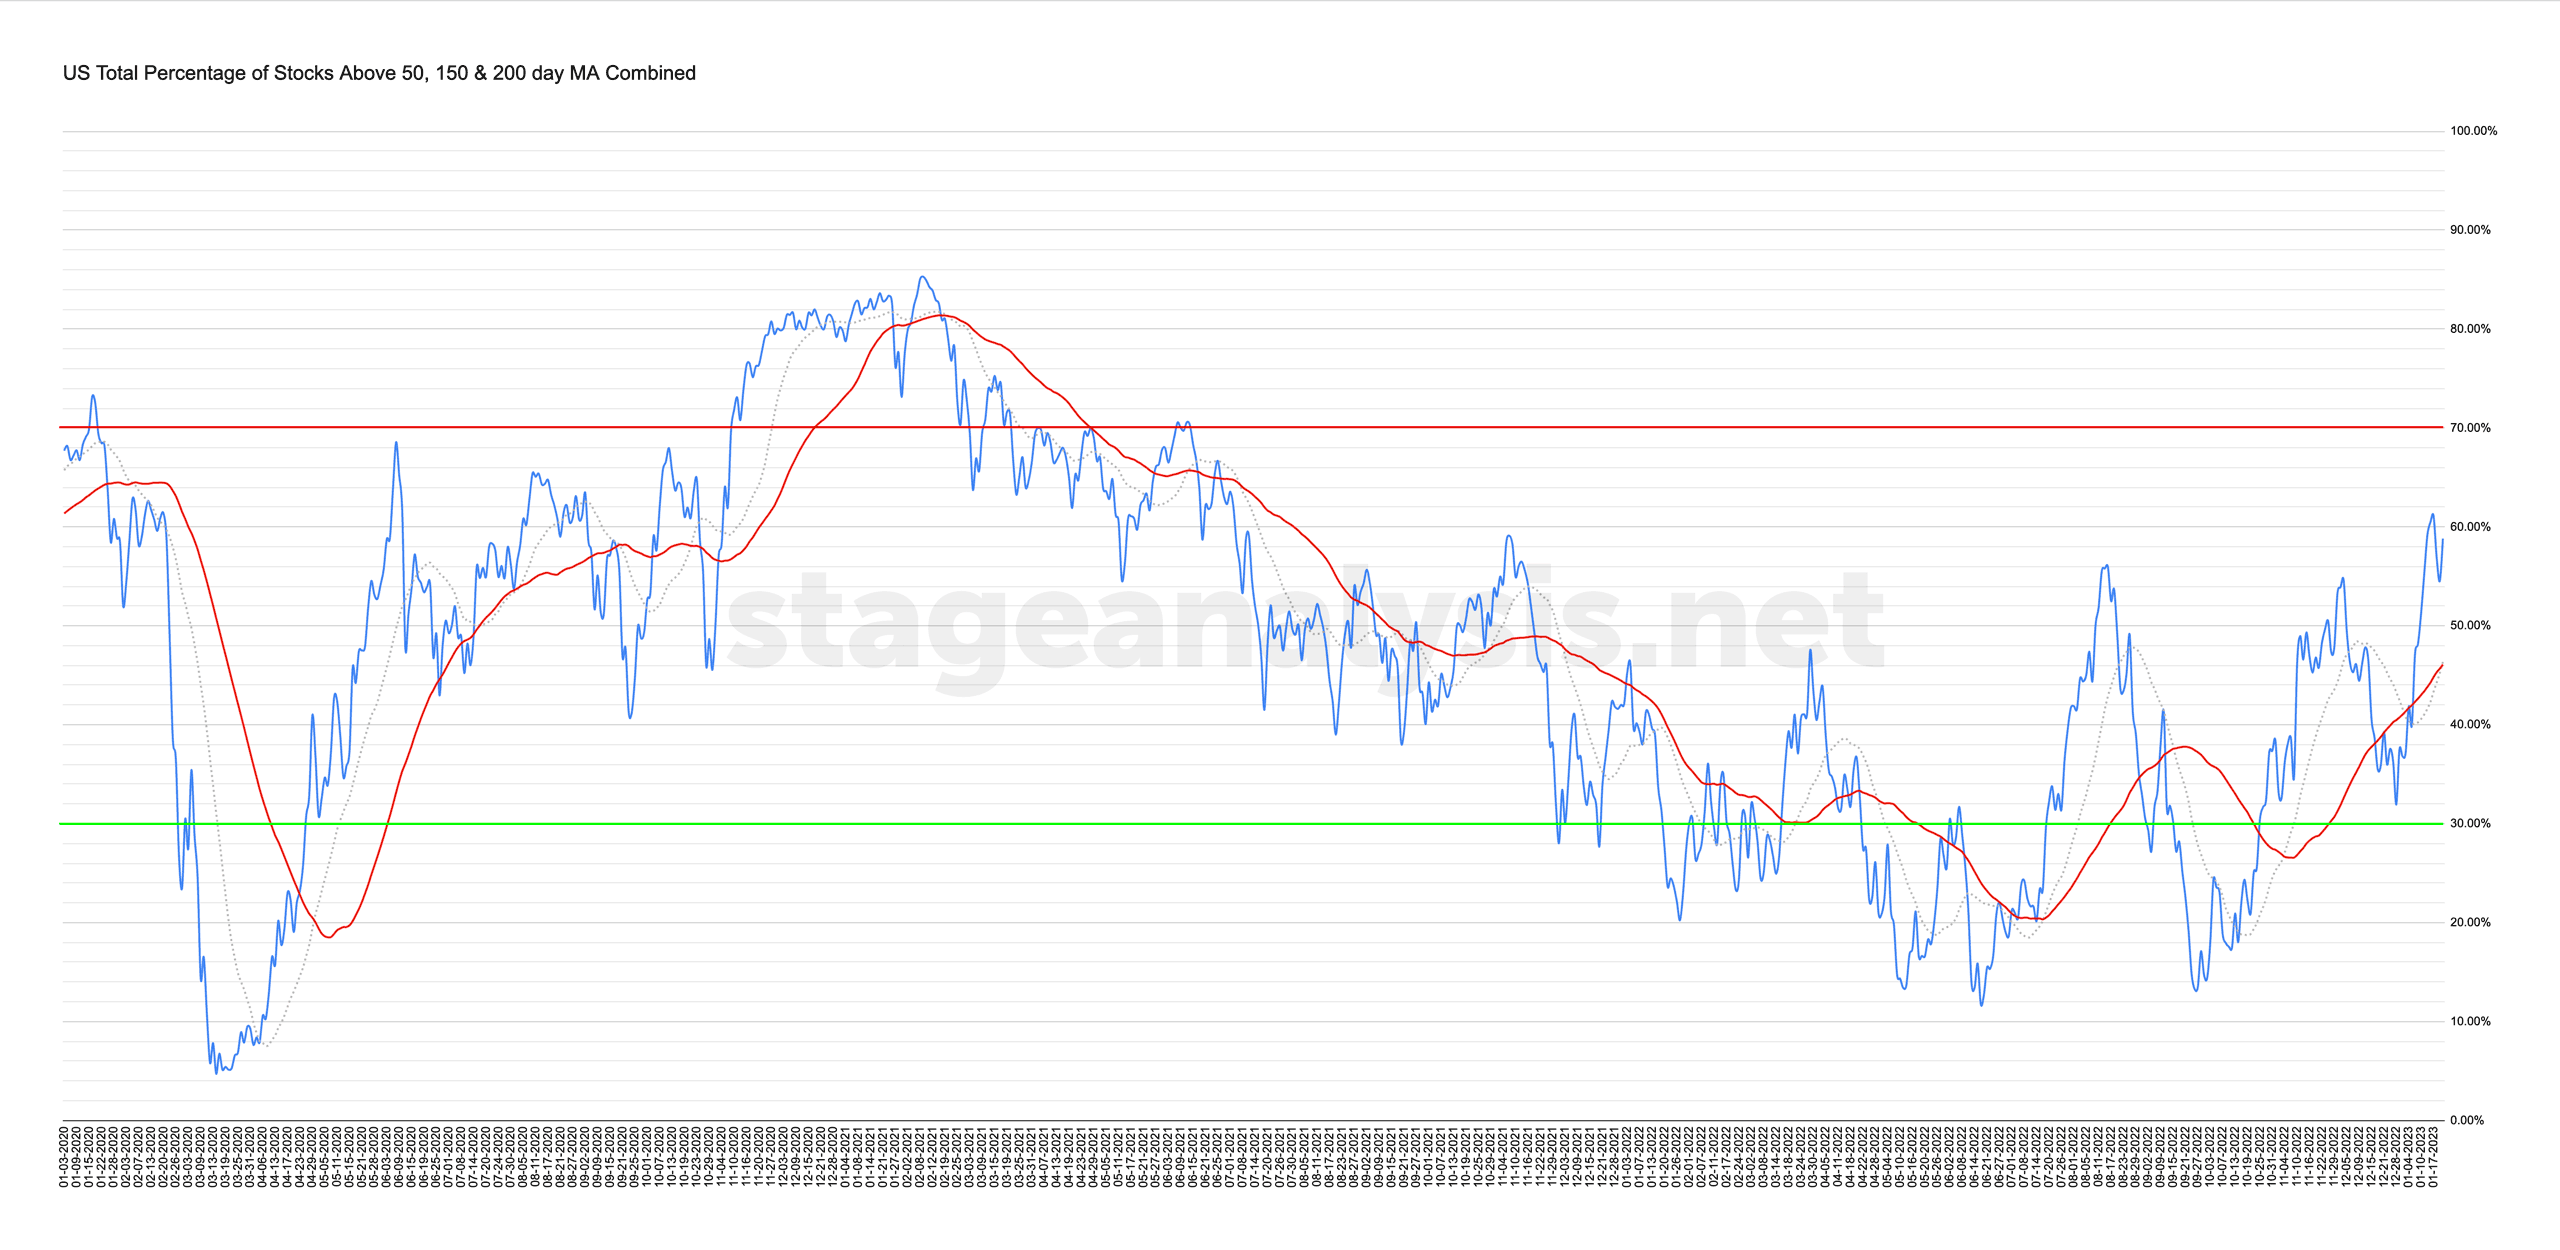
The US Total Percentage of Stocks above their 50 Day, 150 Day & 200 Day Moving Averages (shown above) pulled back during the week to just below 55%, but recovered on Friday again to end the week only slightly lower by -1.68%.
The overall combined average now stands at 58.83% in the US market (NYSE and Nasdaq markets combined) above their short, medium and long term moving averages, which puts it at +12.74% above its own 50 day MA signal line.
So we consider its status as in a Positive Environment (as its above both rising MAs), and on the borderline between the Stage 1 and Stage 2 zones. However, to move into Stage 2 zone we'd want to see a strong move above the 60% level and for it then hold above that for multiple weeks ideally.
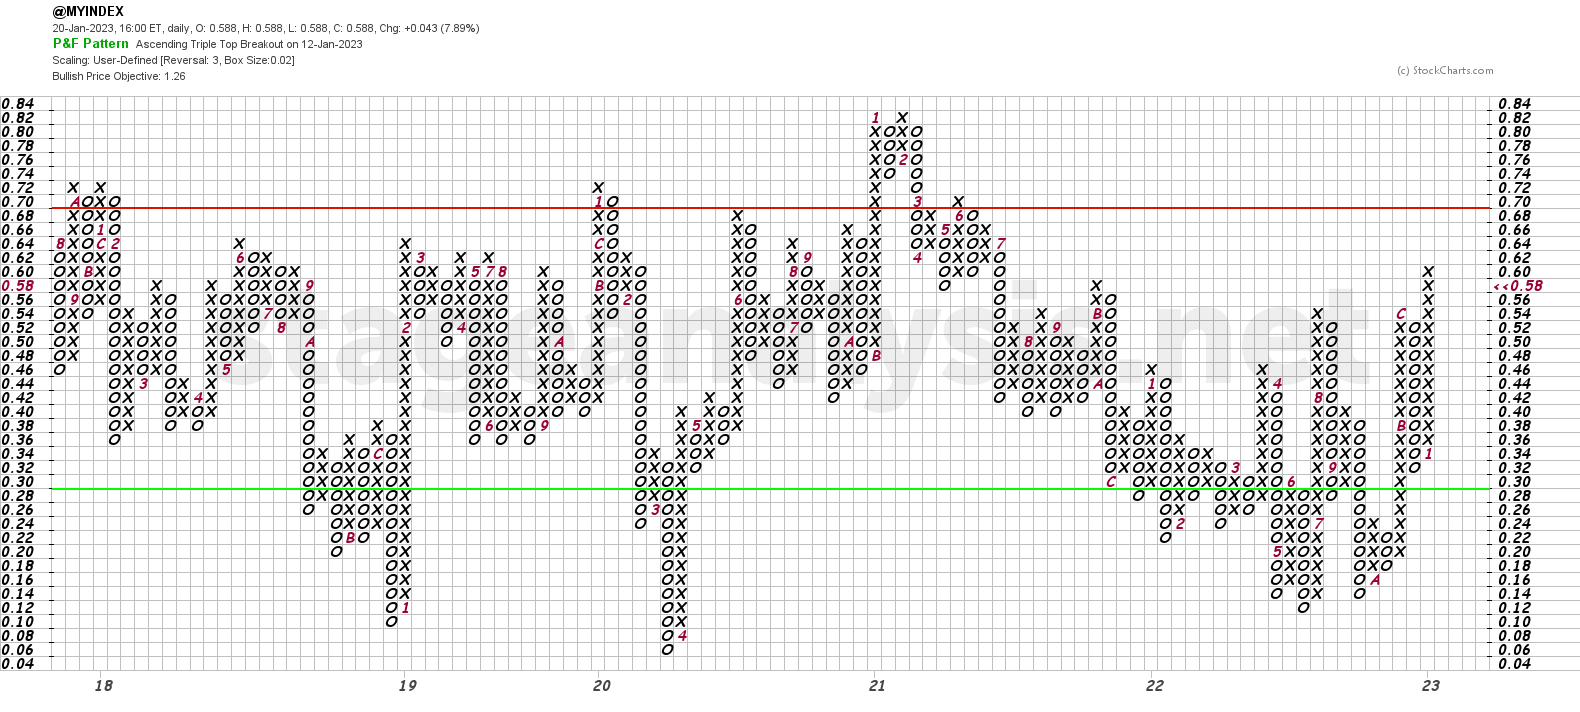
The Point and Figure (P&F) chart (shown above), had no change this week, as the pullback during the week didn't reverse below the 54% level, which it would have needed to close below to reverse to a column of Os, and so it remains on Bull Confirmed status and on Offense (as it's in a column of Xs), which its been on since the reversal to Xs on the 4th January.
Become a Stage Analysis Member:
To see more like this – US Stocks watchlist posts, detailed videos each weekend, use our unique Stage Analysis tools, such as the US Stocks & ETFs Screener, Charts, Market Breadth, Group Relative Strength and more...
Join Today
Disclaimer: For educational purpose only. Not investment advice. Seek professional advice from a financial advisor before making any investing decisions.