
Sector Breadth: Percentage of US Stocks Above Their 150 day (30 Week) Moving Averages
The full post is available to view by members only. For immediate access:

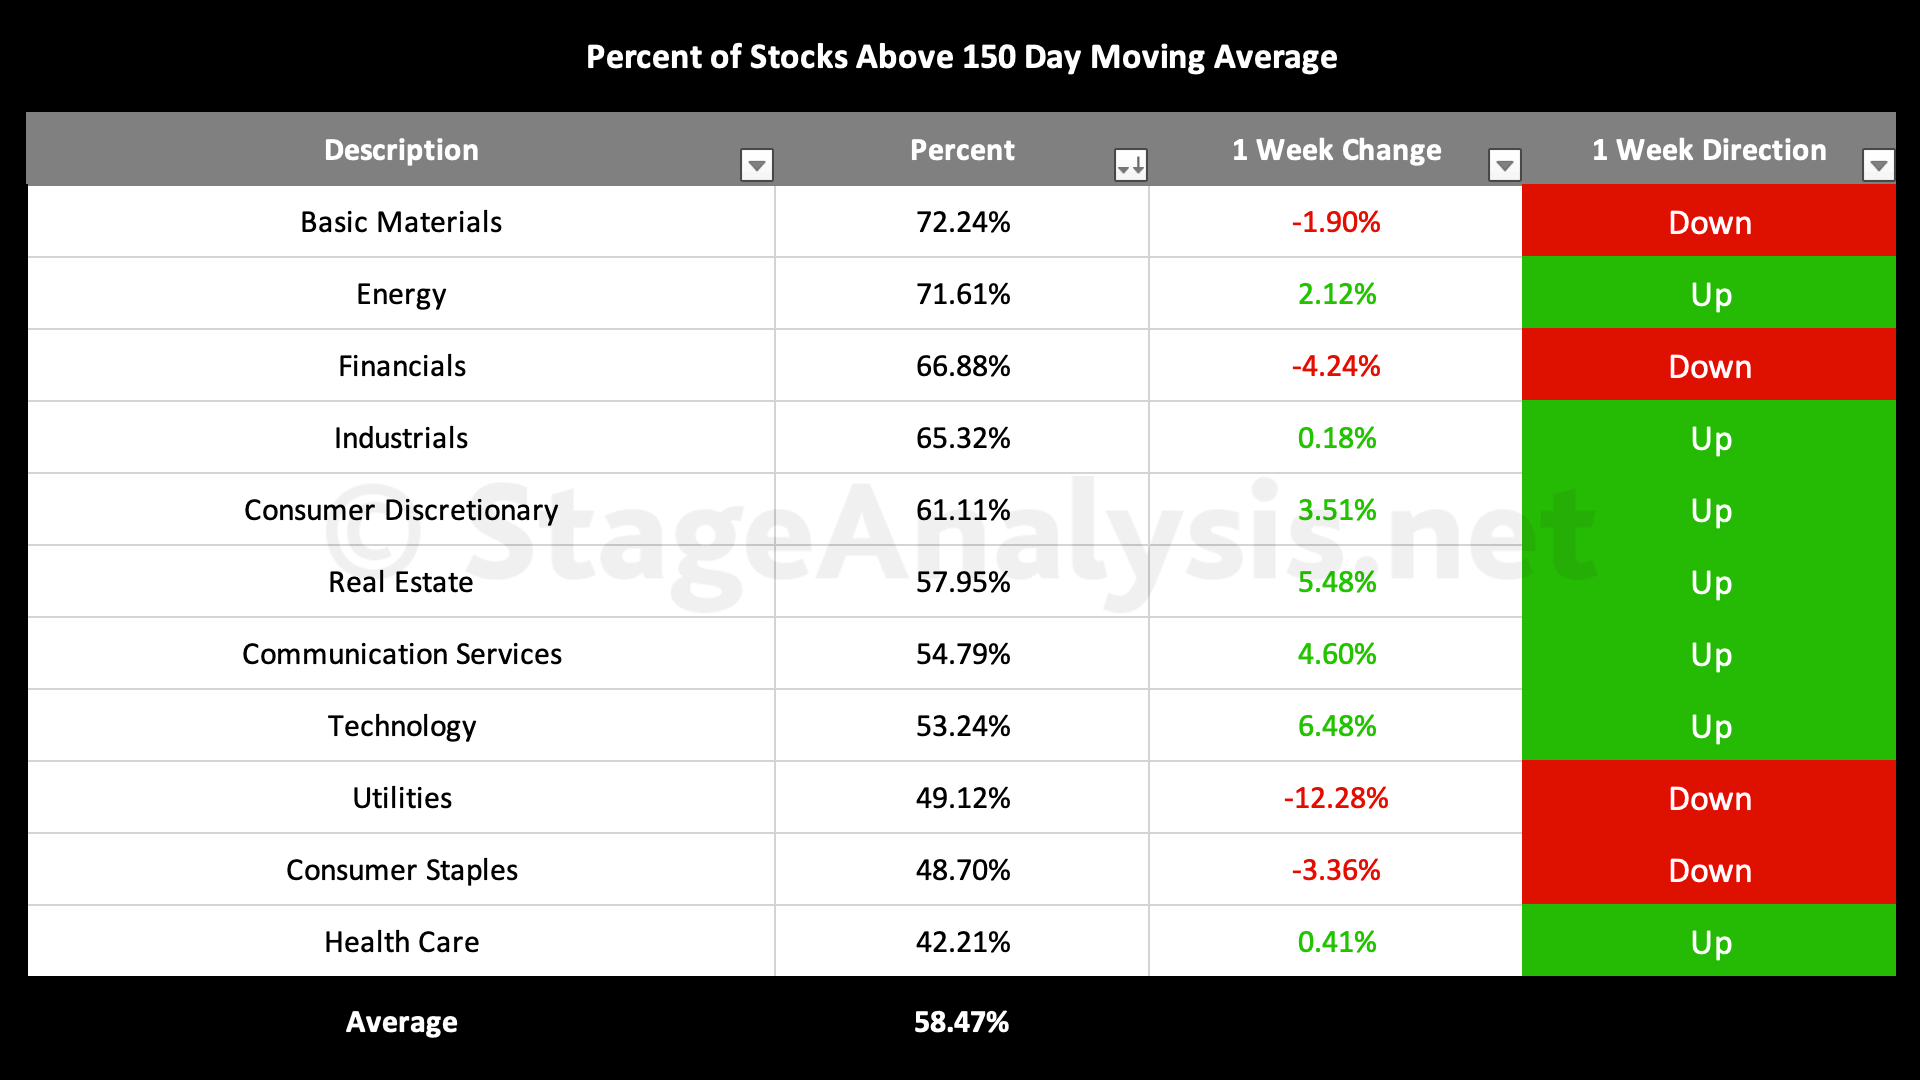
Average: 58.47% (+9.07% 2wks)
- 5 sectors in the Stage 2 zone (Basic Materials, Energy, Financials, Industrials, Consumer Discretionary)
- 6 sectors in Stage 1 / 3 zone (Real Estate, Communication Services, Technology, Utilities, Consumer Staples, Health Care)
- 0 sectors in Stage 4 zone
The Percentage of US Stocks Above Their 150 day Moving Averages in the 11 major sectors has shown continued improvement over the last two weeks since the previous post of the 9th January 2023, increasing by a further +9.07% to 58.47% overall, which puts it at the top of the middle range (Neutral+), which is the Stage 1 zone.
Sector changes: The sectors in the Stage 2 zone (Above 60%) has increased by 2 to 5. The sectors in the Stage 1 / 3 zone (40% to 60% range) has increased by 1 to 6, and the number of sectors the Stage 4 zone (Below 40%) has decreased by 3 to 0. So all sectors are now either in Stage 1 / 3 zone or the Stage 2 zone, with zero groups now in the Stage 4 zone.
Therefore the market is in a neutral / positive position (Stage 1 zone) in the upper middle of the range, and in order to move into Stage 2 territory it would need to further strengthen and move above the 60% level convincingly.
Sector Breadth Table – Ordered by Relative Strength
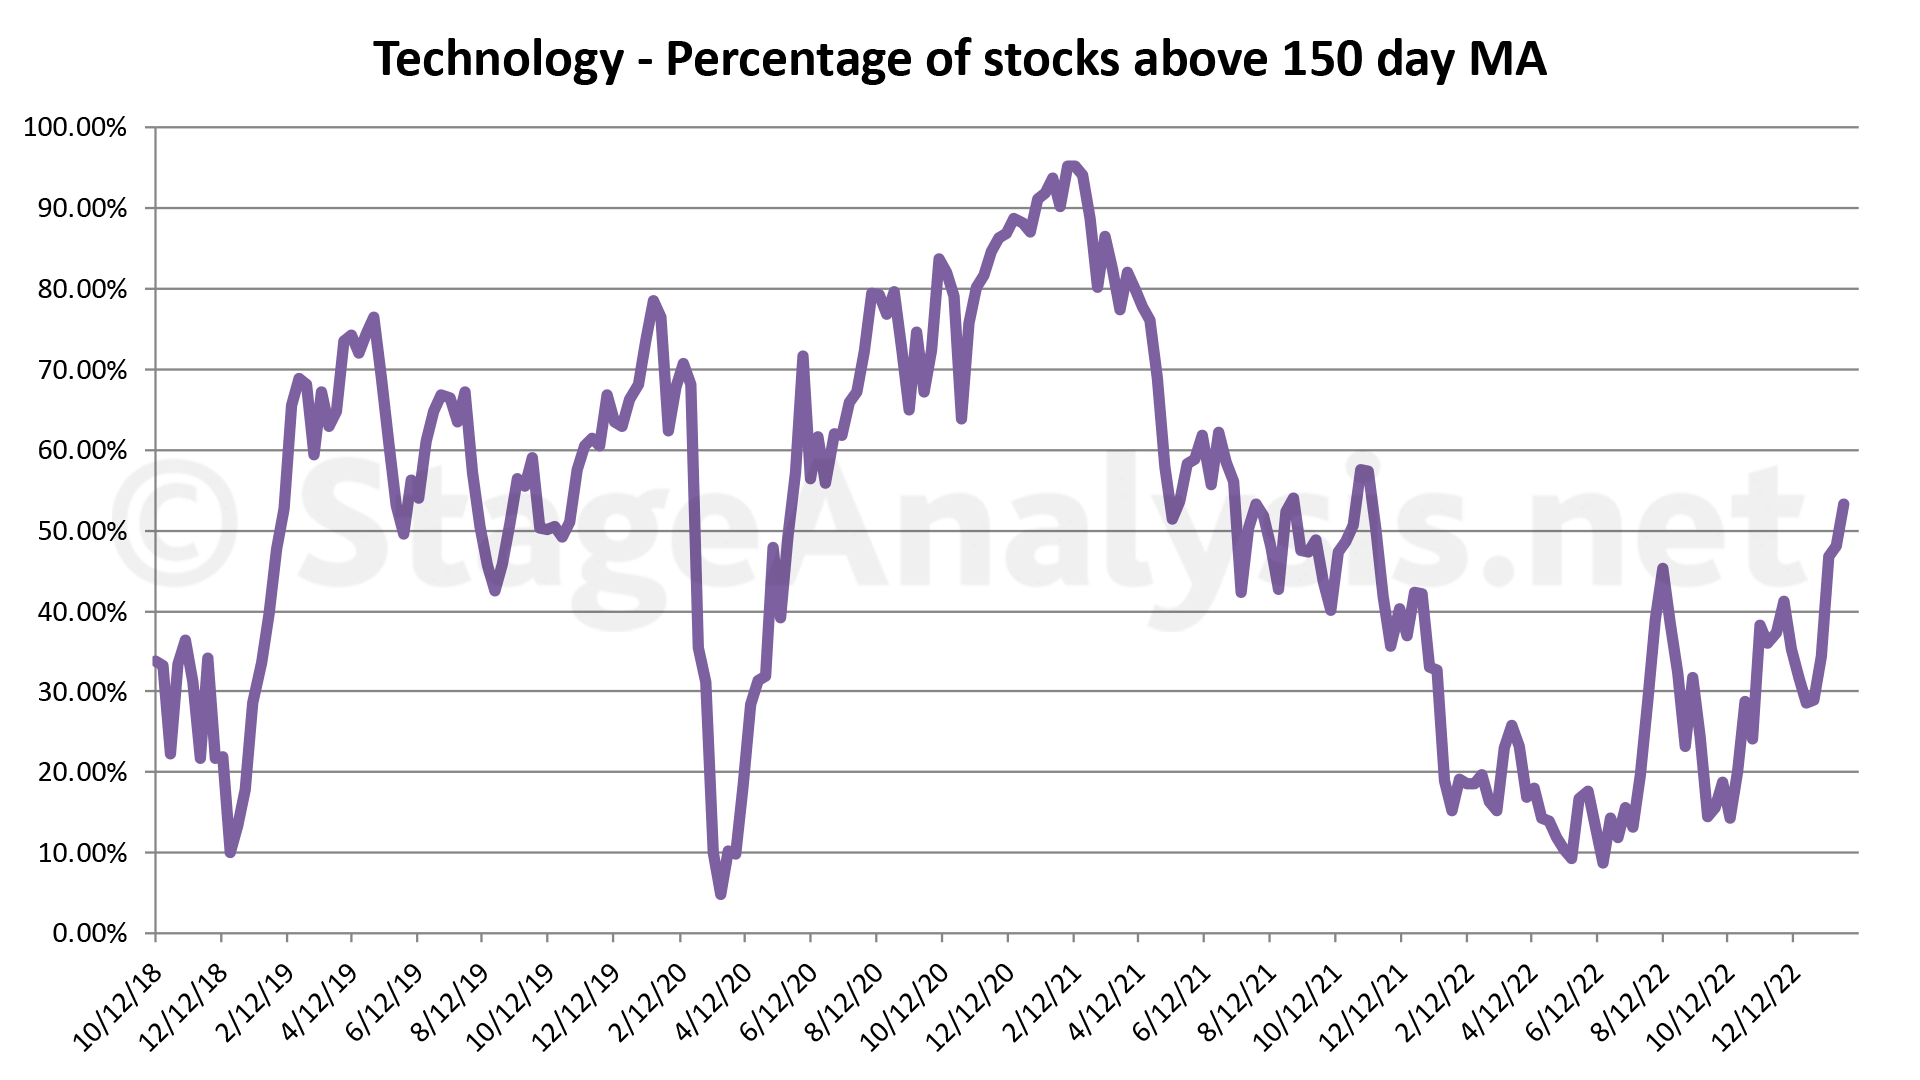
Sector Breadth Charts (Members Only)
Below is the charts for the 11 sectors that shows back to late 2018. Which gives a very clear picture of the overall health of each sector and the market as a whole.
Become a Stage Analysis Member:
To see more like this – US Stocks watchlist posts, detailed videos each weekend, use our unique Stage Analysis tools, such as the US Stocks & ETFs Screener, Charts, Market Breadth, Group Relative Strength and more...
Join Today
Disclaimer: For educational purpose only. Not investment advice. Seek professional advice from a financial advisor before making any investing decisions.