
Sector Breadth: Percentage of US Stocks Above Their 150 day (30 Week) Moving Averages
The full post is available to view by members only. For immediate access:
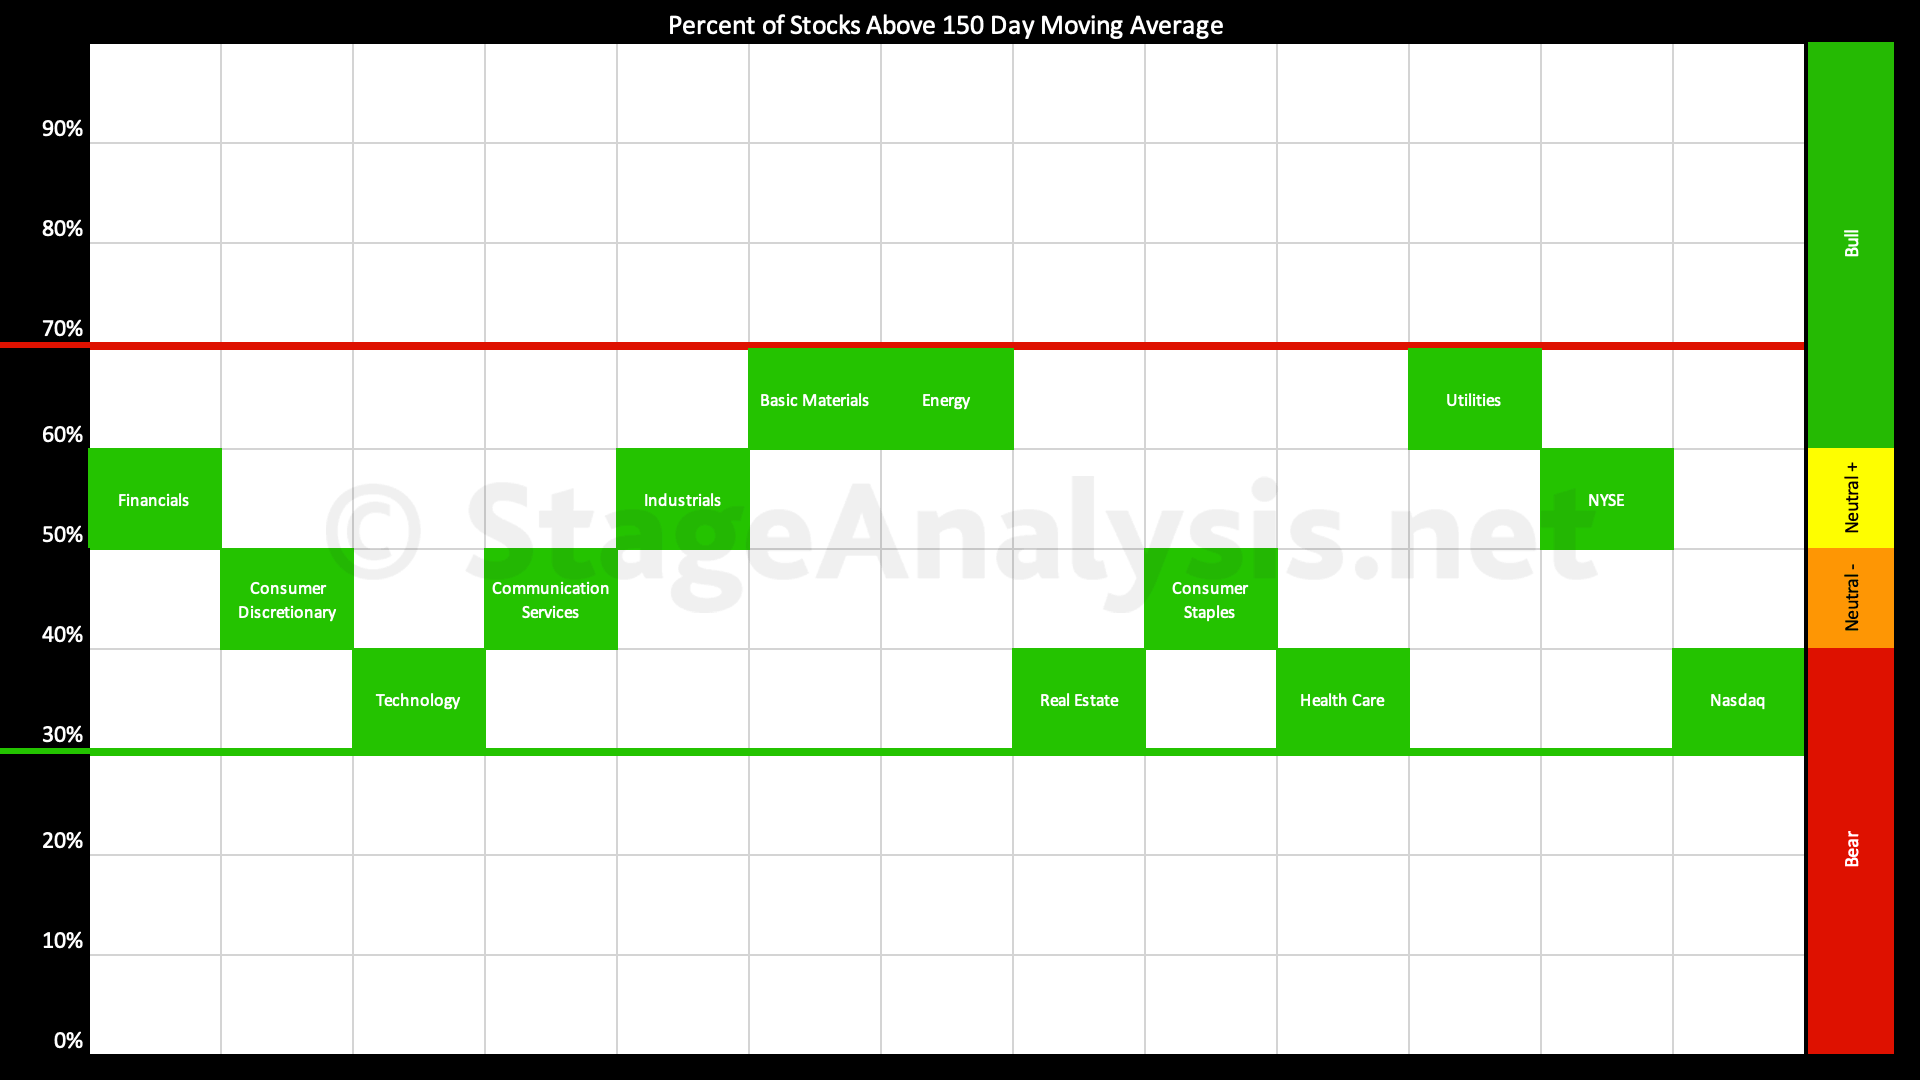
Average: 49.40% (+12.92% 3wks)
- 3 sectors in the Stage 2 zone (Basic Materials, Utilities, Energy)
- 5 sectors in Stage 1 / 3 zone (Financials, Industrials, Consumer Discretionary, Consumer Staples, Communication Services)
- 3 sectors in Stage 4 zone (Technology, Real Estate, Health Care)
The Percentage of US Stocks Above Their 150 day Moving Averages in the 11 major sectors has moved higher by +12.92% over the last three weeks since the previous post of the 19th December, and so the overall average is now at 49.40%, which is firmly back in the Stage 1 zone in the middle of the range.
Sector changes: The sectors in the Stage 2 zone (Above 60%) has increased by 3. The sectors in the Stage 1 / 3 zone (40% to 60% range) has decreased by 1, and the number of sectors the Stage 4 zone (Below 40%) has decreased by 2. So there's been overall improvement in the sector breath, with more sectors moving to the Stage 2 and less now in the Stage 4 zone, with an equal amount in Stages 2 and 4 now, and the majority in the Stage 1 zone.
Therefore the market is in a very neutral position in the middle of the range.
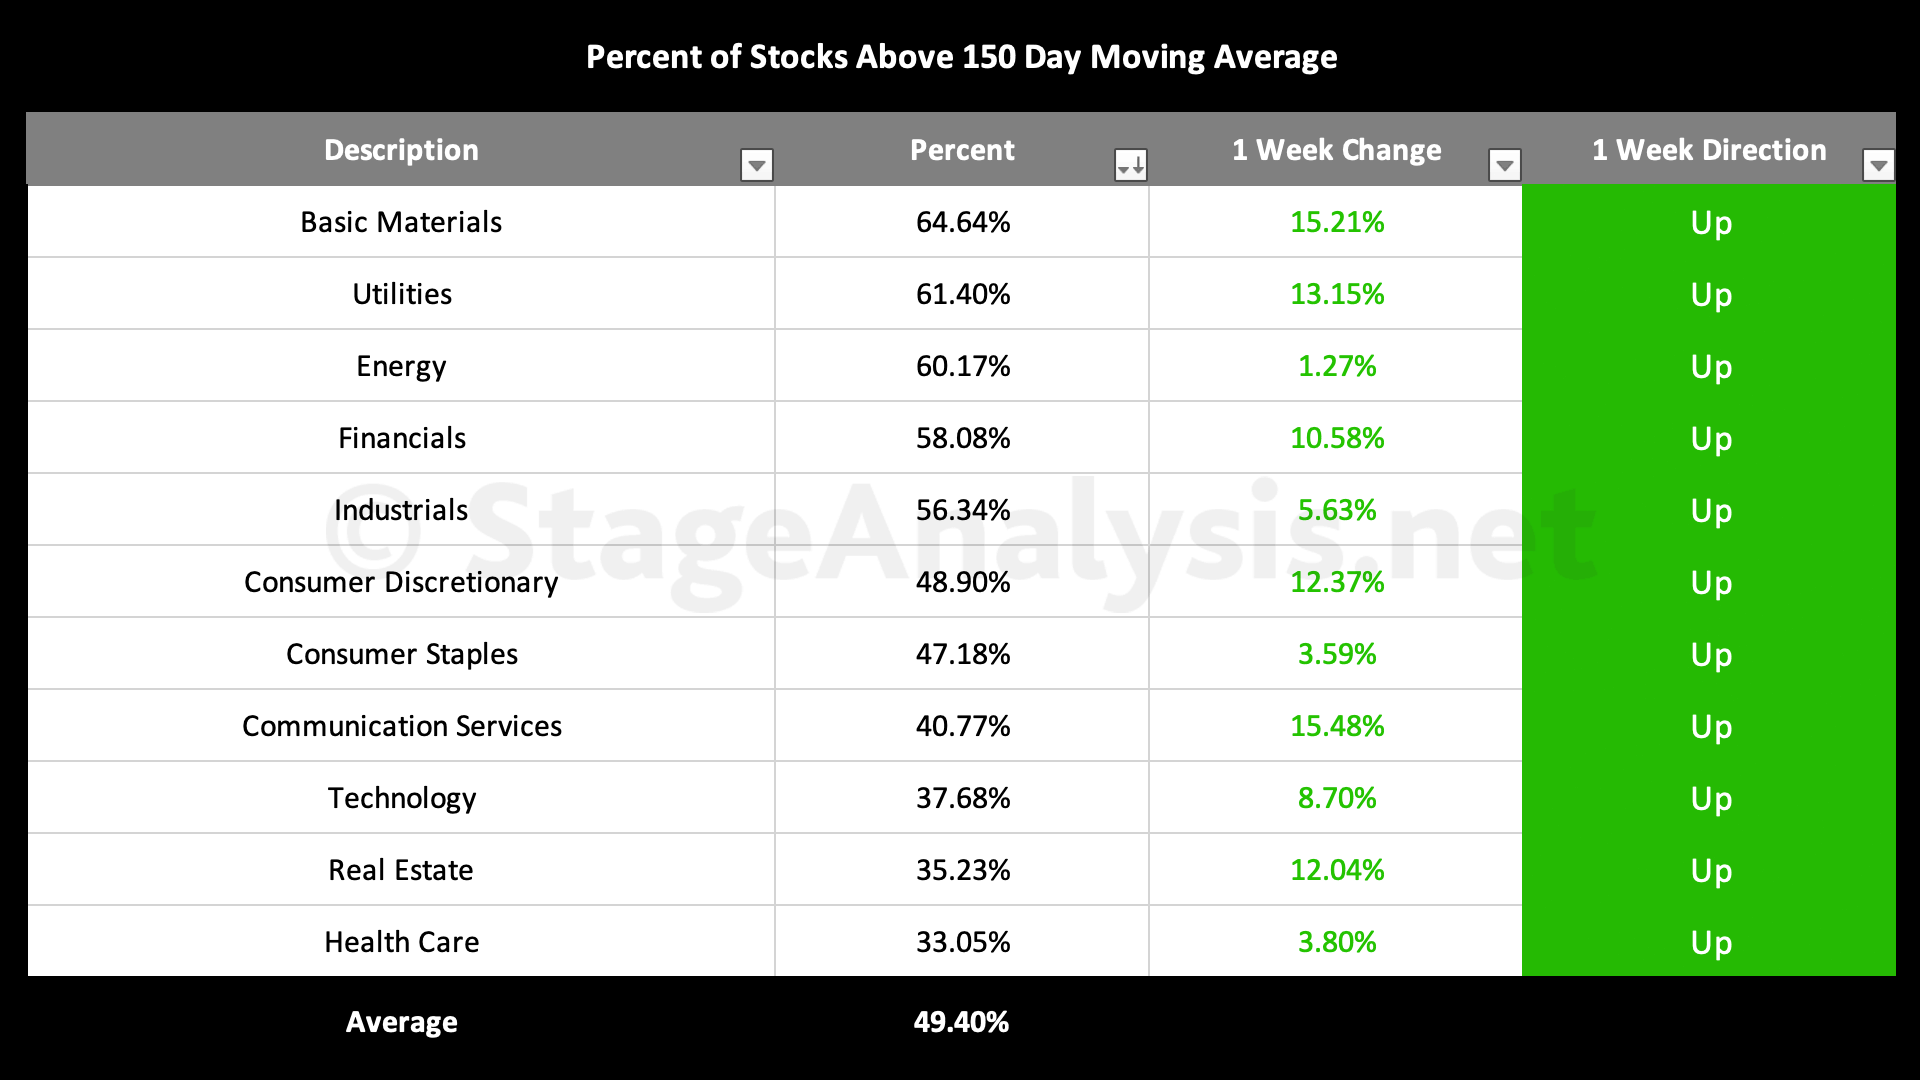
Sector Breadth Table – Ordered by Relative Strength
Sector Breadth Charts (Members Only)
Below is the charts for the 11 sectors that shows back to late 2018. Which gives a very clear picture of the overall health of each sector and the market as a whole.
Become a Stage Analysis Member:
To see more like this – US Stocks watchlist posts, detailed videos each weekend, use our unique Stage Analysis tools, such as the US Stocks & ETFs Screener, Charts, Market Breadth, Group Relative Strength and more...
Join Today
Disclaimer: For educational purpose only. Not investment advice. Seek professional advice from a financial advisor before making any investing decisions.