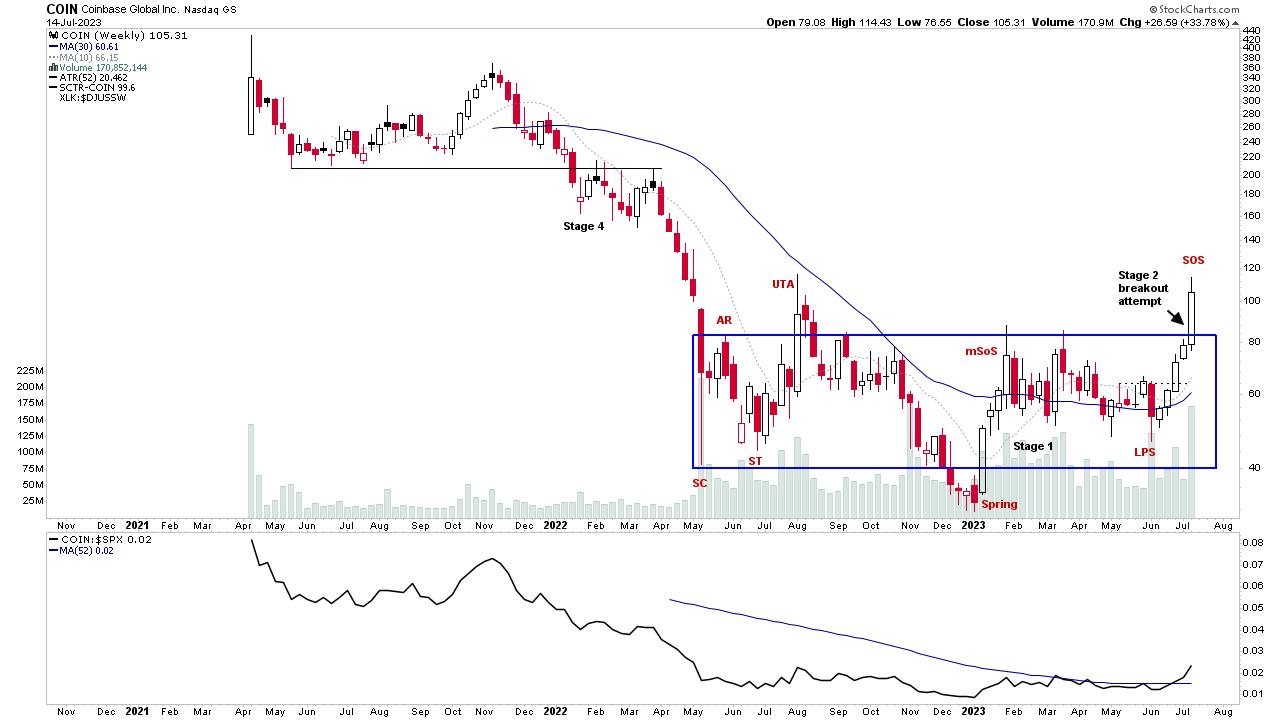
Stage Analysis members weekend video beginning with a discussion of some of the weeks strongest Stage 2 breakout attempts on volume, followed by the regular member content...
Read More

Blog
16 July, 2023
Stage Analysis Members Video – 16 July 2023 (1hr 25mins)
15 July, 2023
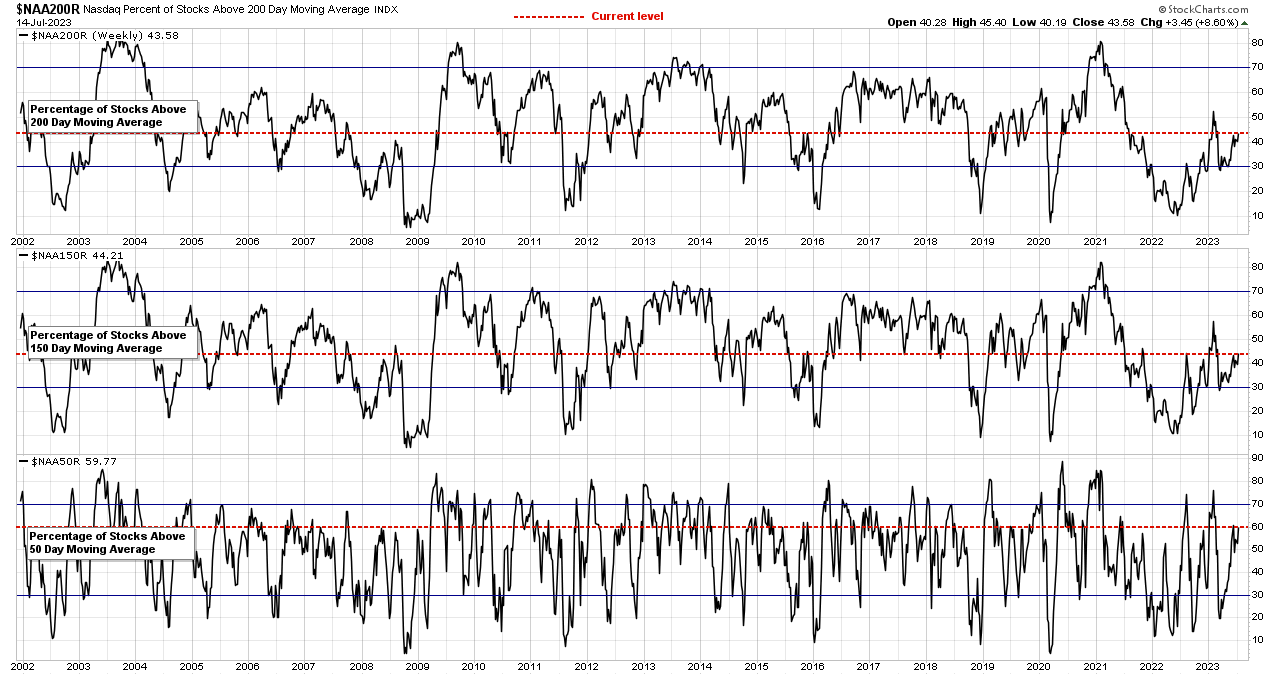
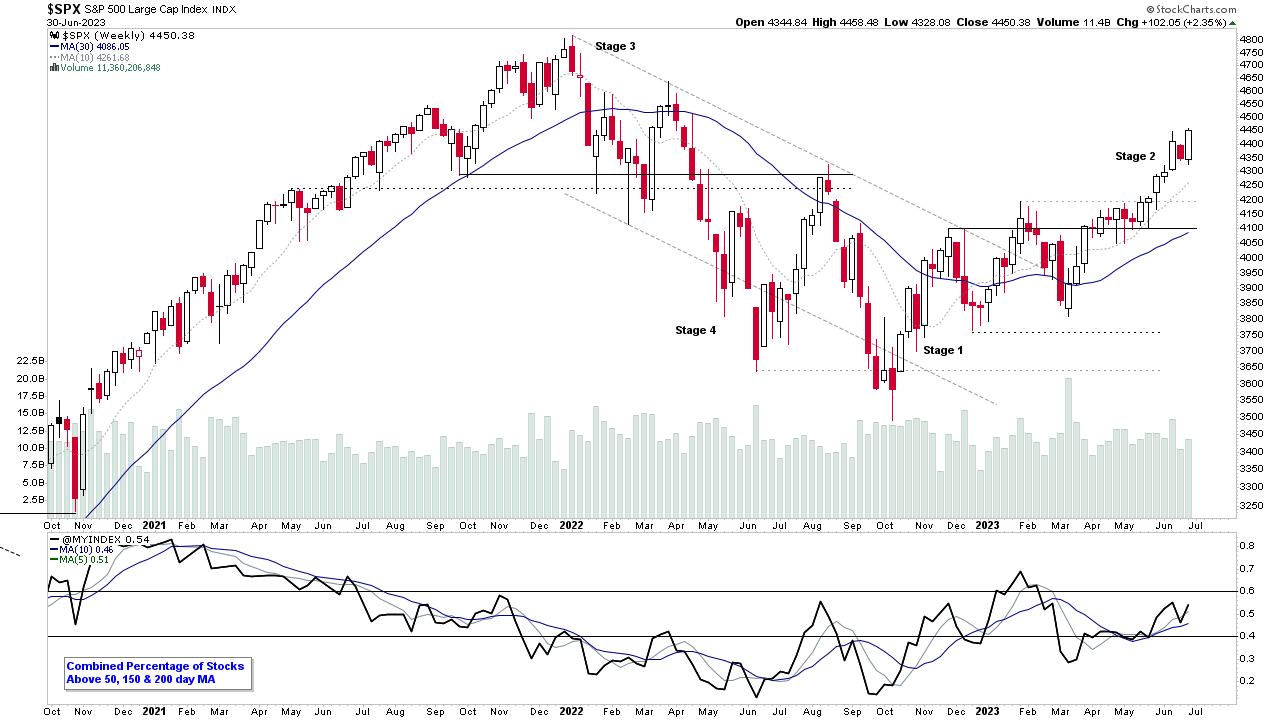
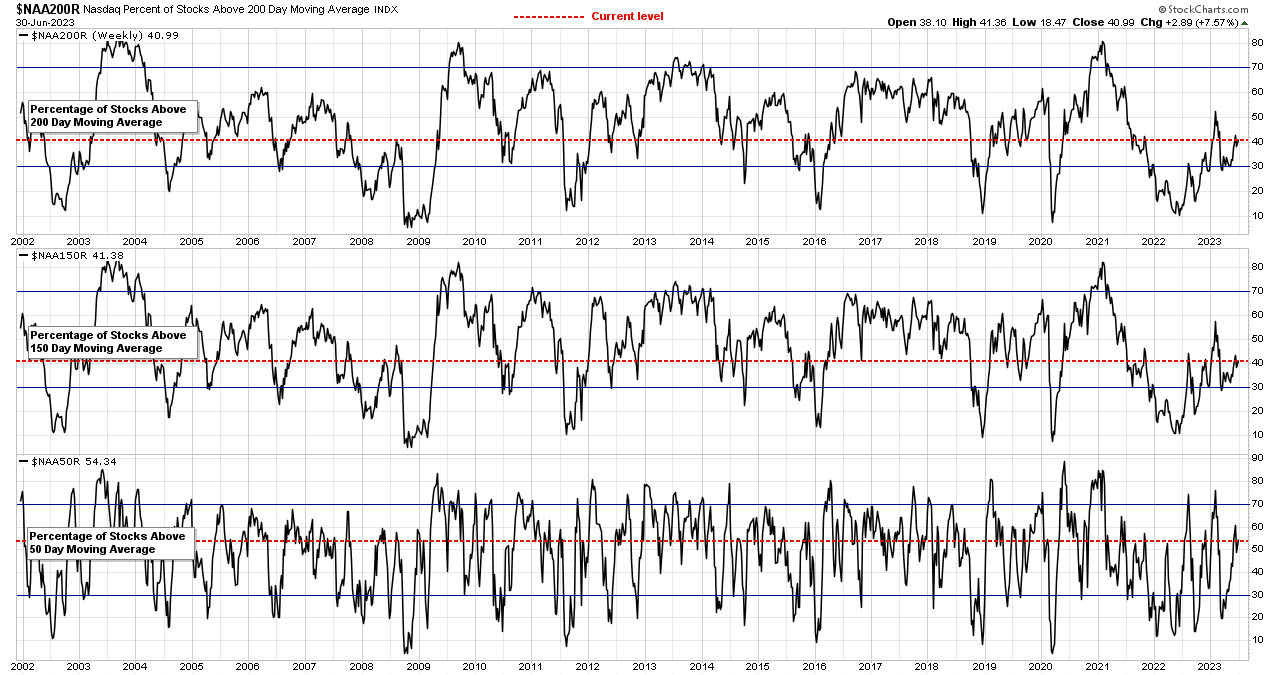
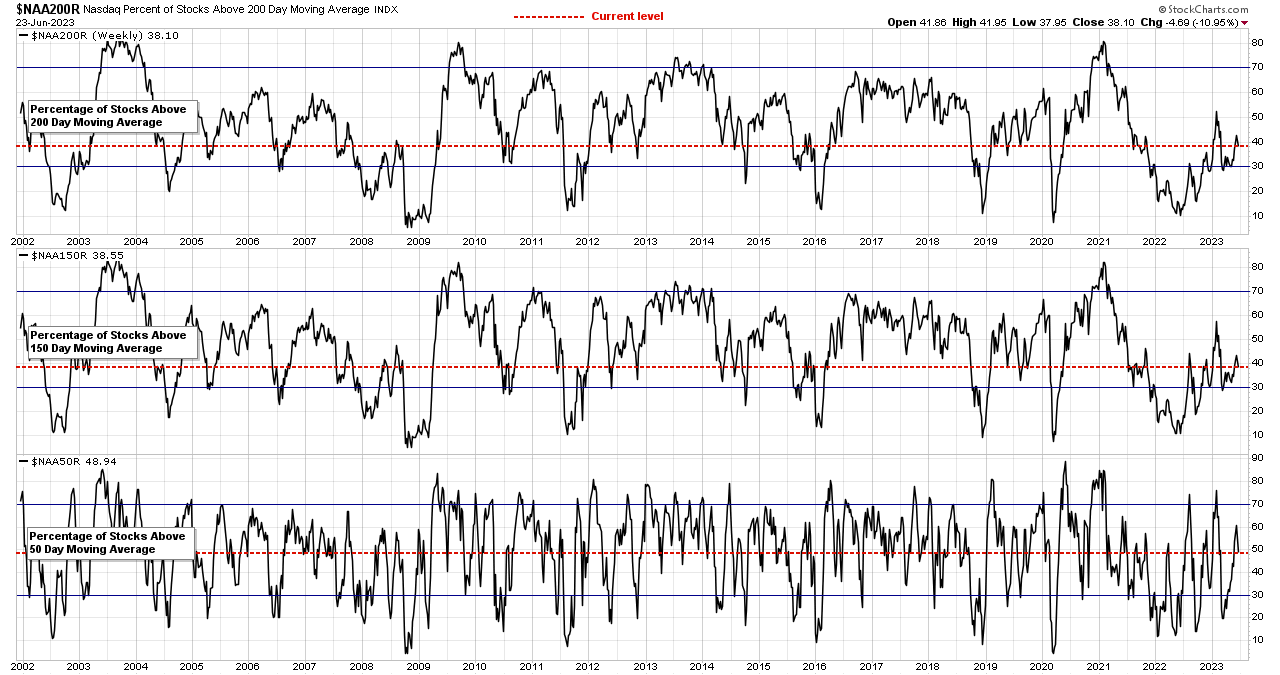
Market Breadth: Percentage of Stocks Above their 50 Day, 150 Day & 200 Day Moving Averages Combined
Custom Percentage of Stocks Above Their 50 Day, 150 Day & 200 Day Moving Averages Combined Market Breadth Charts for the Overall US Market, NYSE and Nasdaq for Market Timing and Strategy.
Read More
09 July, 2023
Stage Analysis Members Video – 9 July 2023 (1hr 28mins)
Stage Analysis members weekend video featuring the Major US Stock Market Indexes Update, Futures SATA Charts, Industry Groups RS Rankings, IBD Industry Group Bell Curve, Market Breadth Update to help to determine the weight of evidence, Stage 2 breakouts on volume, and finally the US Watchlist Stocks from the weekend scans in detail on multiple timeframes.
Read More
08 July, 2023
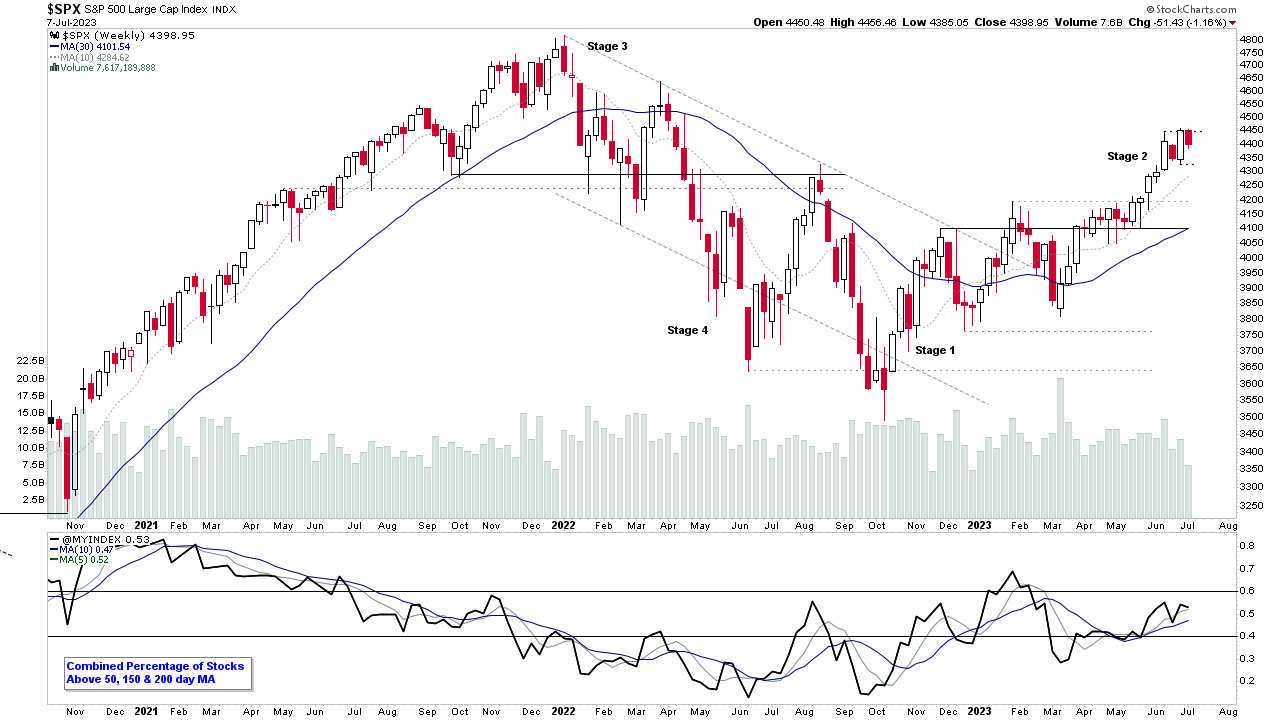
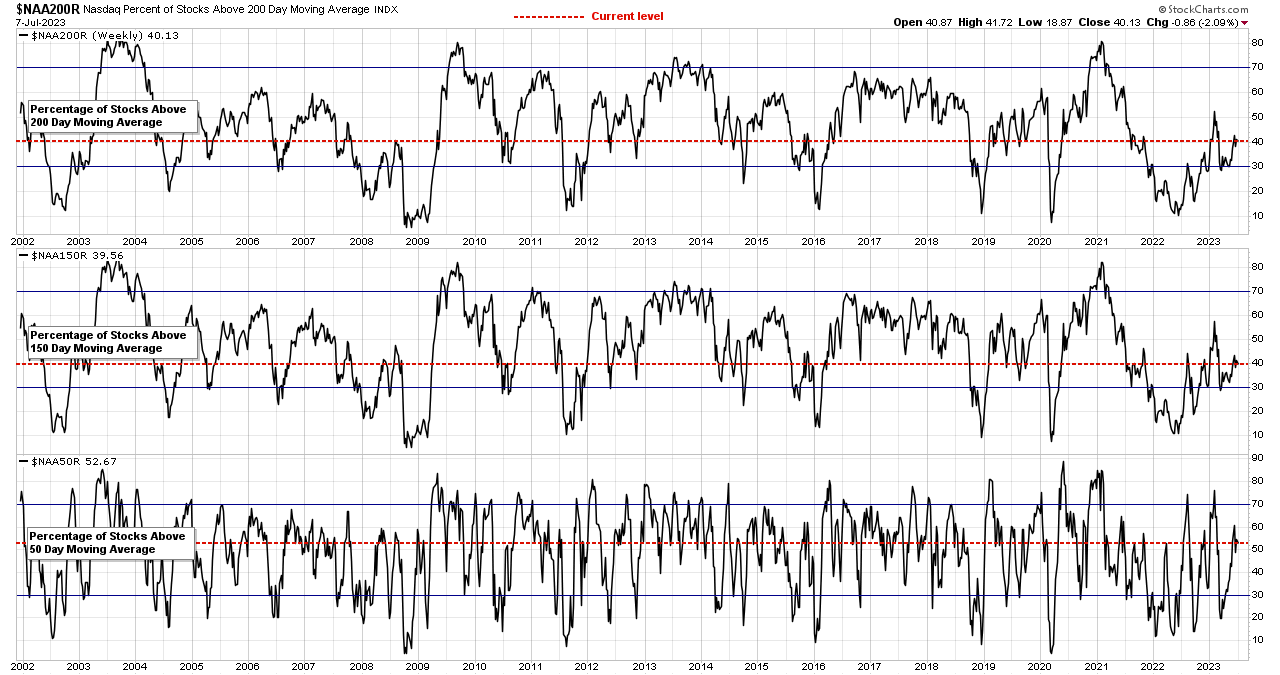
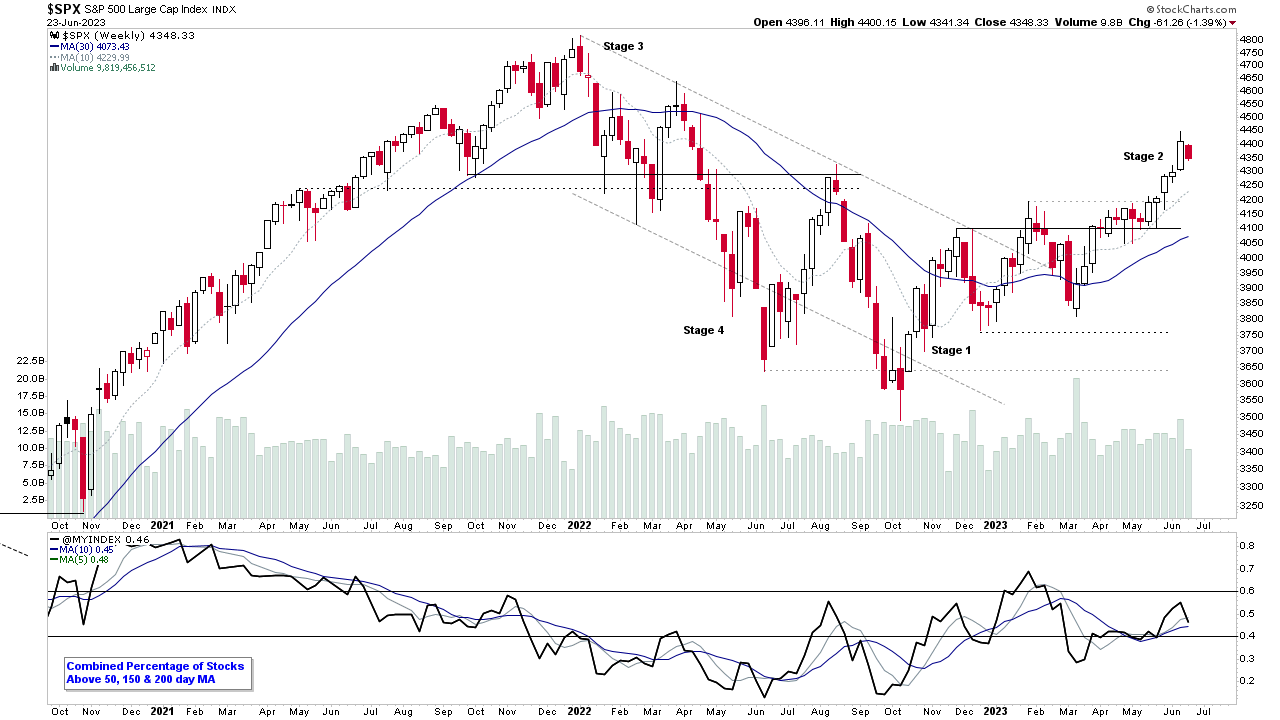
Market Breadth: Percentage of Stocks Above their 50 Day, 150 Day & 200 Day Moving Averages Combined
Custom Percentage of Stocks Above Their 50 Day, 150 Day & 200 Day Moving Averages Combined Market Breadth Charts for the Overall US Market, NYSE and Nasdaq for Market Timing and Strategy.
Read More
03 July, 2023
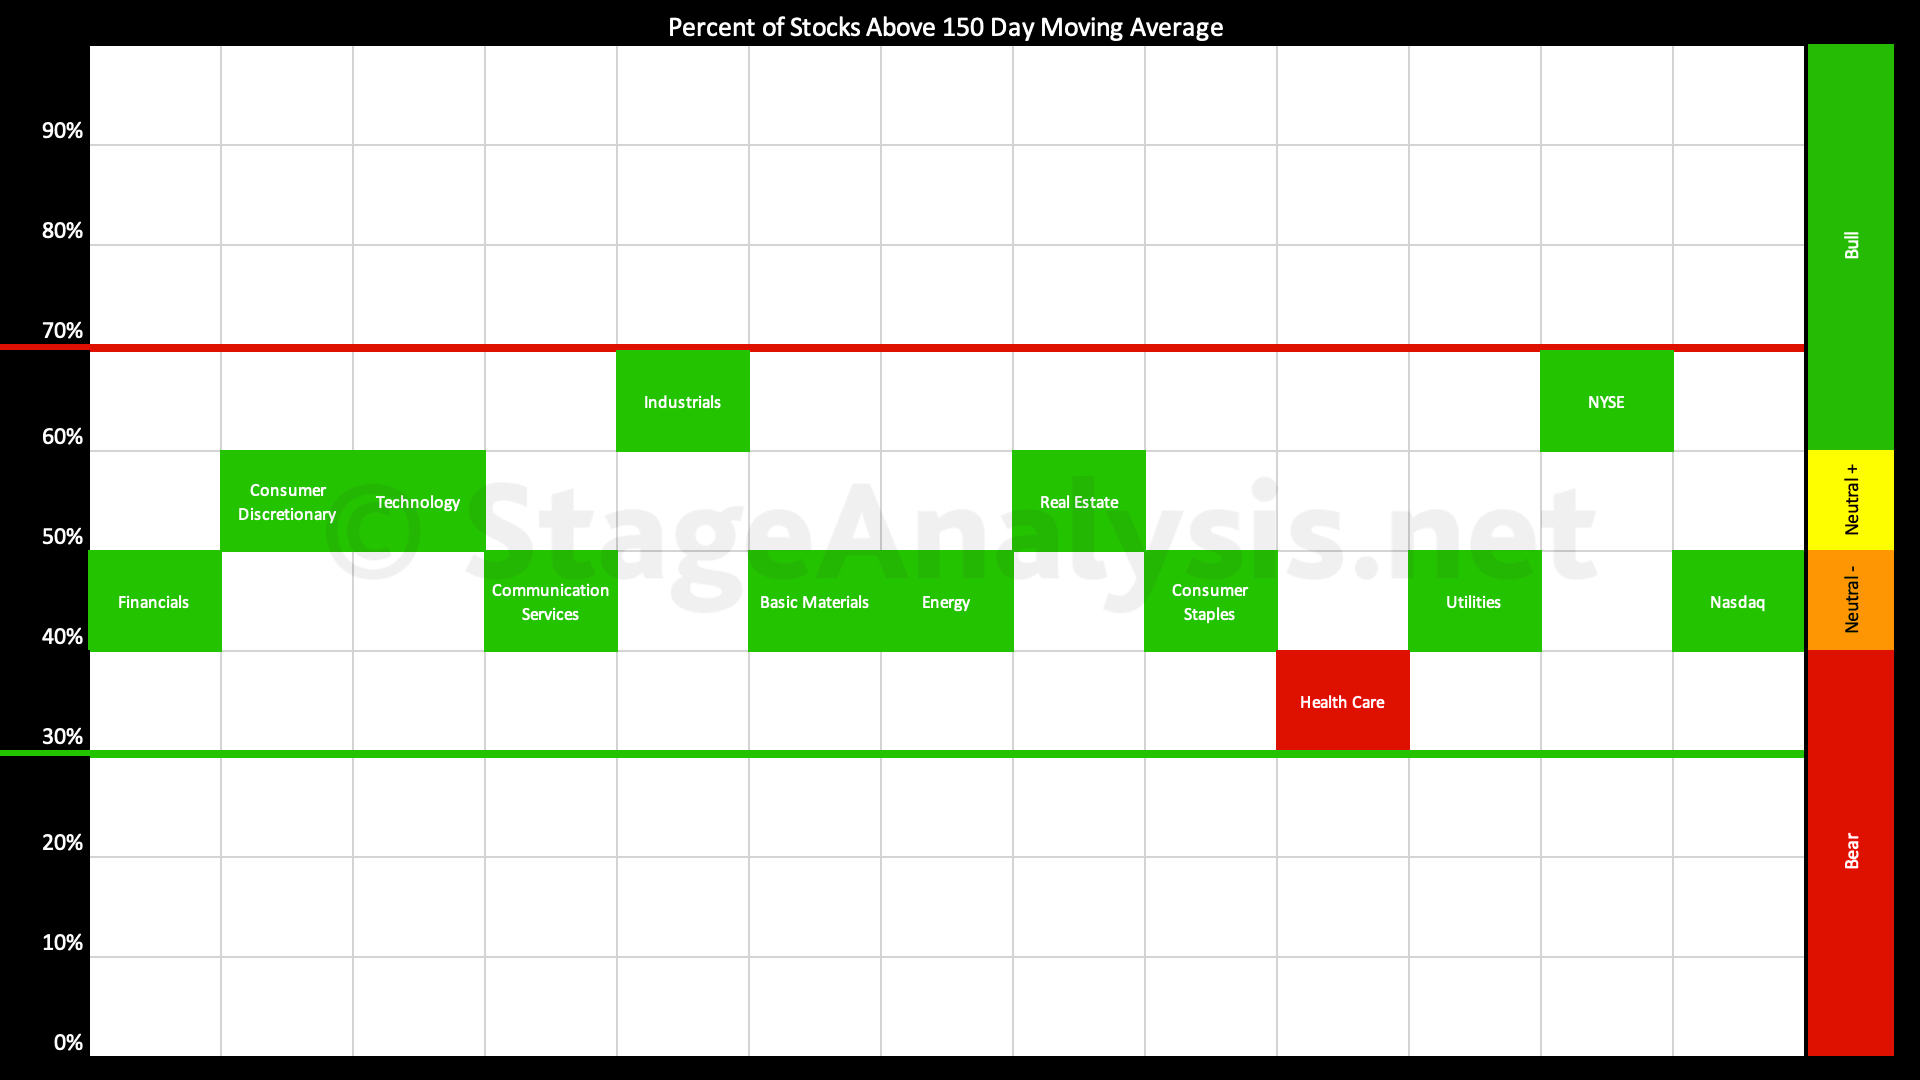
Sector Breadth: Percentage of US Stocks Above Their 150 day (30 Week) Moving Averages
The percentage of US stocks above their 150 day (30 week) moving averages in the 11 major sectors post provides a unique snapshot of the overall market health and is highlighted every few weeks in the Stage Analysis blog...
Read More
02 July, 2023
Stage Analysis Members Video – 2 July 2023 (1hr 35mins)
This weeks Stage Analysis members weekend video features discussion of the Major Indexes Update, Futures SATA Charts, Industry Groups RS Rankings, IBD Industry Group Bell Curve, Market Breadth Update to help to determine the weight of evidence, Stage 2 breakouts on volume, and finally the US Watchlist Stocks from the weekend scans in detail on multiple timeframes.
Read More
01 July, 2023
Market Breadth: Percentage of Stocks Above their 50 Day, 150 Day & 200 Day Moving Averages Combined
Custom Percentage of Stocks Above Their 50 Day, 150 Day & 200 Day Moving Averages Combined Market Breadth Charts for the Overall US Market, NYSE and Nasdaq for Market Timing and Strategy.
Read More
25 June, 2023
Stage Analysis Members Video – 25 June 2023 (1hr 24mins)
Stage Analysis weekend video discussing the Major Indexes Update, Futures SATA Charts, Industry Groups RS Rankings, IBD Industry Group Bell Curve, Market Breadth Update to help to determine the weight of evidence, and finally the US Watchlist Stocks from the weekend scans in detail on multiple timeframes.
Read More
24 June, 2023
Market Breadth: Percentage of Stocks Above their 50 Day, 150 Day & 200 Day Moving Averages Combined
Custom Percentage of Stocks Above Their 50 Day, 150 Day & 200 Day Moving Averages Combined Market Breadth Charts for the Overall US Market, NYSE and Nasdaq for Market Timing and Strategy.
Read More
19 June, 2023
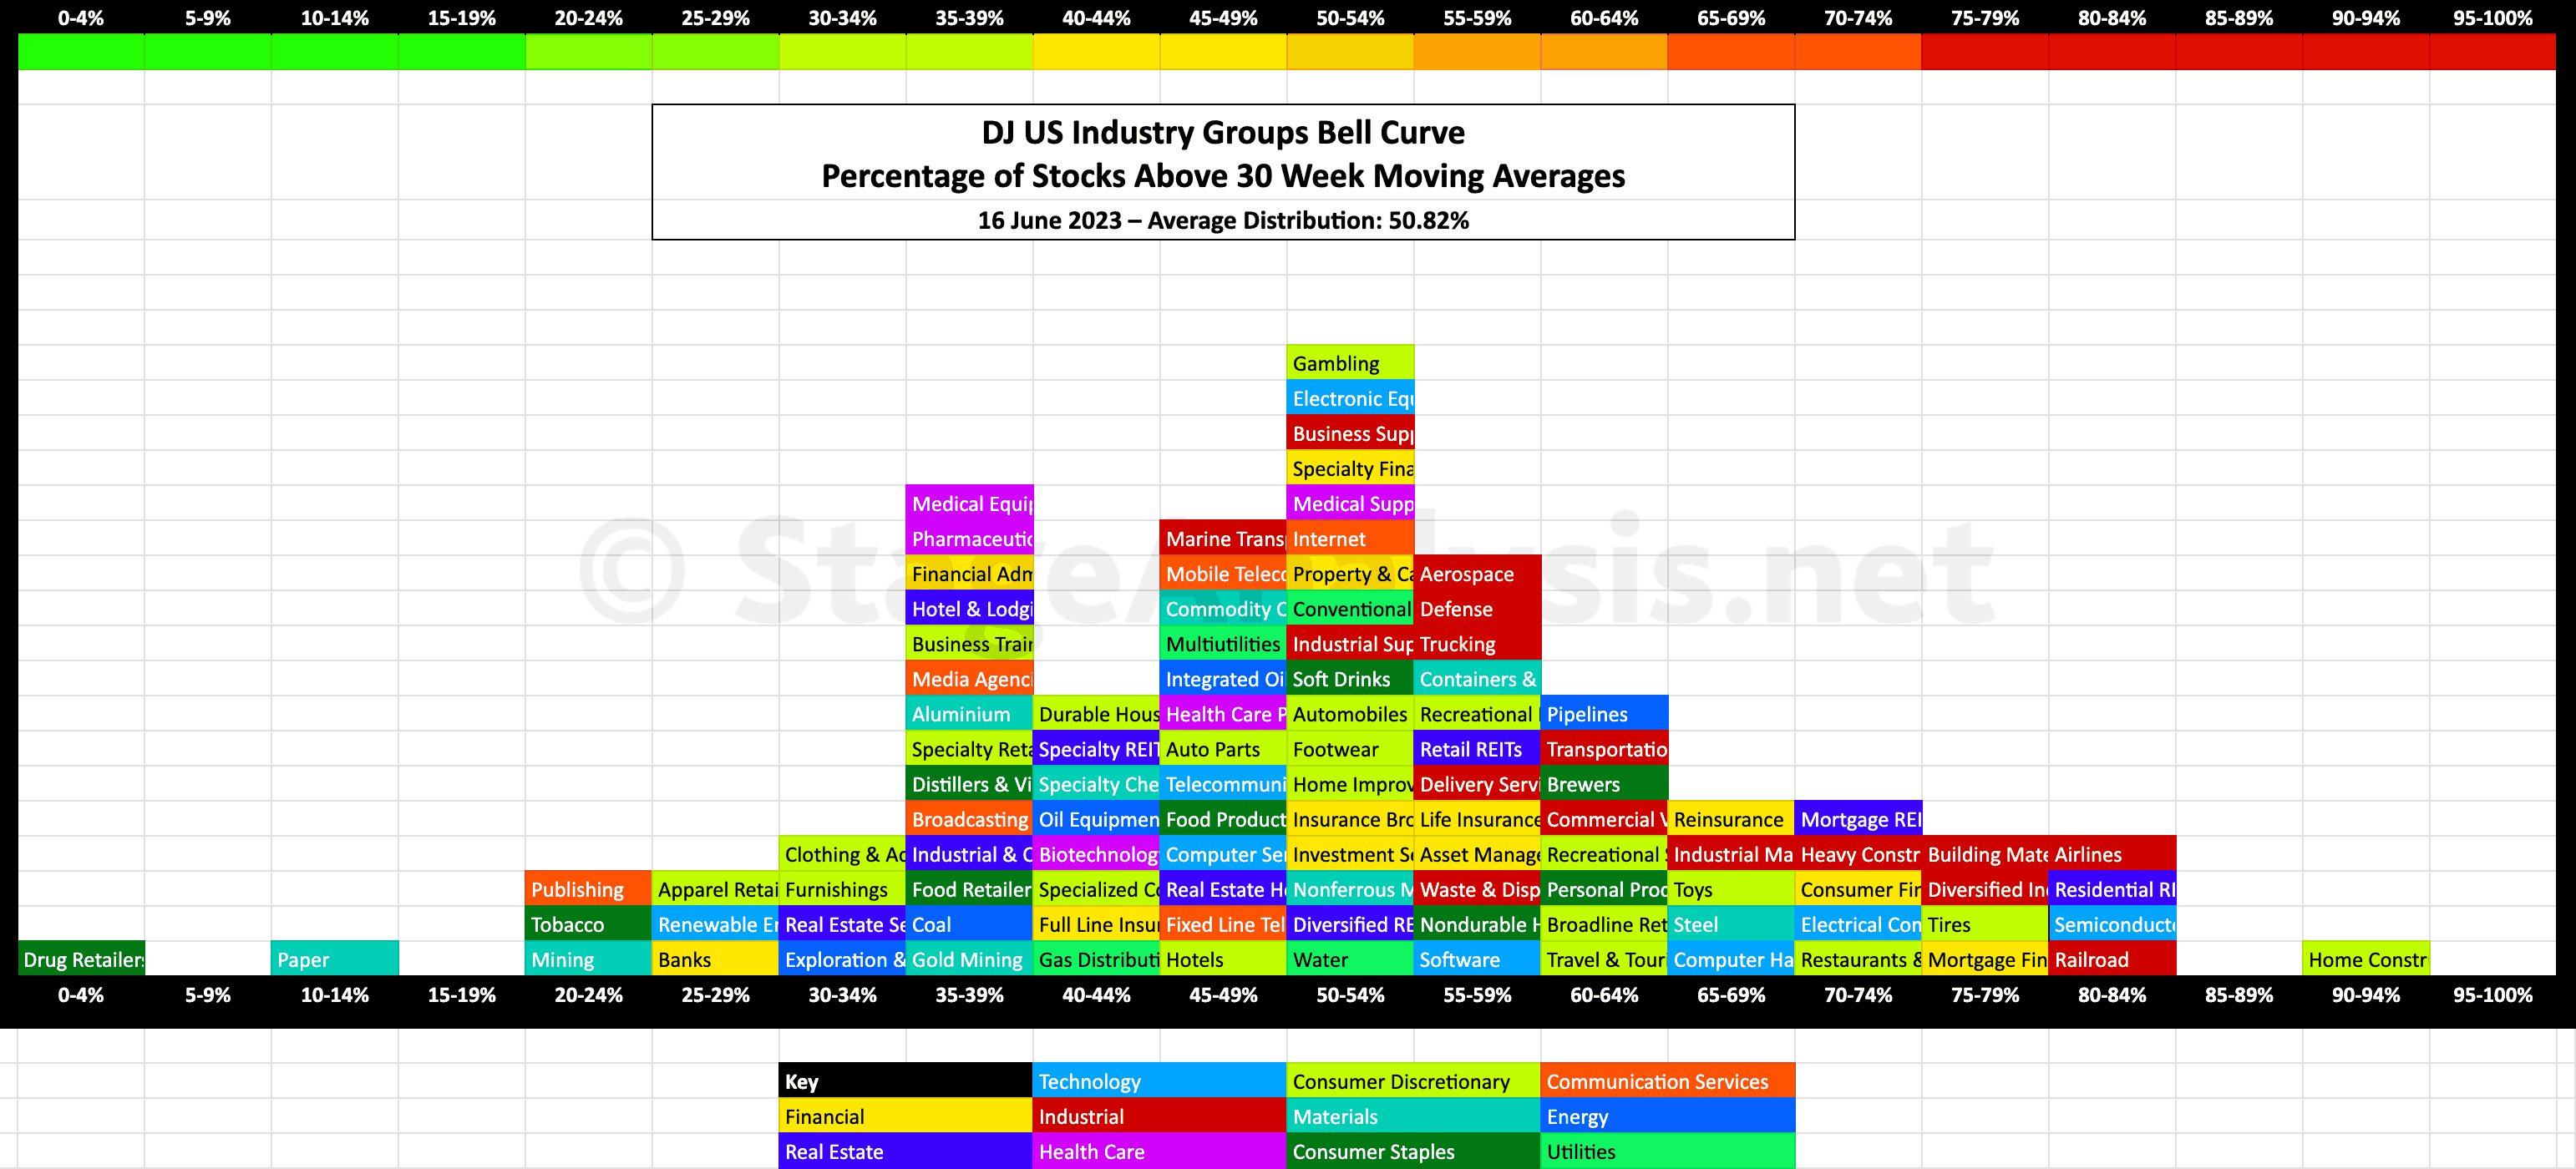
US Industry Groups Bell Curve – Exclusive to StageAnalysis.net
Exclusive graphic of the 104 Dow Jones Industry Groups showing the Percentage of Stocks Above 30 week MA in each group visualised as a Bell Curve chart...
Read More