
Market Breadth: Percentage of Stocks Above their 50 Day, 150 Day & 200 Day Moving Averages Combined
The full post is available to view by members only. For immediate access:
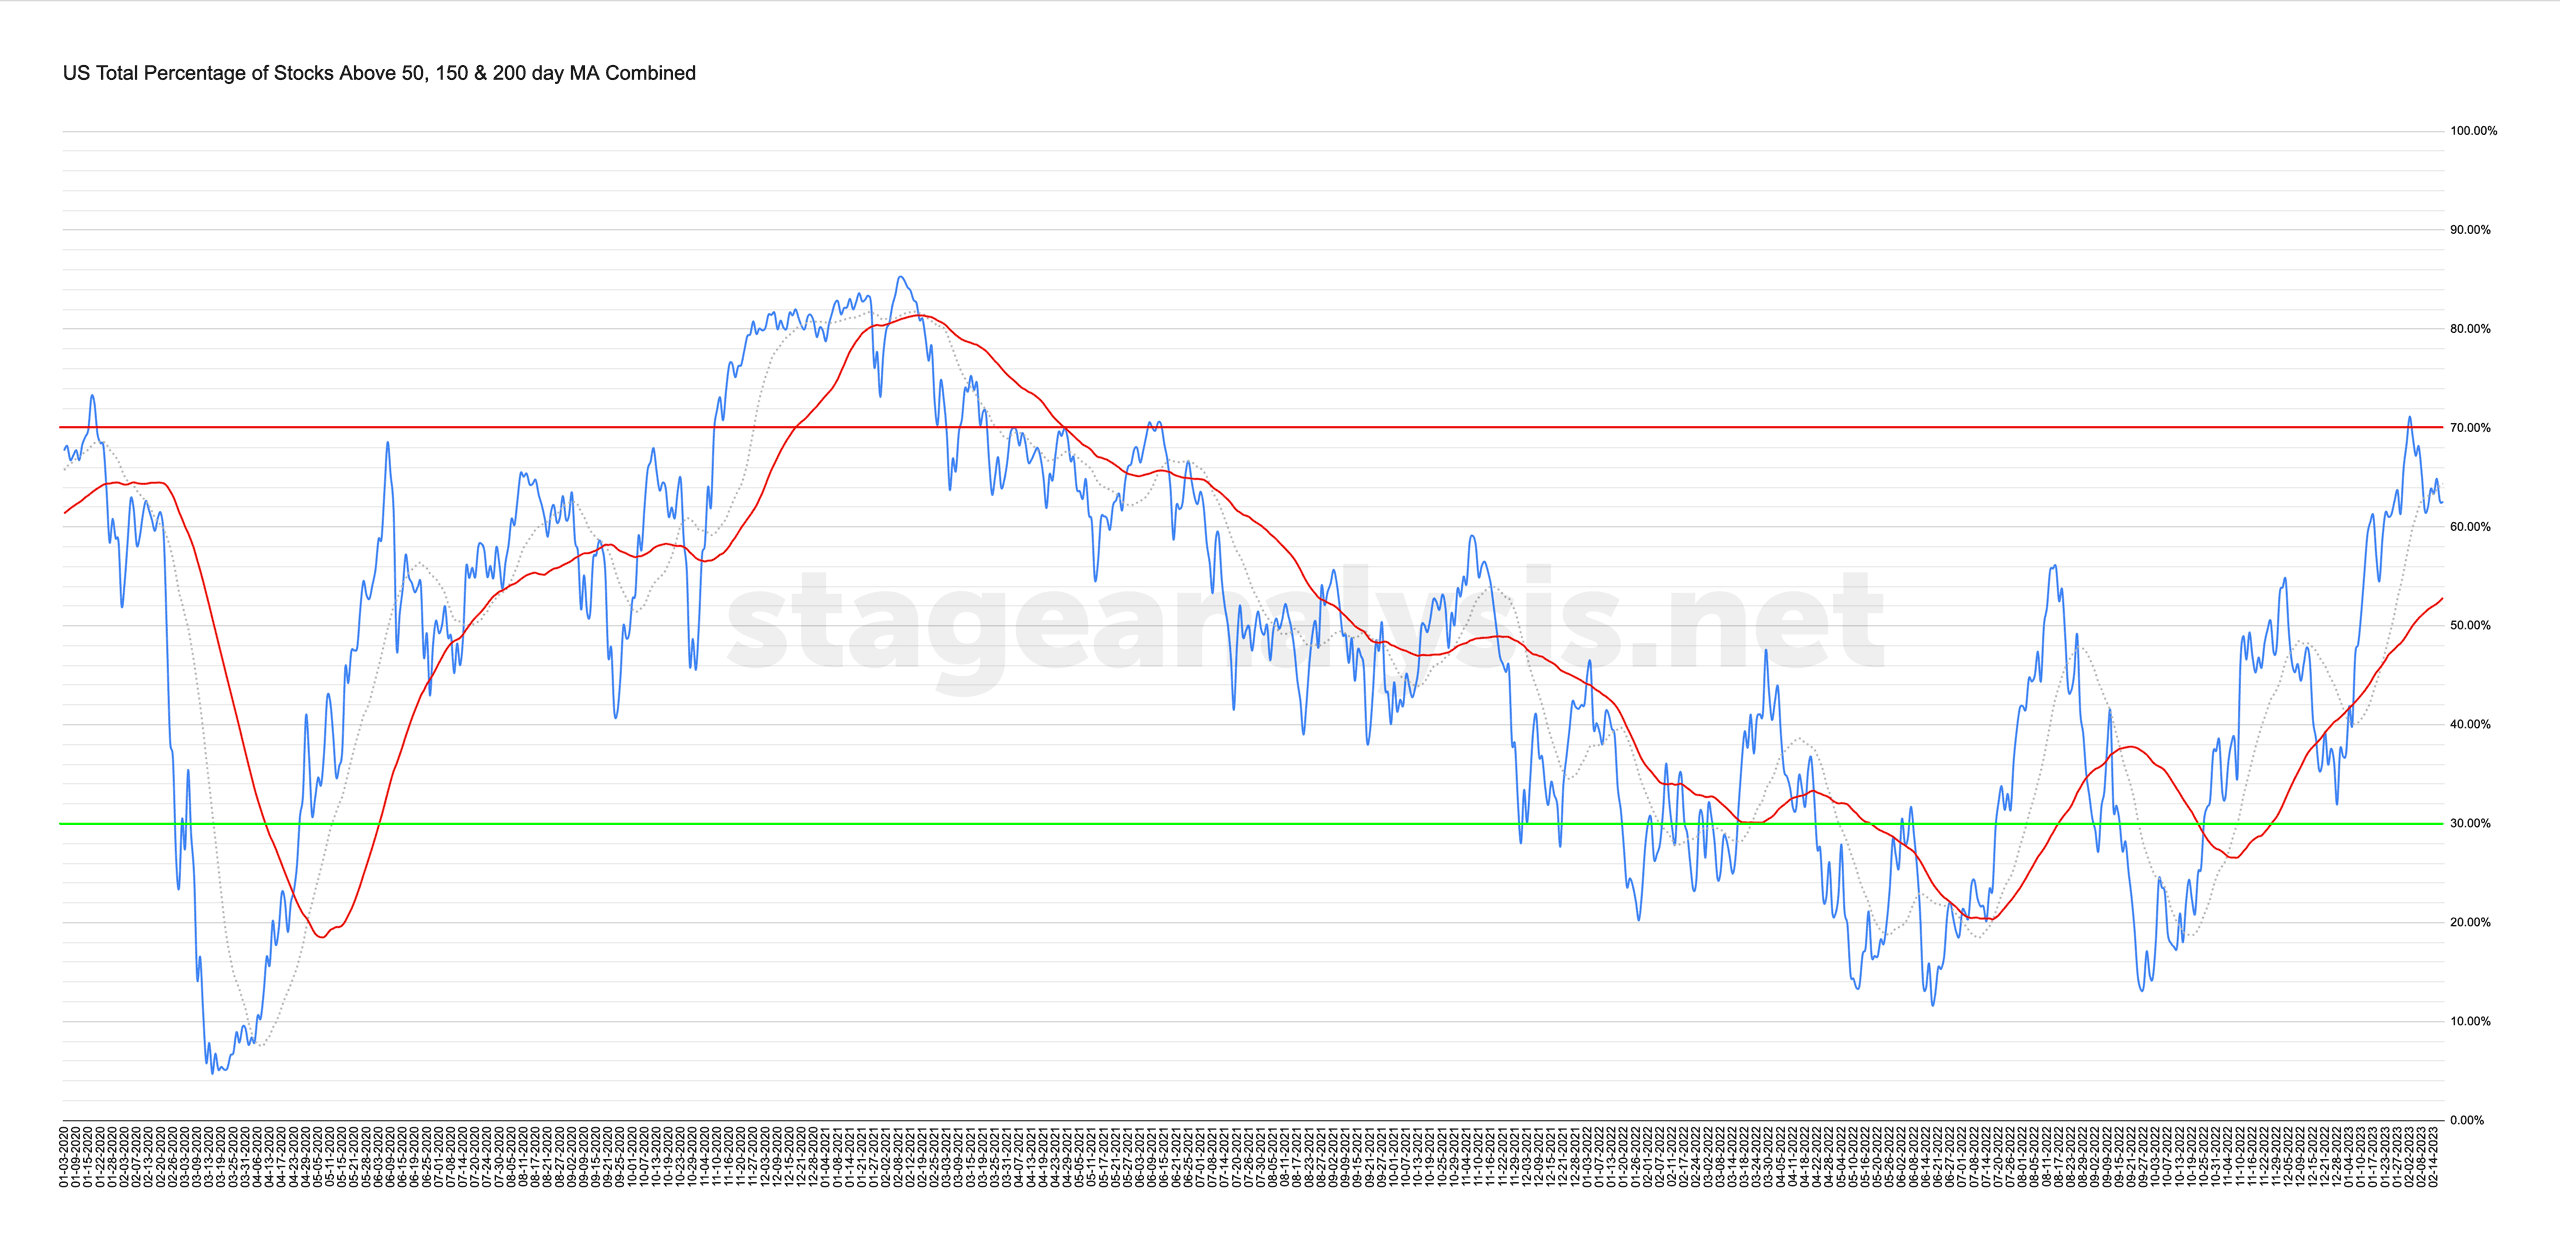
62.58% (+0.65% 1wk)
Status: Neutral Environment – Stage 2 zone
The US Total Percentage of Stocks above their 50 Day, 150 Day & 200 Day Moving Averages (shown above) consolidated this week, finishing with a +0.65% gain.
The overall combined average now stands at 62.58% in the US market (NYSE and Nasdaq markets combined) above their short, medium and long term moving averages, which puts it at +9.75% above its own 50 day MA signal line, but it remains below the still rising 20 day MA by -1.80% and thus the status remains as a Neutral Environment (as its between the MAs) in the Stage 2 zone (above 60%) currently.
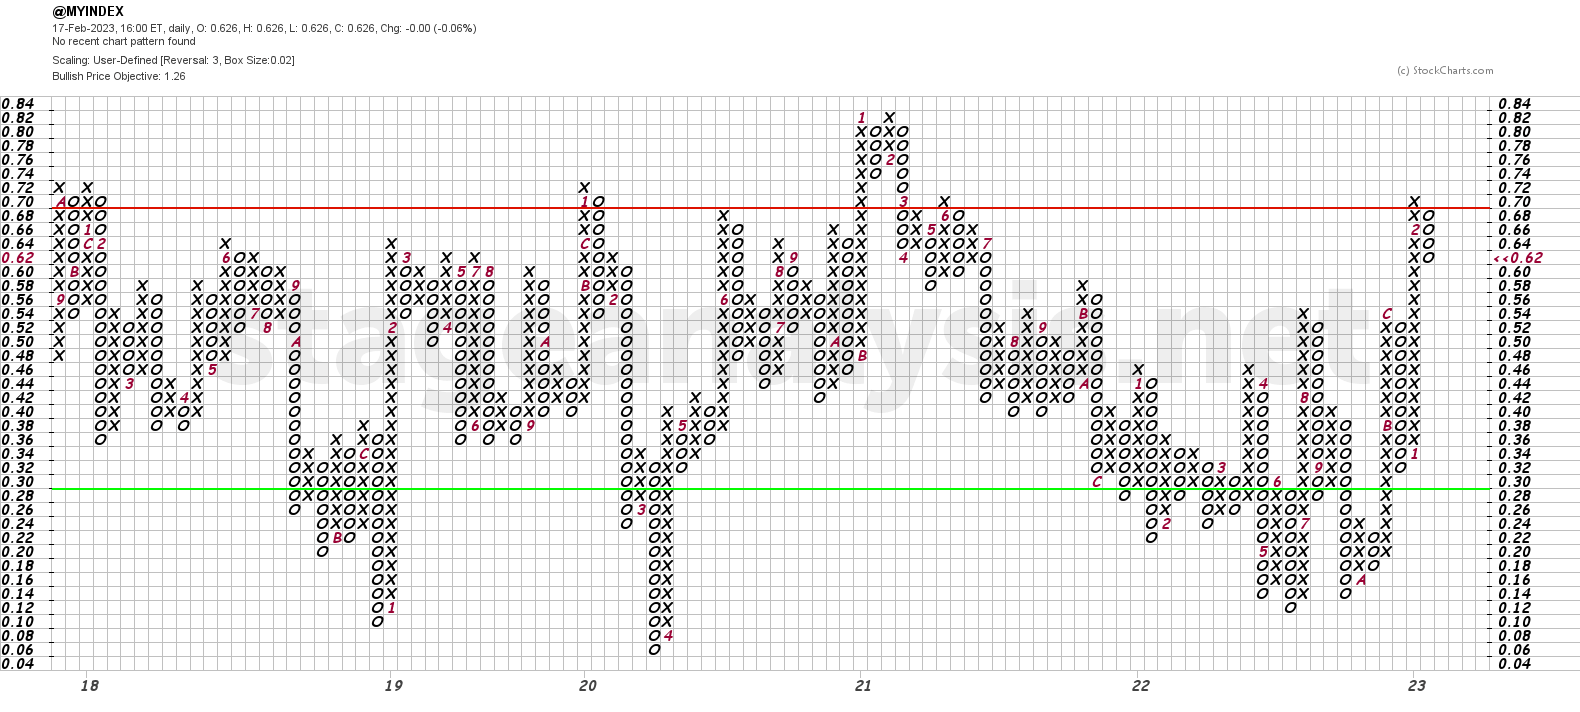
The Point and Figure (P&F) chart (shown above), had no change this week and so remains in a column of Os and hence the strategy remains on Defense, with the P&F status on Bull Correction status or possibly Bear Alert status as the column of Xs did move one box above the key 70% level, but either way they both have similar meanings, which is that the breadth is pulling back, but the bear alert indicates that it's from a higher level and hence risk is higher.
Become a Stage Analysis Member:
To see more like this – US Stocks watchlist posts, detailed videos each weekend, use our unique Stage Analysis tools, such as the US Stocks & ETFs Screener, Charts, Market Breadth, Group Relative Strength and more...
Join Today
Disclaimer: For educational purpose only. Not investment advice. Seek professional advice from a financial advisor before making any investing decisions.