
Sector Breadth: Percentage of US Stocks Above Their 150 day (30 Week) Moving Averages
The full post is available to view by members only. For immediate access:
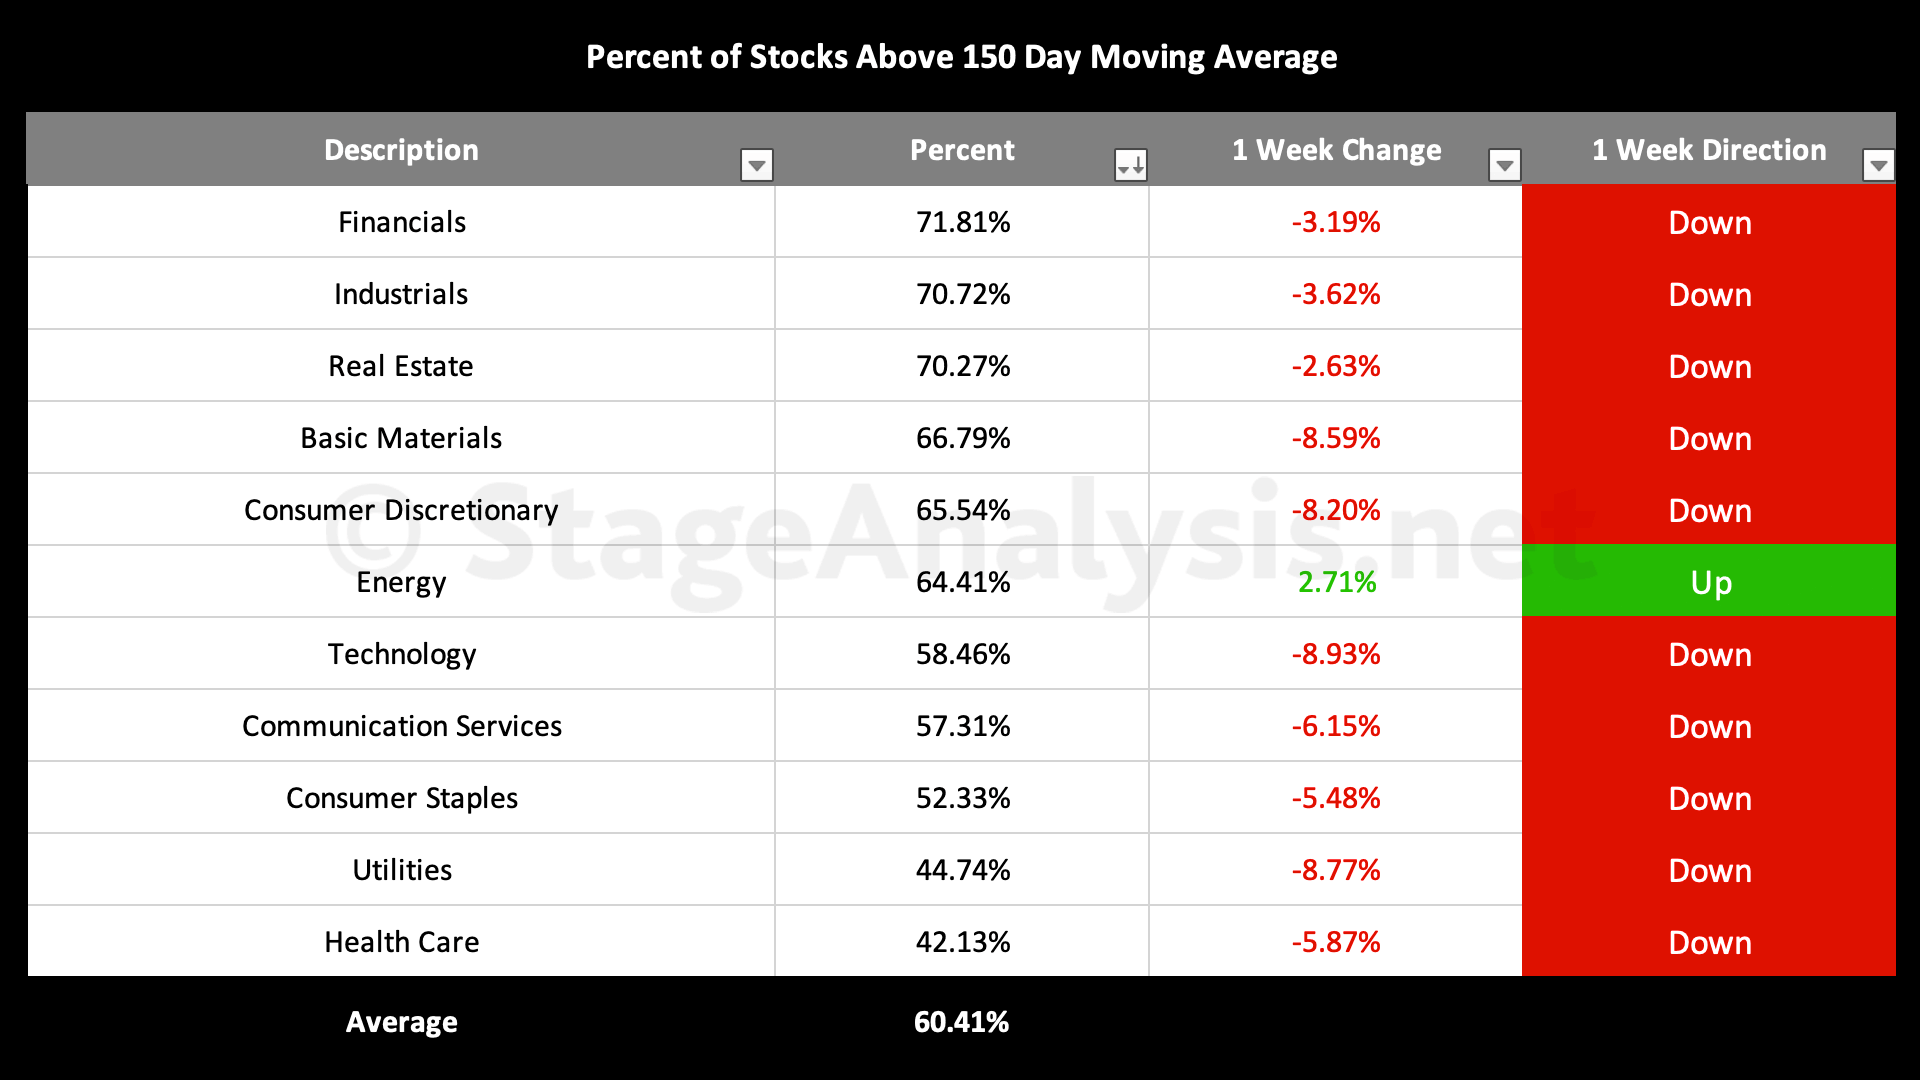
Average: 60.41% (+1.94% 3wks)
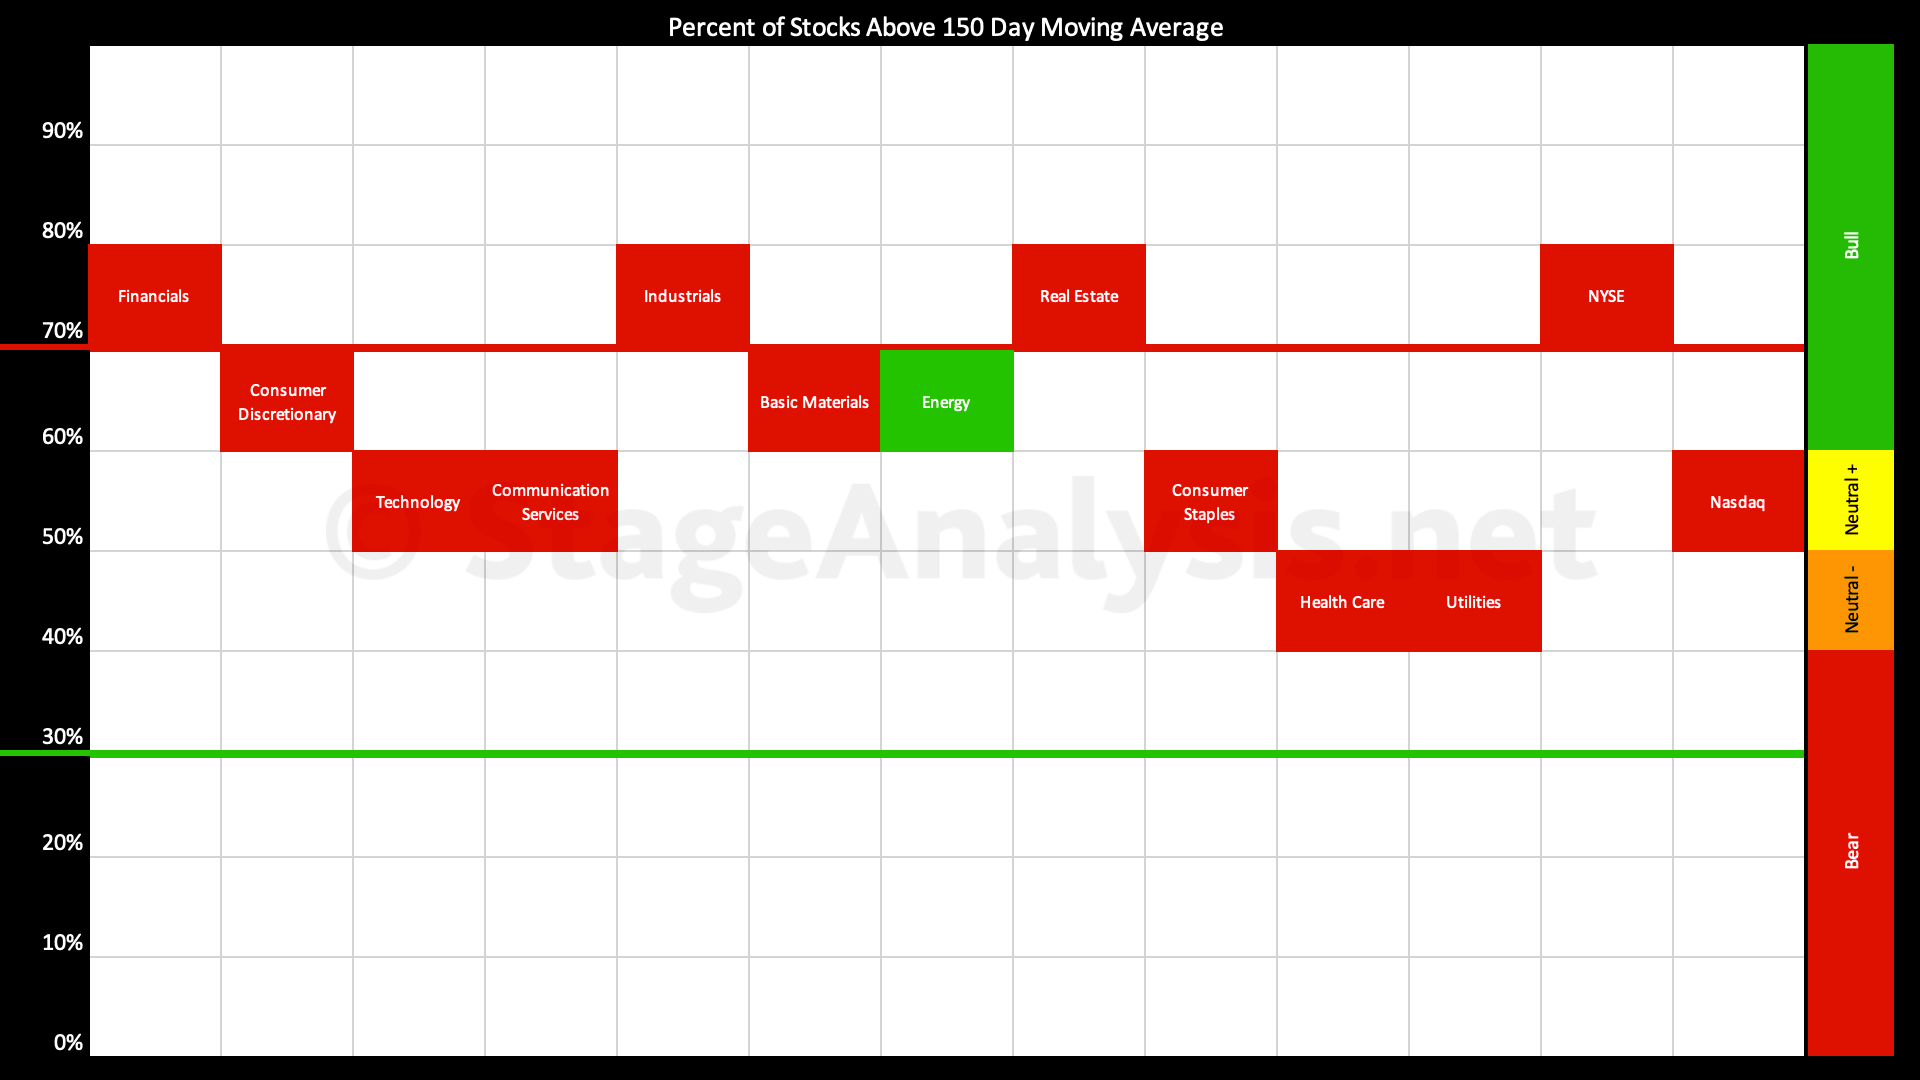
- 6 sectors in the Stage 2 zone (Financials, Industrials, Real Estate, Basic Materials, Consumer Discretionary, Energy)
- 5 sectors in Stage 1 / 3 zone (Technology, Communication Services, Consumer Staples, Utilities, Health Care)
- 0 sectors in Stage 4 zone
The Percentage of US Stocks Above Their 150 day Moving Averages in the 11 major sectors edge higher over the last three weeks since the previous post of the 23rd January 2023, increasing by a further +1.94% to 60.41% overall, which puts it just in the Stage 2 zone, but very tentatively so.
Sector changes: The sectors in the Stage 2 zone (Above 60%) has increased from 5 to 6. The sectors in the Stage 1 / 3 zone (40% to 60% range) has decreased by 1 to 5, and the number of sectors in the Stage 4 zone (Below 40%) remains at zero.
The table below shows the weekly change, which was mostly negative last week, with only the Energy sector gaining, but it also shows that the overall average did move more significantly above the 60% level into the Stage 2 zone, as it reached 65.75% in the prior week. So further improvement is needed to move into the Stage 2 zone more convincingly.
Sector Breadth Table – Ordered by Relative Strength
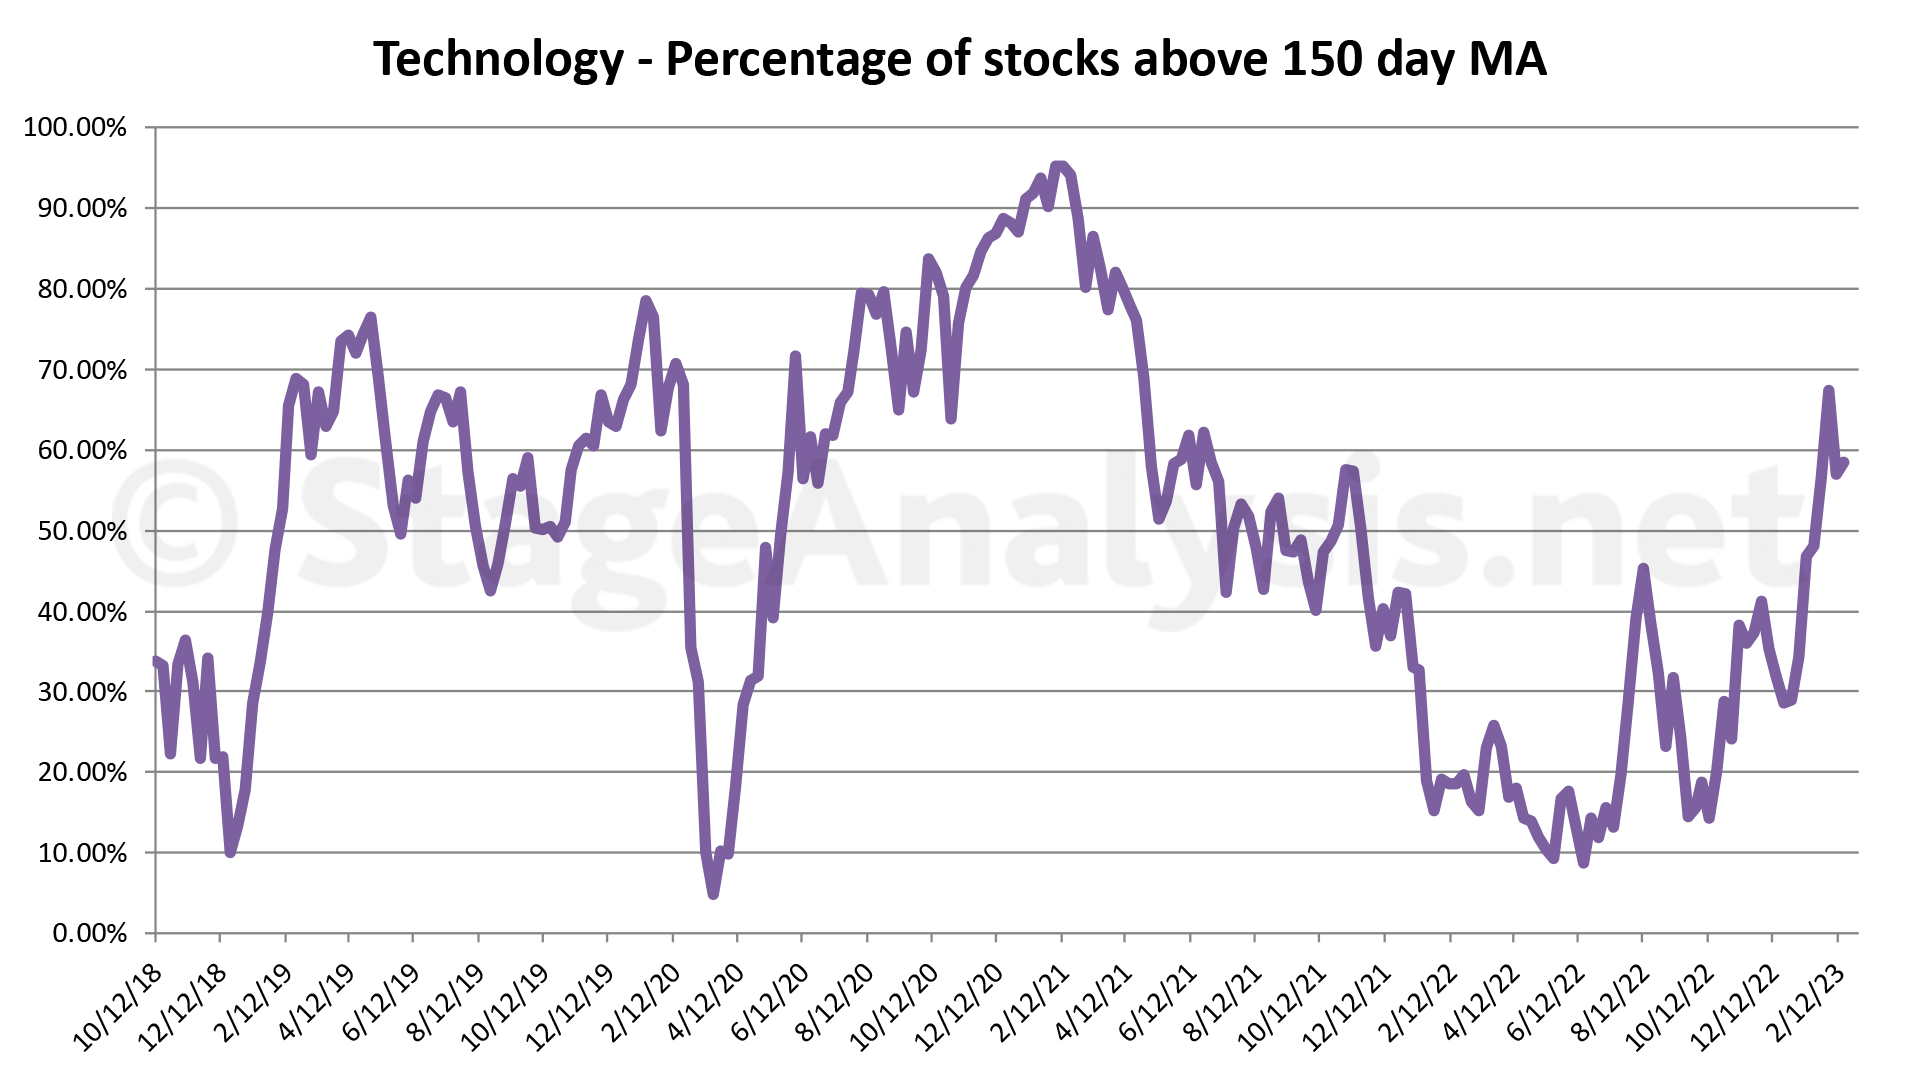
Sector Breadth Charts (Members Only)
Below is the charts for the 11 sectors that shows back to late 2018. Which gives a very clear picture of the overall health of each sector and the market as a whole. (Technology chart shown as an example)
Become a Stage Analysis Member:
To see more like this – US Stocks watchlist posts, detailed videos each weekend, use our unique Stage Analysis tools, such as the US Stocks & ETFs Screener, Charts, Market Breadth, Group Relative Strength and more...
Join Today
Disclaimer: For educational purpose only. Not investment advice. Seek professional advice from a financial advisor before making any investing decisions.