
Russell 2000 Small Cap ETF Attempting to Make a Stage 2 Breakout and Small Caps Stocks Watchlist – 31 January 2023
The full post is available to view by members only. For immediate access:
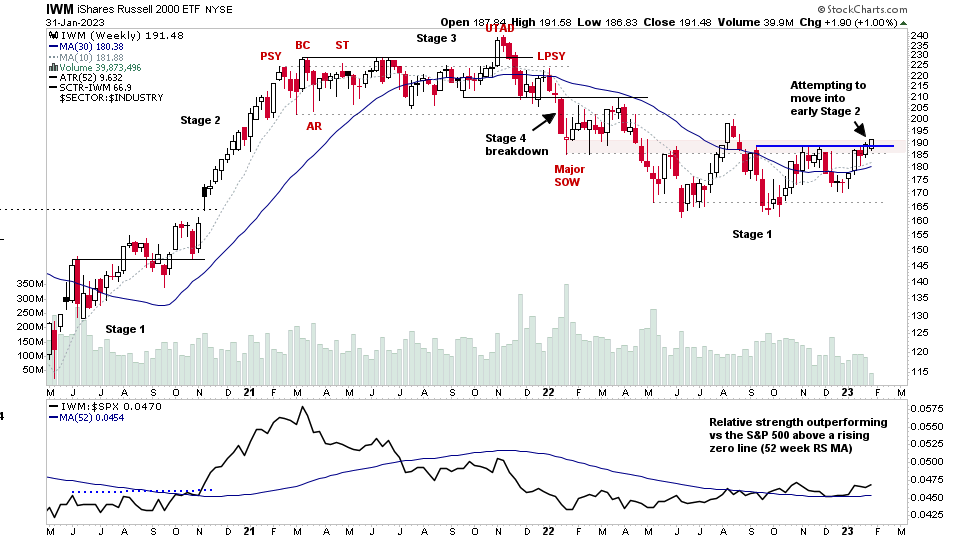
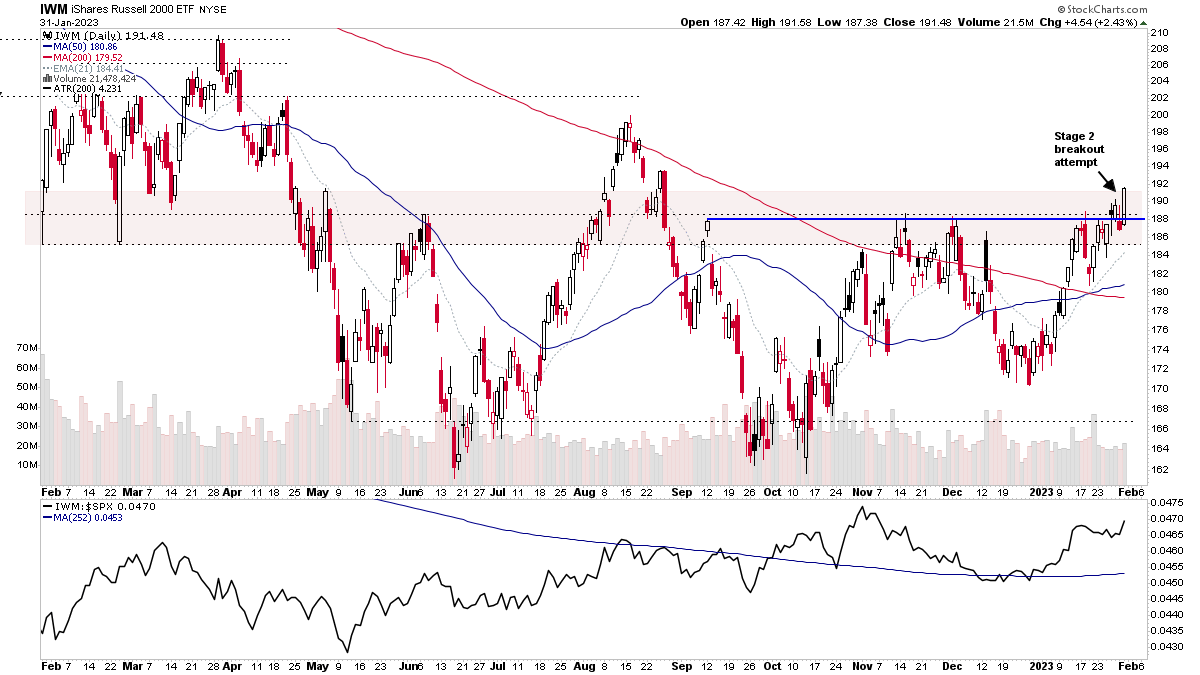
Todays post is a special feature looking at the Small Caps, as ahead of the FOMC on Wednesday, the Russell 2000 Small Caps ETF (IWM) is attempting to breakout into early Stage 2 (see above weekly and daily charts). Hence, with Stage Analysis its the perfect time to drill down into this area of the market, looking at the Small Cap sector Relative Strength, leading Small Cap stocks already in early Stage 2 or testing their Stage 2 level, and some of the market breadth stats from the group to get a broader picture of their internal health.
The FOMC may cause the Stage 2 breakout attempt in the Russell 2000 to fail. Which has been the trend of the prior meetings through the 2022 Stage 4 declining phase and Stage 1 basing phase. However, if there's a change of behaviour and the rally attempt holds, and can close the week strongly, then it would be time drill down into the Small Caps and focus in on potential leaders and group themes.
Small Cap Sector ETFs
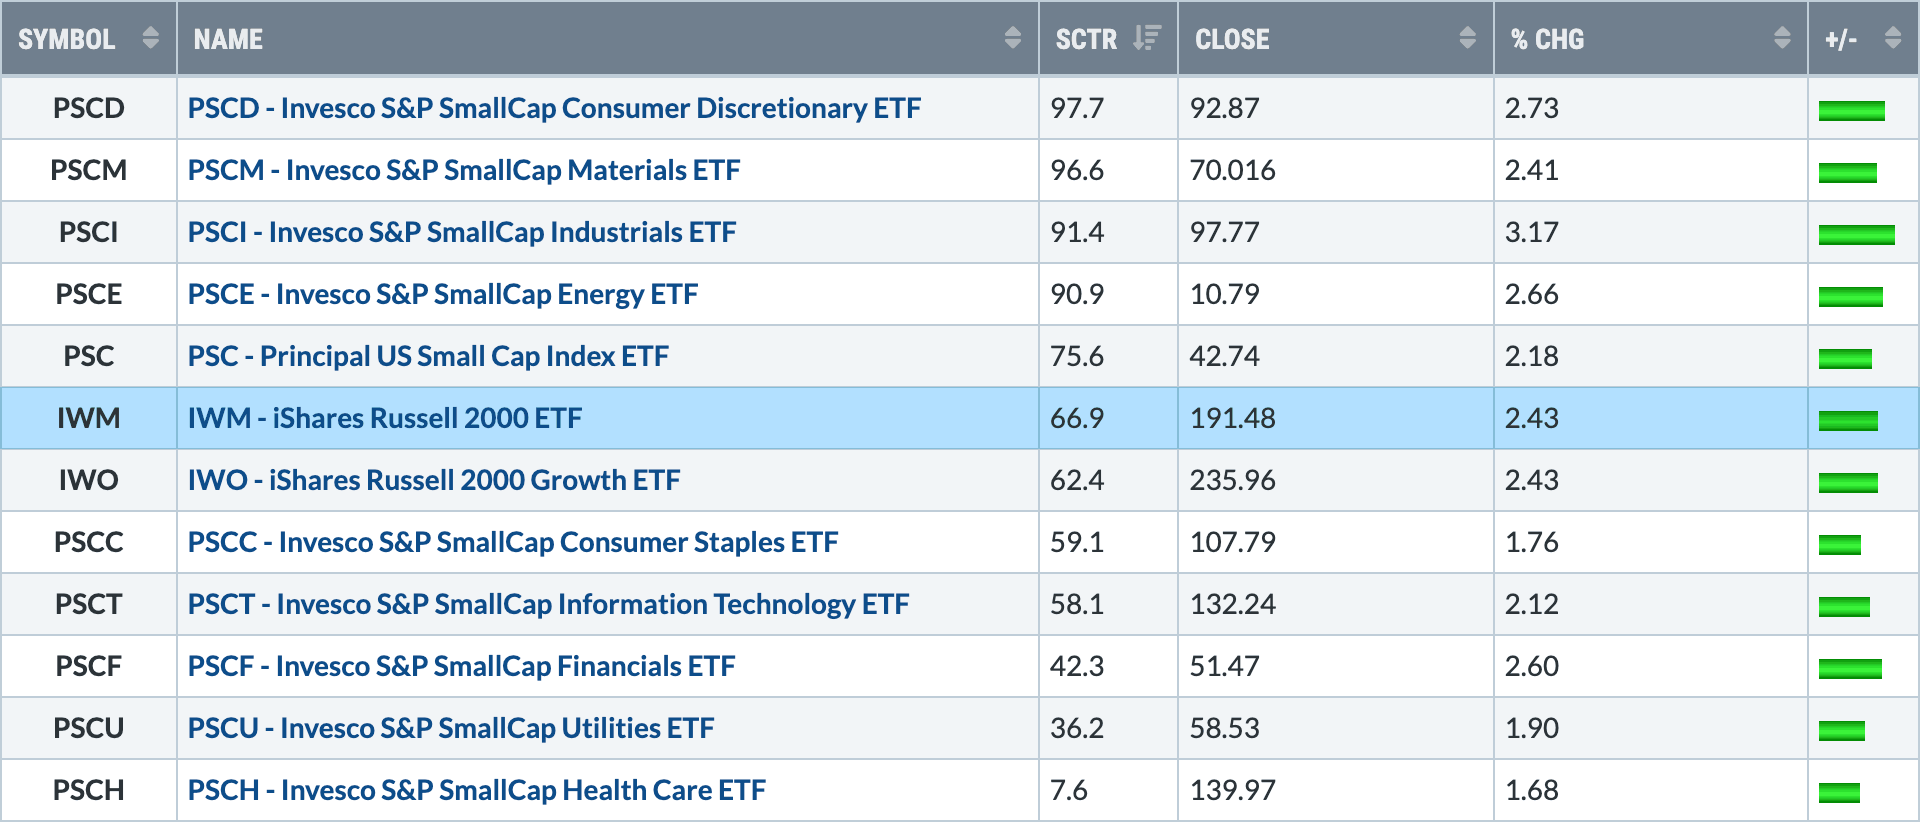
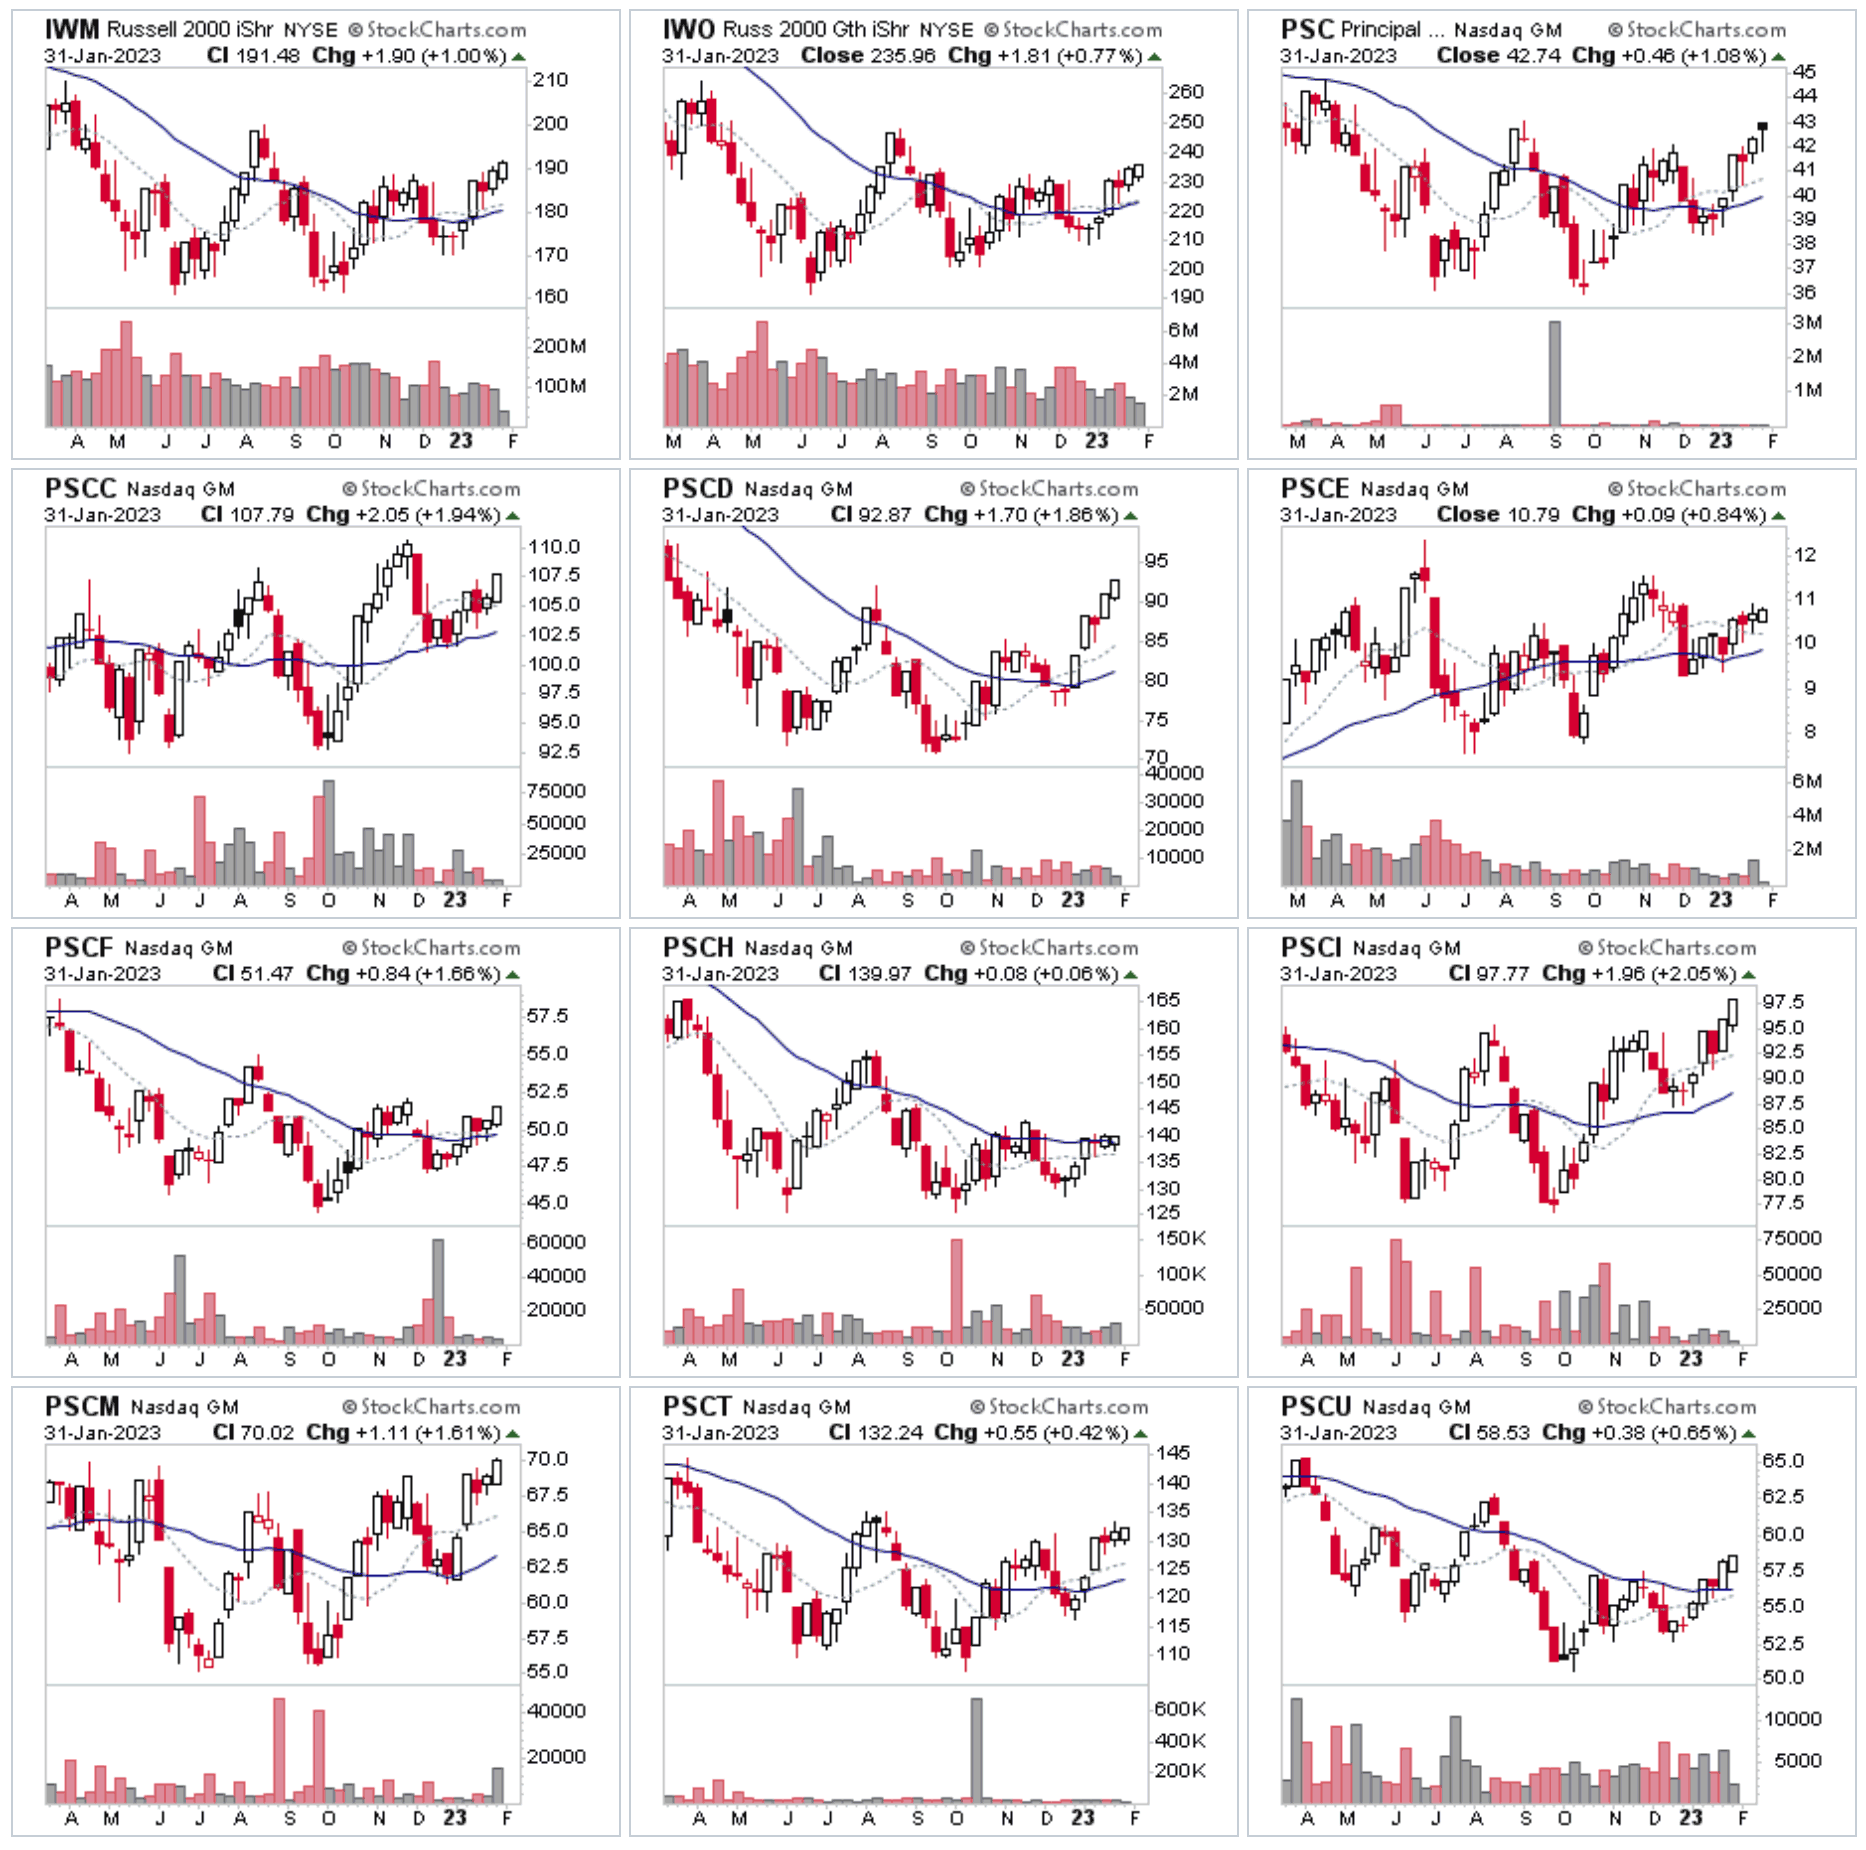
The below table shows the Invesco S&P SmallCap Sector ETF in order of Relative Strength (RS). Those above the IWM Russell 2000 ETF are outperforming. i.e. PSCD - Invesco S&P SmallCap Consumer Discretionary ETF has the strongest RS of the small cap ETFs.
Small Cap Stocks Watchlist – Early Stage 2 (Members only)
Below are 46 small cap stocks with strong RS in early Stage 2 or testing the Stage 2 level with some of the characteristics that the SA method looks for. Some are short-term extended though, so take note of where they are relative to their moving averages and Stage 2 breakout point and Keltner ATR bands (if highlighted on the chart), as remember this is a watchlist.
I recommend viewing all stocks on the weekly timeframe also, which is the key timeframe for the Stage Analysis method to help give context to where they are (what part of the Stage), how much overhead resistance there is. What the character of the stock is. i.e. has it trended well in the past in Stage 2 advances and Stage 4 declines etc.
Also, it's important to look for group themes, as that is a crucial aspect of the method that is often missed by people.
Become a Stage Analysis Member:
To see more like this – US Stocks watchlist posts, detailed videos each weekend, use our unique Stage Analysis tools, such as the US Stocks & ETFs Screener, Charts, Market Breadth, Group Relative Strength and more...
Join Today
Disclaimer: For educational purpose only. Not investment advice. Seek professional advice from a financial advisor before making any investing decisions.