
Stage Analysis Technical Attributes Scores – Nasdaq 100
It has been a month since I analysed the Stage Analysis Technical Attributes weekly scores for the Nasdaq 100. So I thought it might be a useful regular feature for the Stage Analysis members, as it shows a rough guide of the Stages of the individual stocks within the Nasdaq 100, as everything above a 7 would be considered in the Stage 2 zone, 4-6 in the Stage 1 or Stage 3 zone, and 3 or below is the Stage 4 zone.
So currently the Nasdaq 100 consists of:
- 40% Stage 2 zone
- 26% Stage 1 zone
- 34% Stage 4 zone
Overall Average SATA Score: 5.08 (Stage 1 zone)
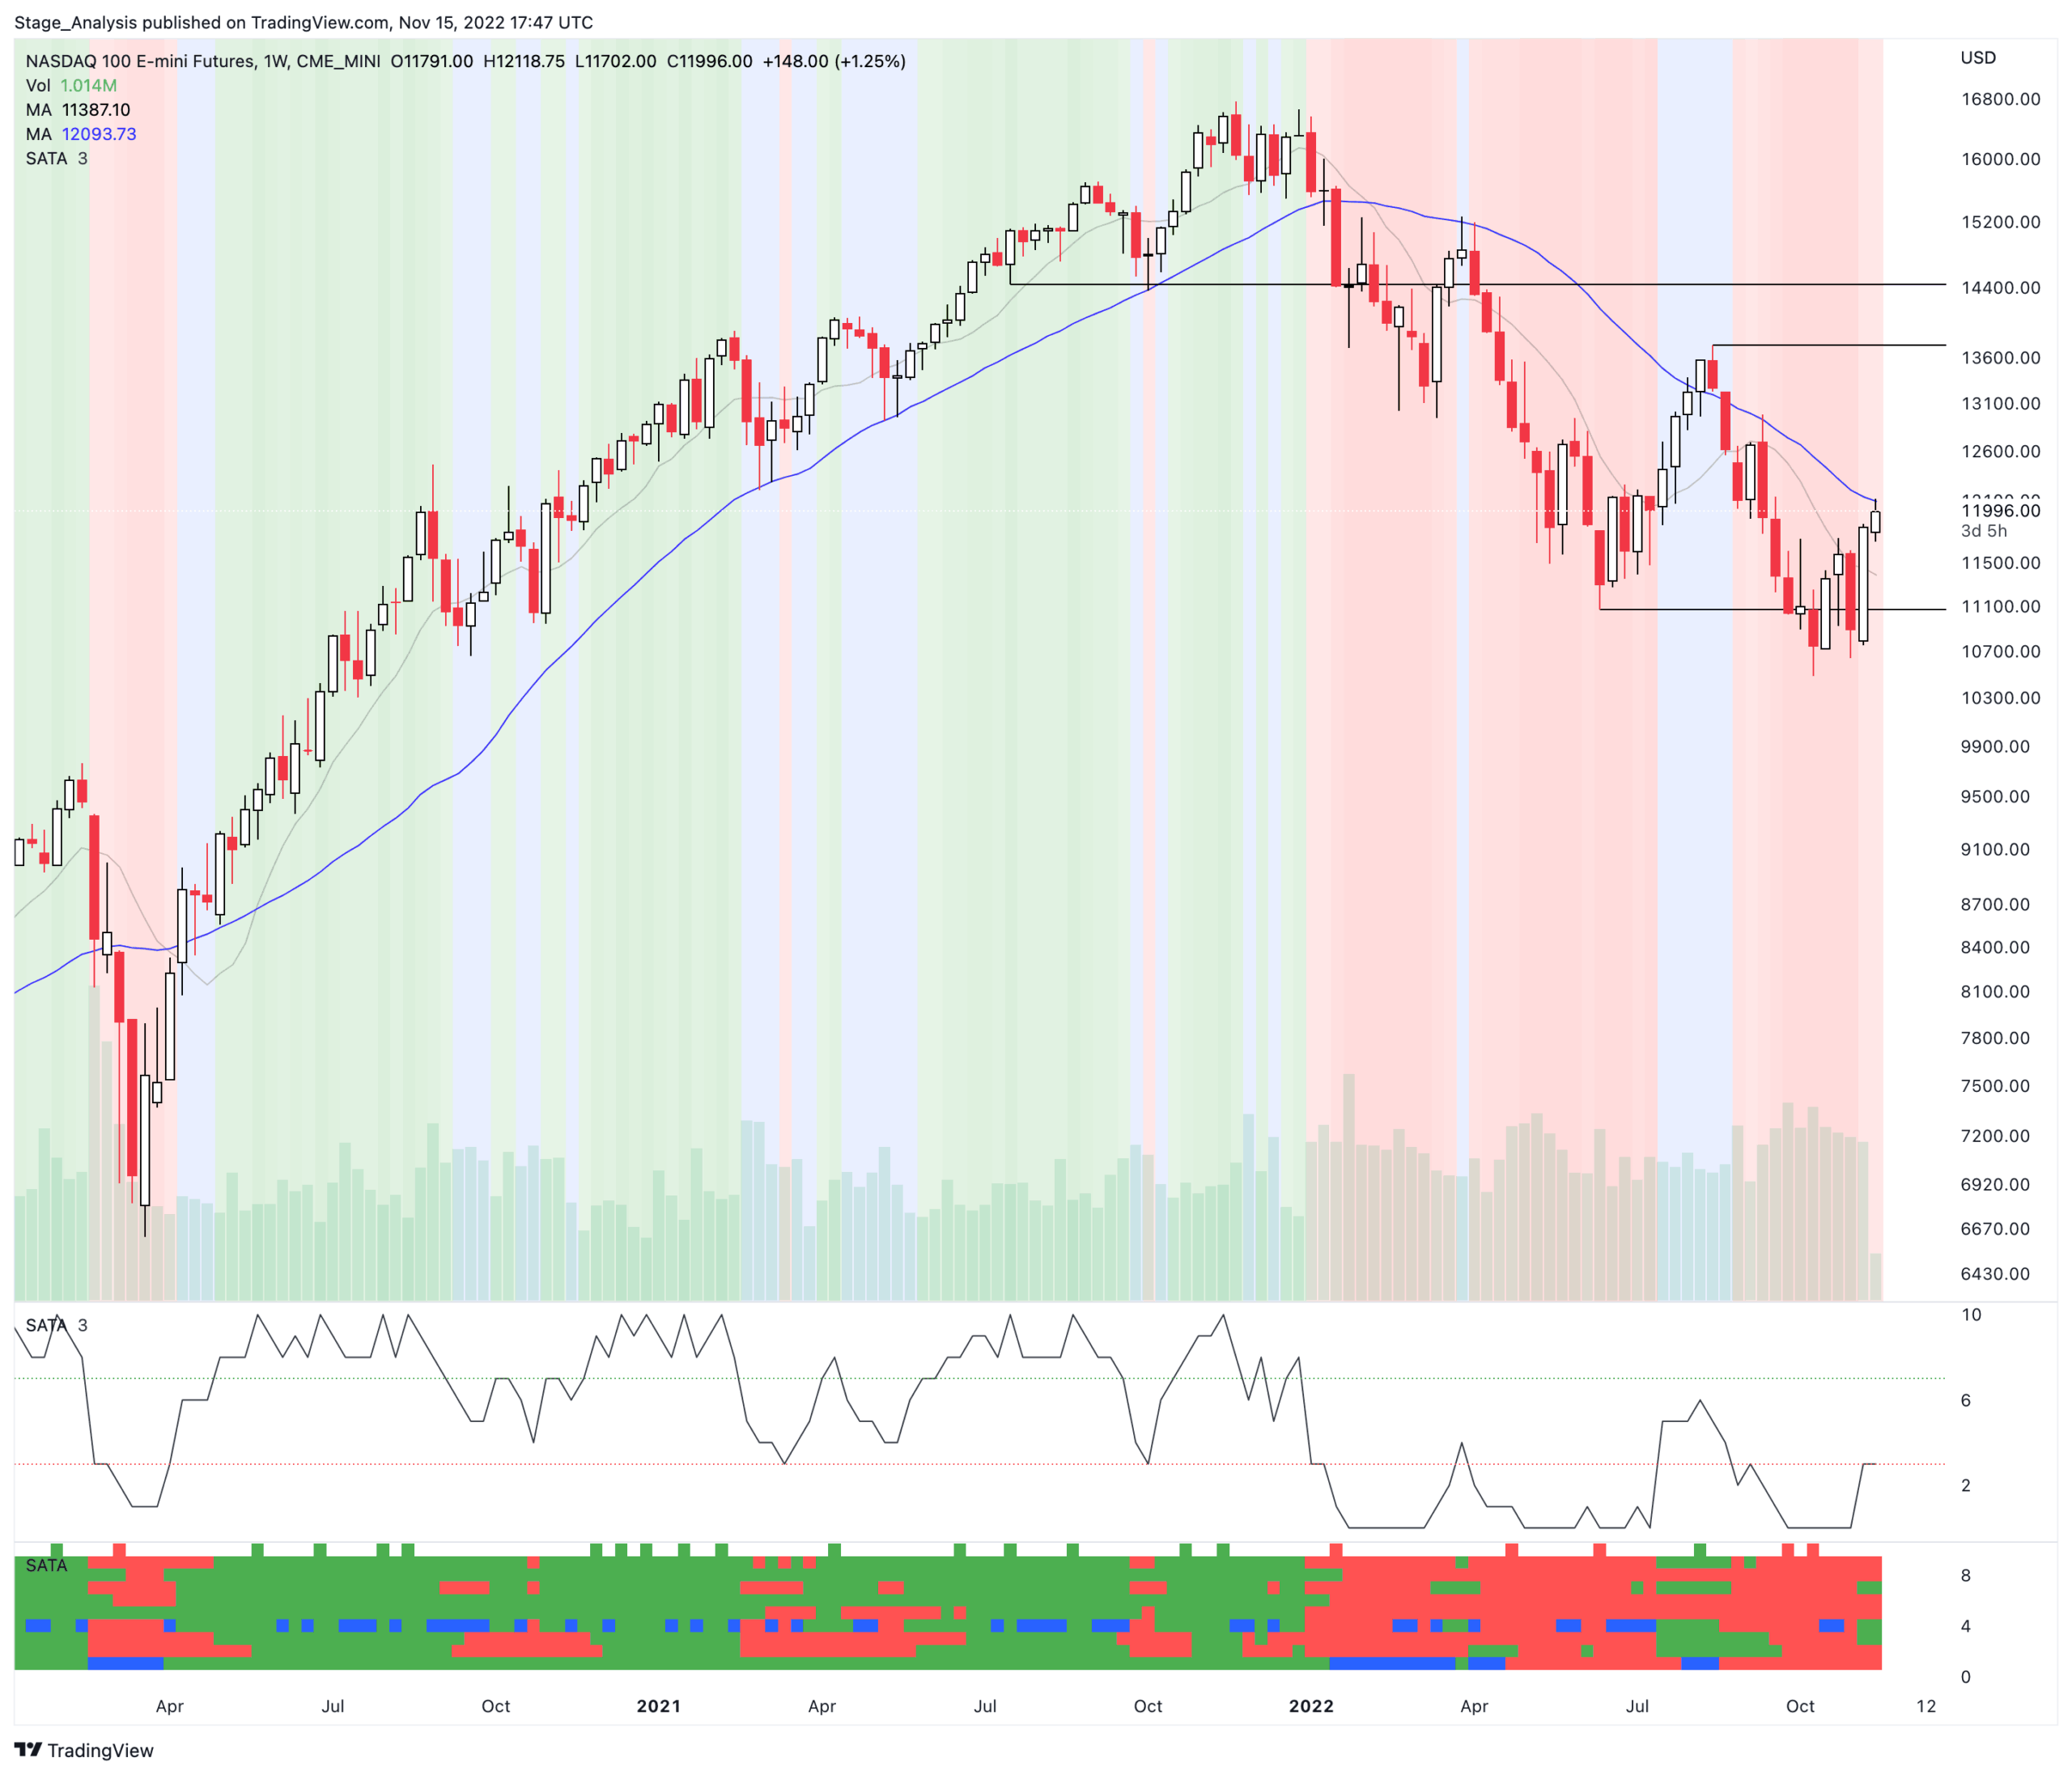
Nasdaq 100 E-mini Futures – SATA Weekly Chart
Currently testing the 30 week MA with a SATA score of 3
Below is the data tables of the Nasdaq 100 stocks IBD in order of relative strength and the position changes over the last 4 weeks (Members only).
The full post is available to view by members only. For immediate access:
Disclaimer: For educational purpose only. Not investment advice. Seek professional advice from a financial advisor before making any investing decisions.