
Stock Market Update and the US Stocks Watchlist – 4 October 2022
The full post is available to view by members only. For immediate access:
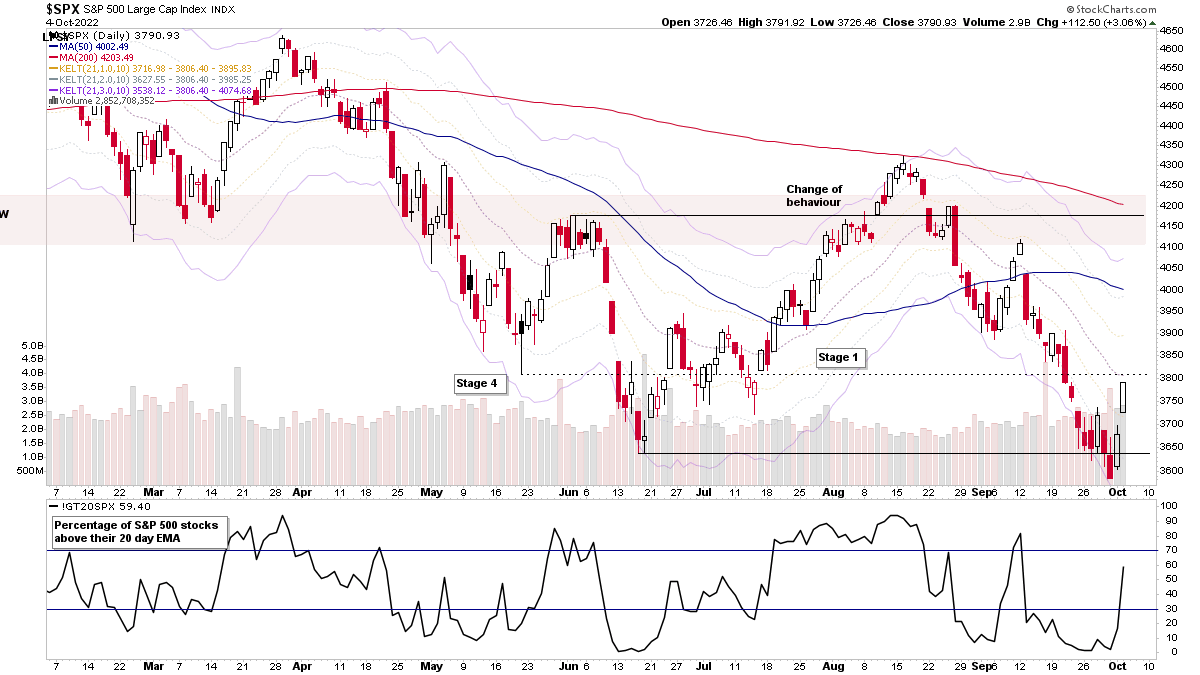
The S&P 500 (shown above) and other major indexes rallied strongly for a second day and the S&P 500 is making a Spring attempt from the lows of the developing range, which may still be potentially a developing Stage 1 base.
I talked in the weekend market breadth posts about the need to be alert to a potential short-covering rally, as the moving average breadth had reached similar levels to the June low and was extremely stretched in the near-term with negative sentiment also reaching extreme levels. That short covering rally has emerged over the last few days with the S&P 500 up +5.73% from last Fridays close and now approaching the short-term MAs, such as the 21 day EMA, with lots of strong moves in individual stocks, which has expanded the percentage of stocks above their 20 day EMA from an extreme of just 2.20% on Friday to 59.40% on Tuesday. So there's been a significant expansion in the short-term MA breadth, which has turned it back to postive status in the short-term.
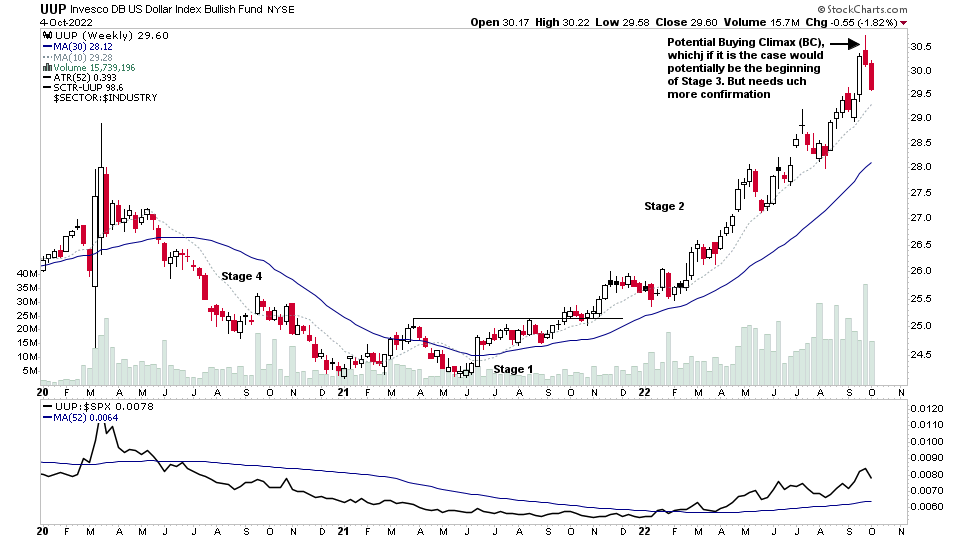
The Stage 2 advance in the US Dollar Index has been a big driver of the Stage 4 decline in the stock market over the last year. But last week saw a potential Buying Climax (BC), with a climactic candle that made a new 12 month high and closed the week lower, and has this week followed through strongly back towards the short-term MAs. Hence it is showing a potential Change of Behaviour over the previous pullbacks, and so it might be the potential beginning of Stage 3. However, it needs much more confirmation in the coming weeks and months to determine that. But a Buying Climax and Change of Behaviour is often the first step in the transition to look out for.
Therefore if it is the start of topping action in the Dollar, then that could be a potential positive for stocks and precious metals etc.
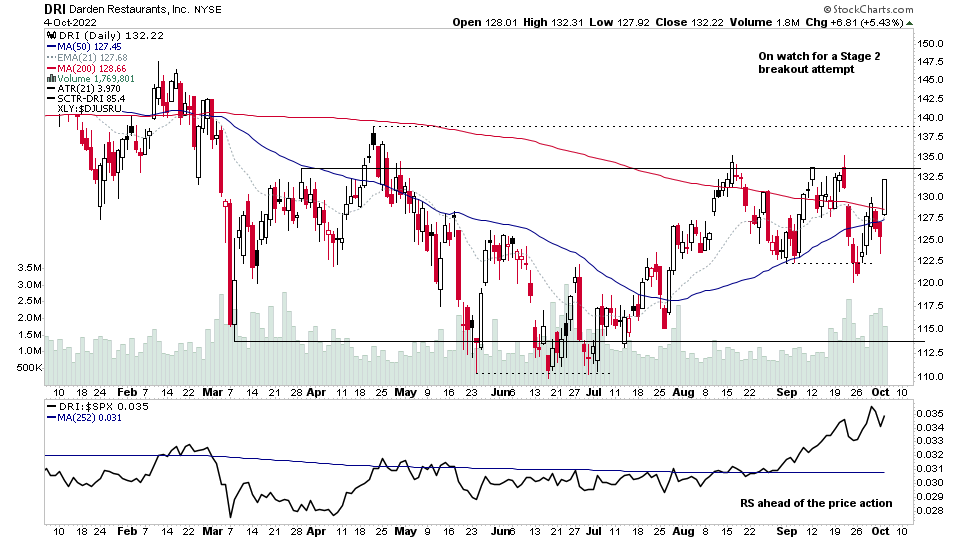
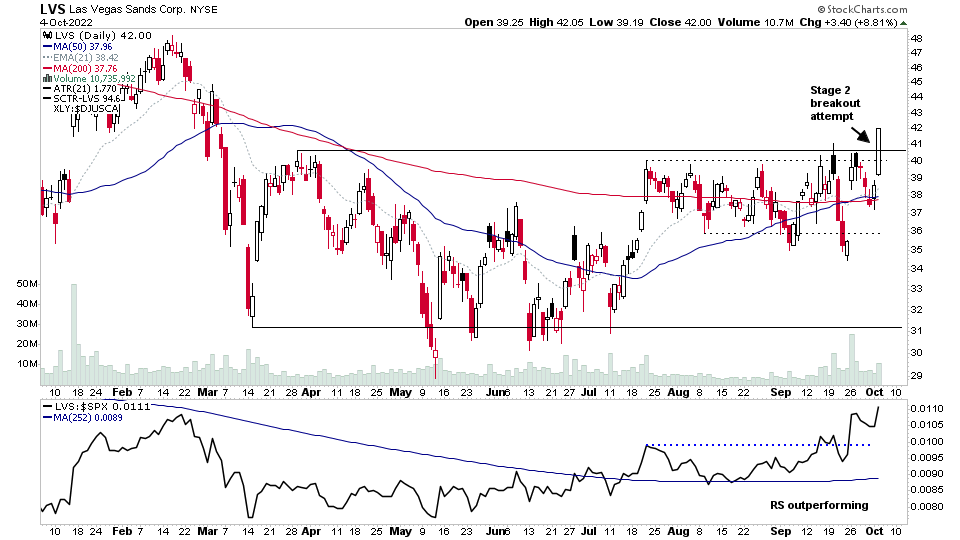
US Stocks Watchlist – 4 October 2022
There were 31 stocks highlighted from the US stocks watchlist scans today
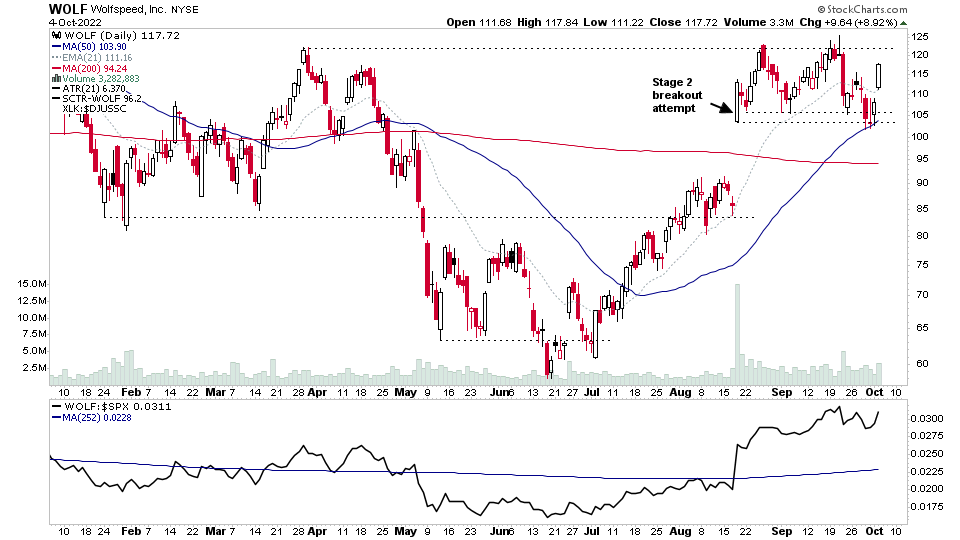
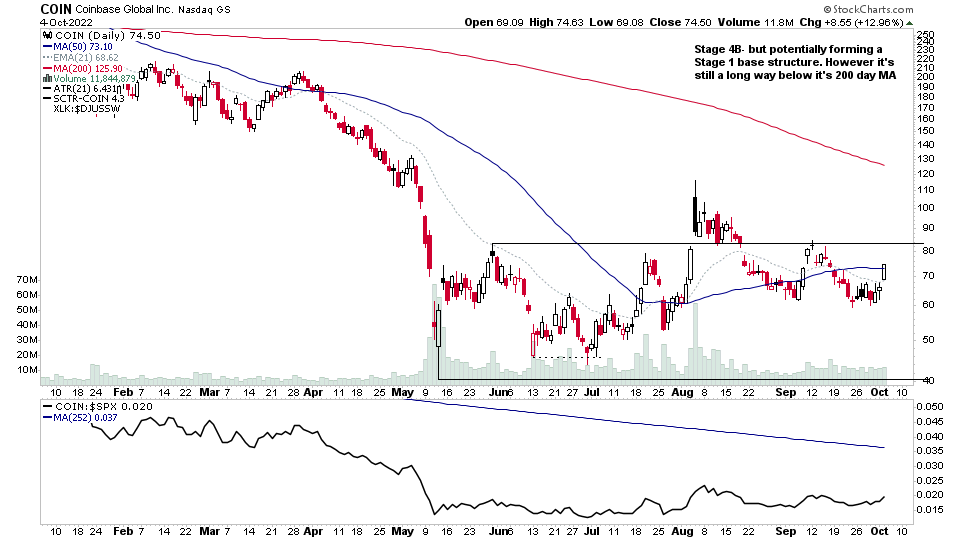
WOLF, COIN, DRI, LVS + 28 more...
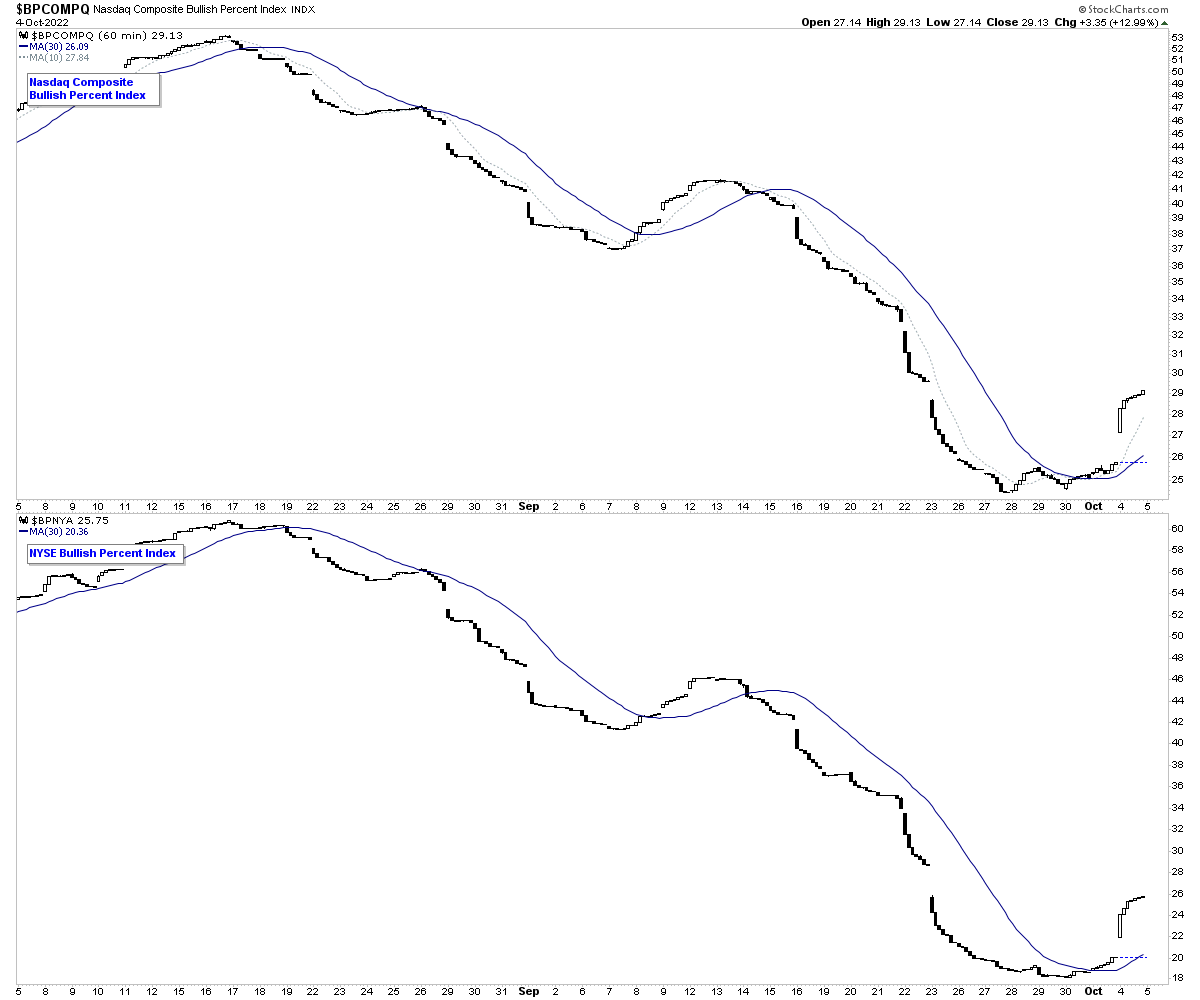
Market Breadth: Nasdaq and NYSE Bullish Percent Index
I highlighted yesterday in the members video about the short-term tentative change of status towards positive in the Nasdaq and NYSE Bullish Percent Index chart intraday chart that I use as part of the short-term market breadth weight of evidence.
Today they both gapped up on the open strongly and followed through intraday. So it changes the status to a short-term positive environment for this breadth measure.
Become a Stage Analysis Member:
To see more like this – US Stocks watchlist posts, detailed videos each weekend, use our unique Stage Analysis tools, such as the US Stocks & ETFs Screener, Charts, Market Breadth, Group Relative Strength and more...
Join Today
Disclaimer: For educational purpose only. Not investment advice. Seek professional advice from a financial advisor before making any investing decisions.