
Stage Analysis Members Video – 2 August 2026 (1hr 14mins)
02 August, 2026The full post is available to view by members only. For immediate access:
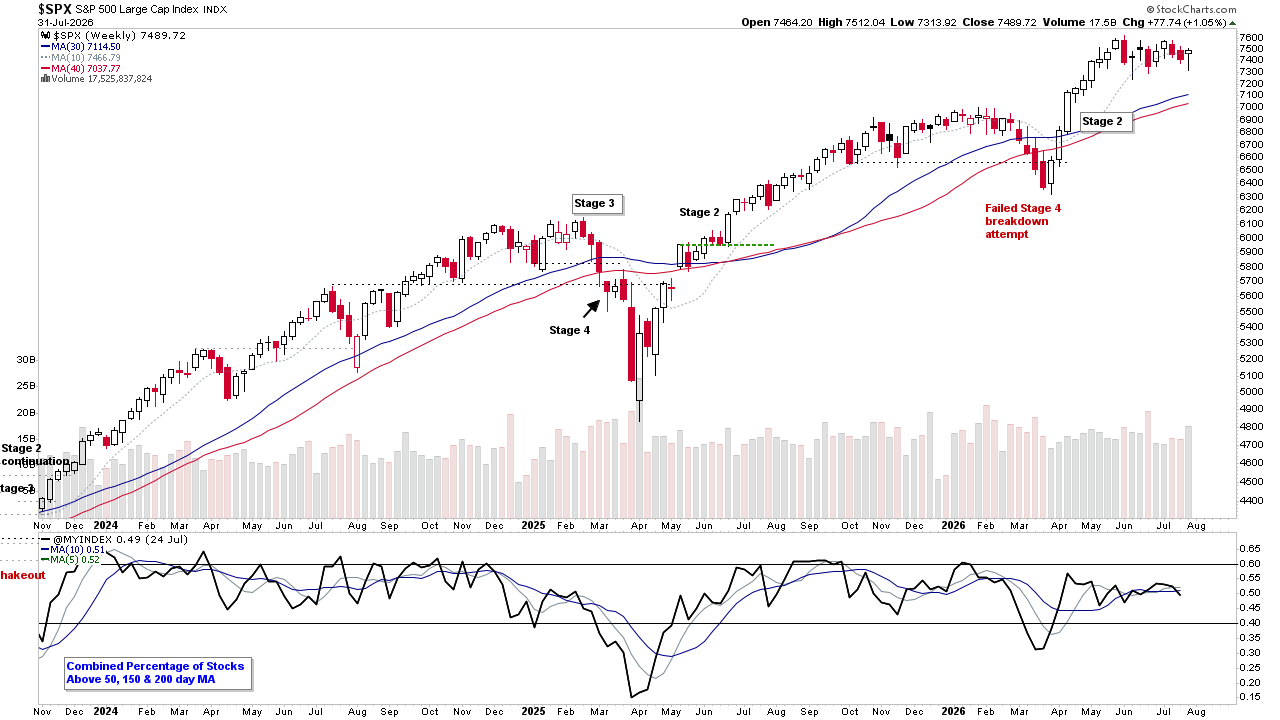
The Stage Analysis members video begins with a discussion of the current US Watchlist Stocks on multiple timeframes, Stages Summary, the Sector breadth and Sub-industries Bell Curves, Relative Strength Rankings, the key Market Breadth Charts to determine the Weight of Evidence, Bitcoin & Ethereum, the Major US Stock Market Indexes and the ETF Summary.
Todays video also features a first look at the NEW GICS Screener and individual GICS pages which i've been working on heavily for the last three months, and has been four years in the making since my previous developer began working on them. So they are finally ready to be launched onto the live website in the coming week. So I am excited to get them live and start using them on a daily basis.
Become a Stage Analysis Member:
To see more like this – US Stocks watchlist posts, detailed videos each weekend, use our unique Stage Analysis tools, such as the US Stocks & ETFs Screener, Charts, Market Breadth, Group Relative Strength and more...
Join Today
Disclaimer: For educational purpose only. Not investment advice. Seek professional advice from a financial advisor before making any investing decisions.