
Market Breadth: Percentage of Stocks Above their 50 Day, 150 Day & 200 Day Moving Averages Combined
The full post is available to view by members only. For immediate access:
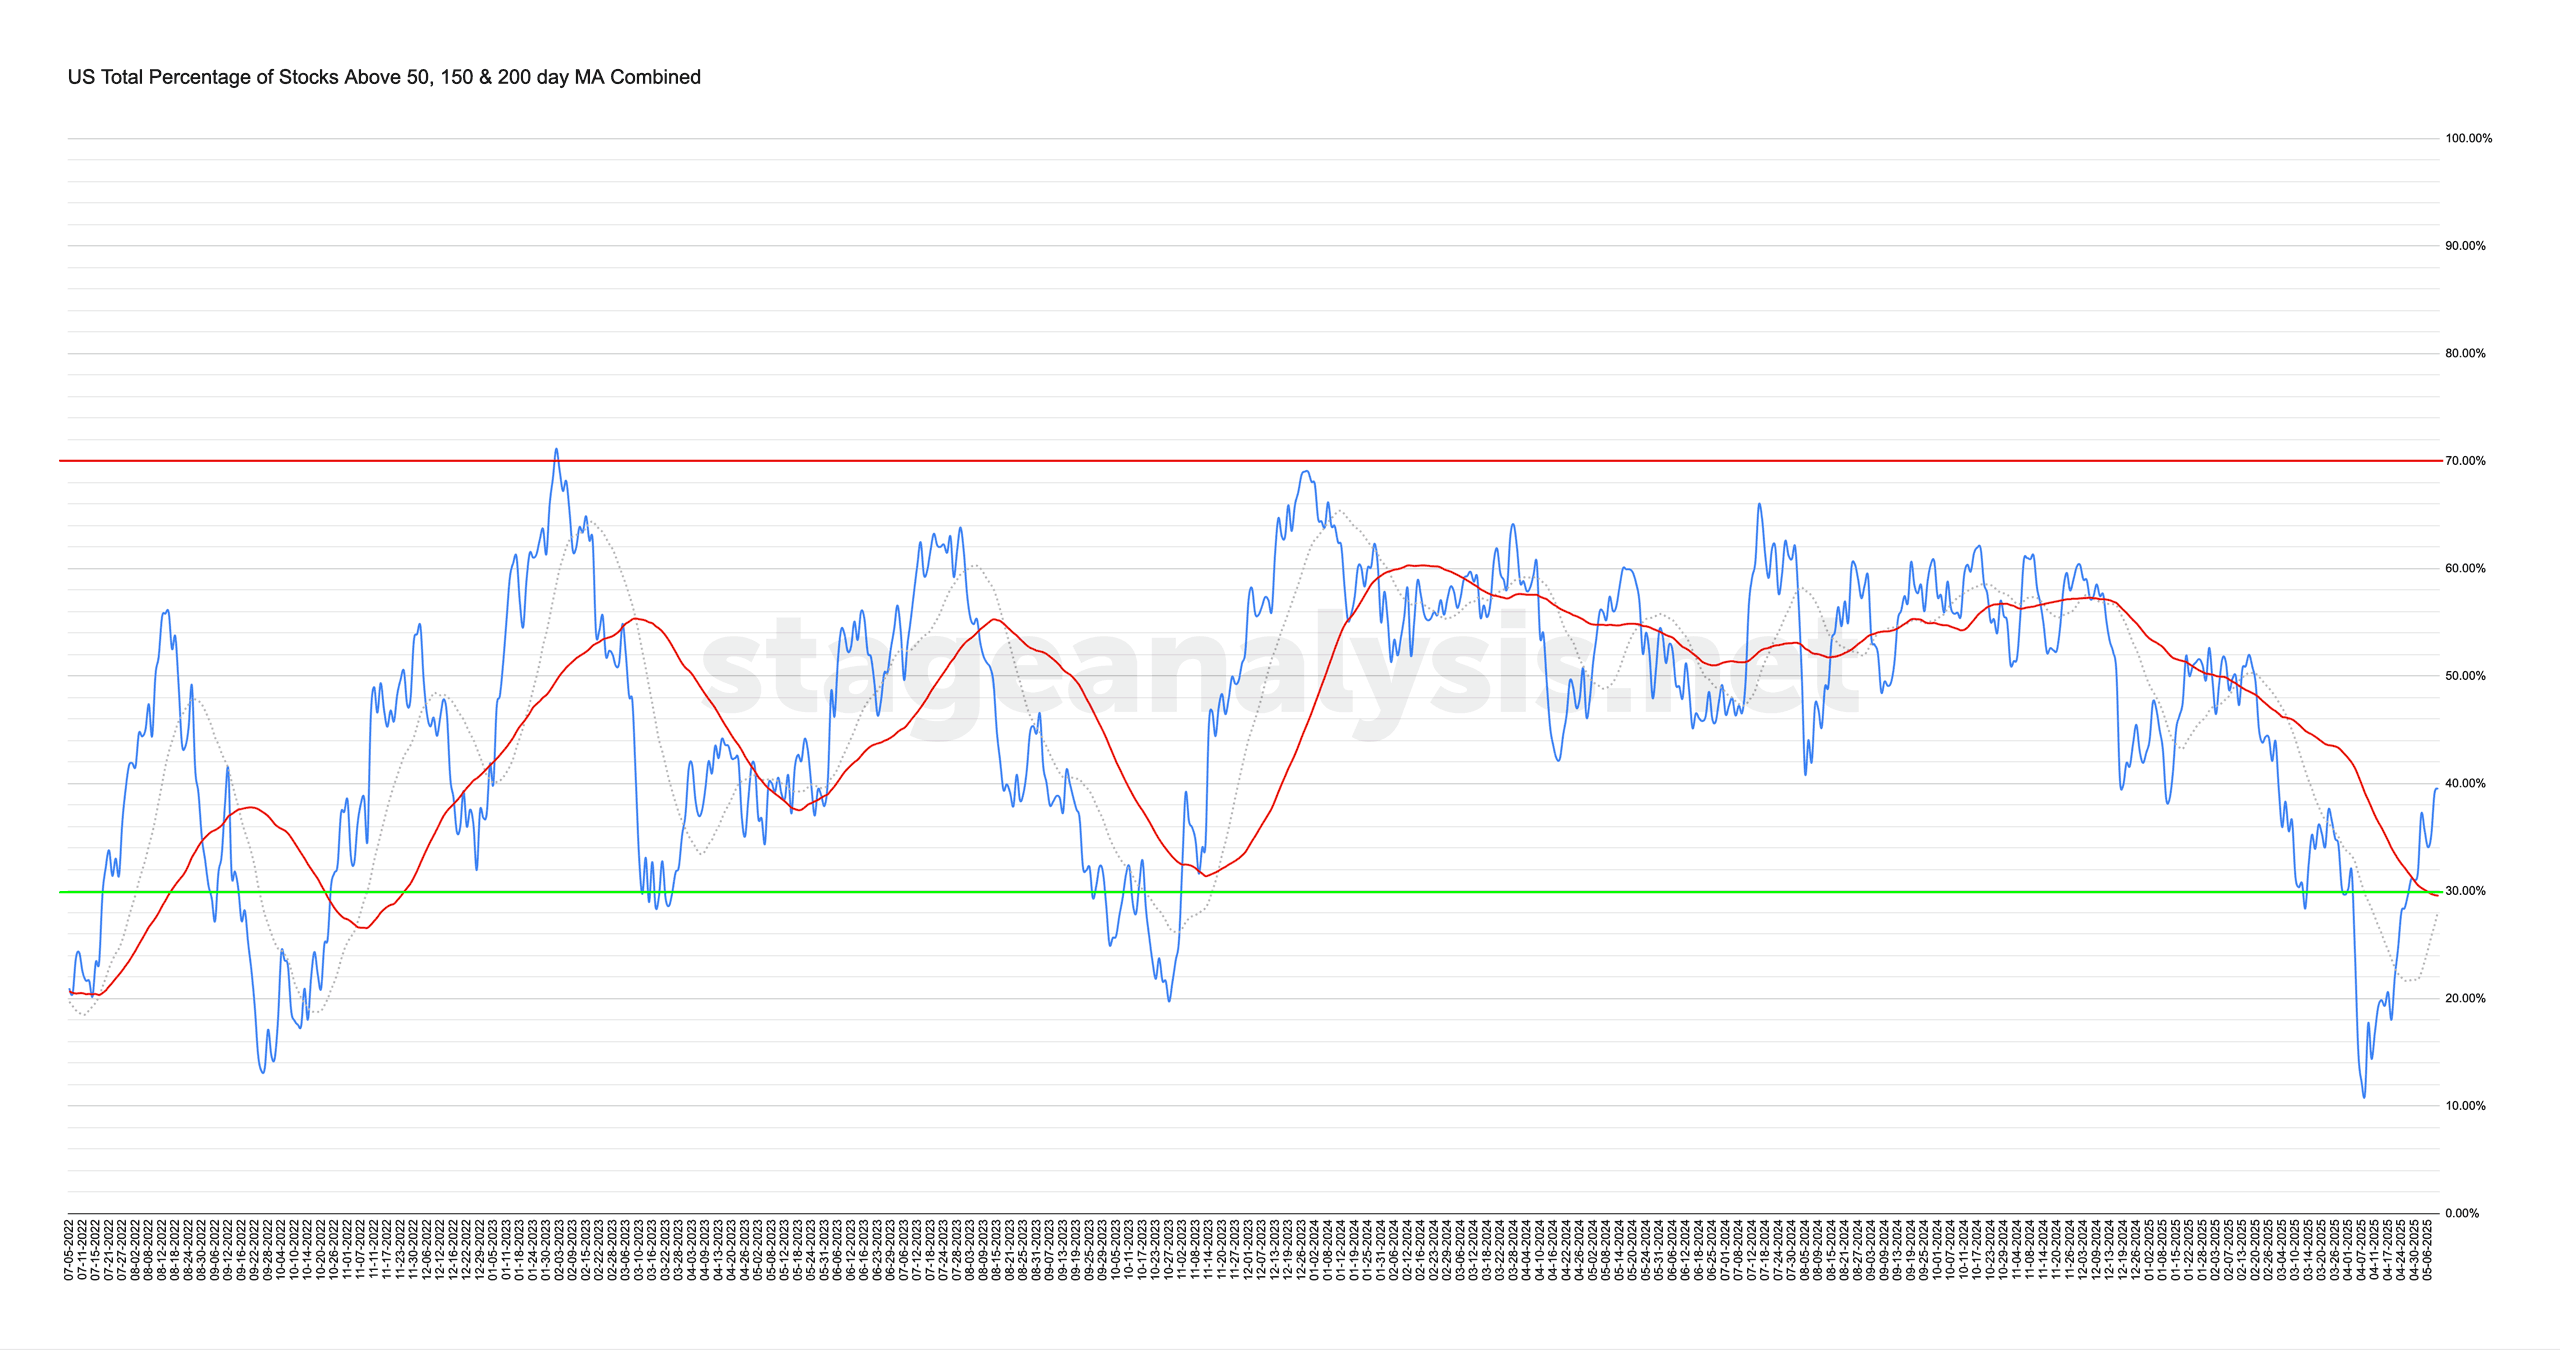
39.46% (+2.32% 1wk)
Status: Positive Environment
The US Total Percentage of Stocks above their 50 Day, 150 Day & 200 Day Moving Averages (shown above) increased by +2.32% this week.
Therefore, the overall combined average is at 39.46% in the US market (NYSE and Nasdaq markets combined) above their short, medium and long term moving averages.
The combined average had a minor pullback earlier in the week, but followed through on Thursday above the March swing high – which is a notable change of character. So it's now +11.41% above its shorter-term 20 day MA, and improved to +9.89% above its 50 day MA (signal line). Hence, with the higher high, the tentative has been dropped from the Positive Environment status that began the previous week.
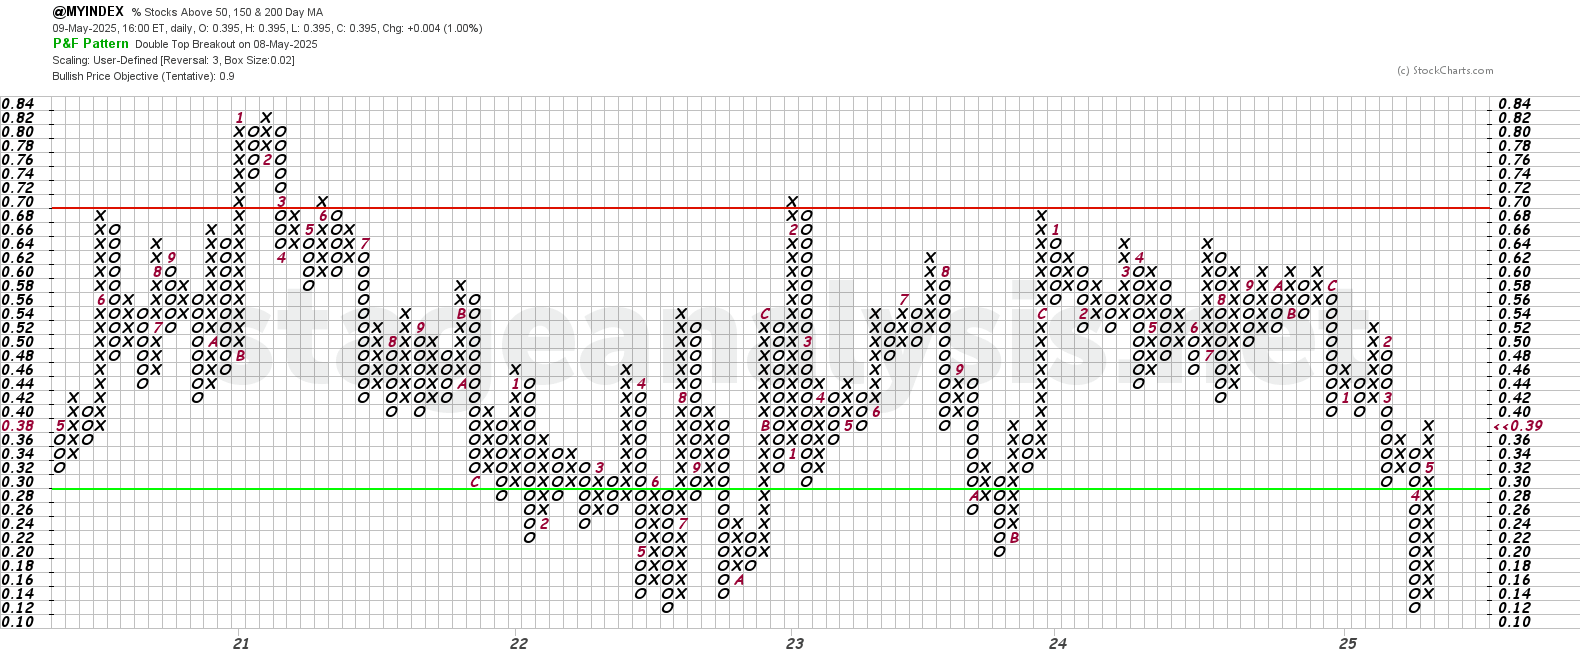
The Point and Figure (P&F) chart (shown above) added a further one X to its a column of Xs on Thursday, making a double top breakout. So the P&F strategy remains on Offense (as it is in a column of Xs), and has changed to P&F Bull Confirmed status with the breakout.
See the Bullish Percent article for more information on the P&F statuses.
Become a Stage Analysis Member:
To see more like this – US Stocks watchlist posts, detailed videos each weekend, use our unique Stage Analysis tools, such as the US Stocks & ETFs Screener, Charts, Market Breadth, Group Relative Strength and more...
Join Today
Disclaimer: For educational purpose only. Not investment advice. Seek professional advice from a financial advisor before making any investing decisions.