
Market Breadth: Percentage of Stocks Above their 50 Day, 150 Day & 200 Day Moving Averages Combined
The full post is available to view by members only. For immediate access:
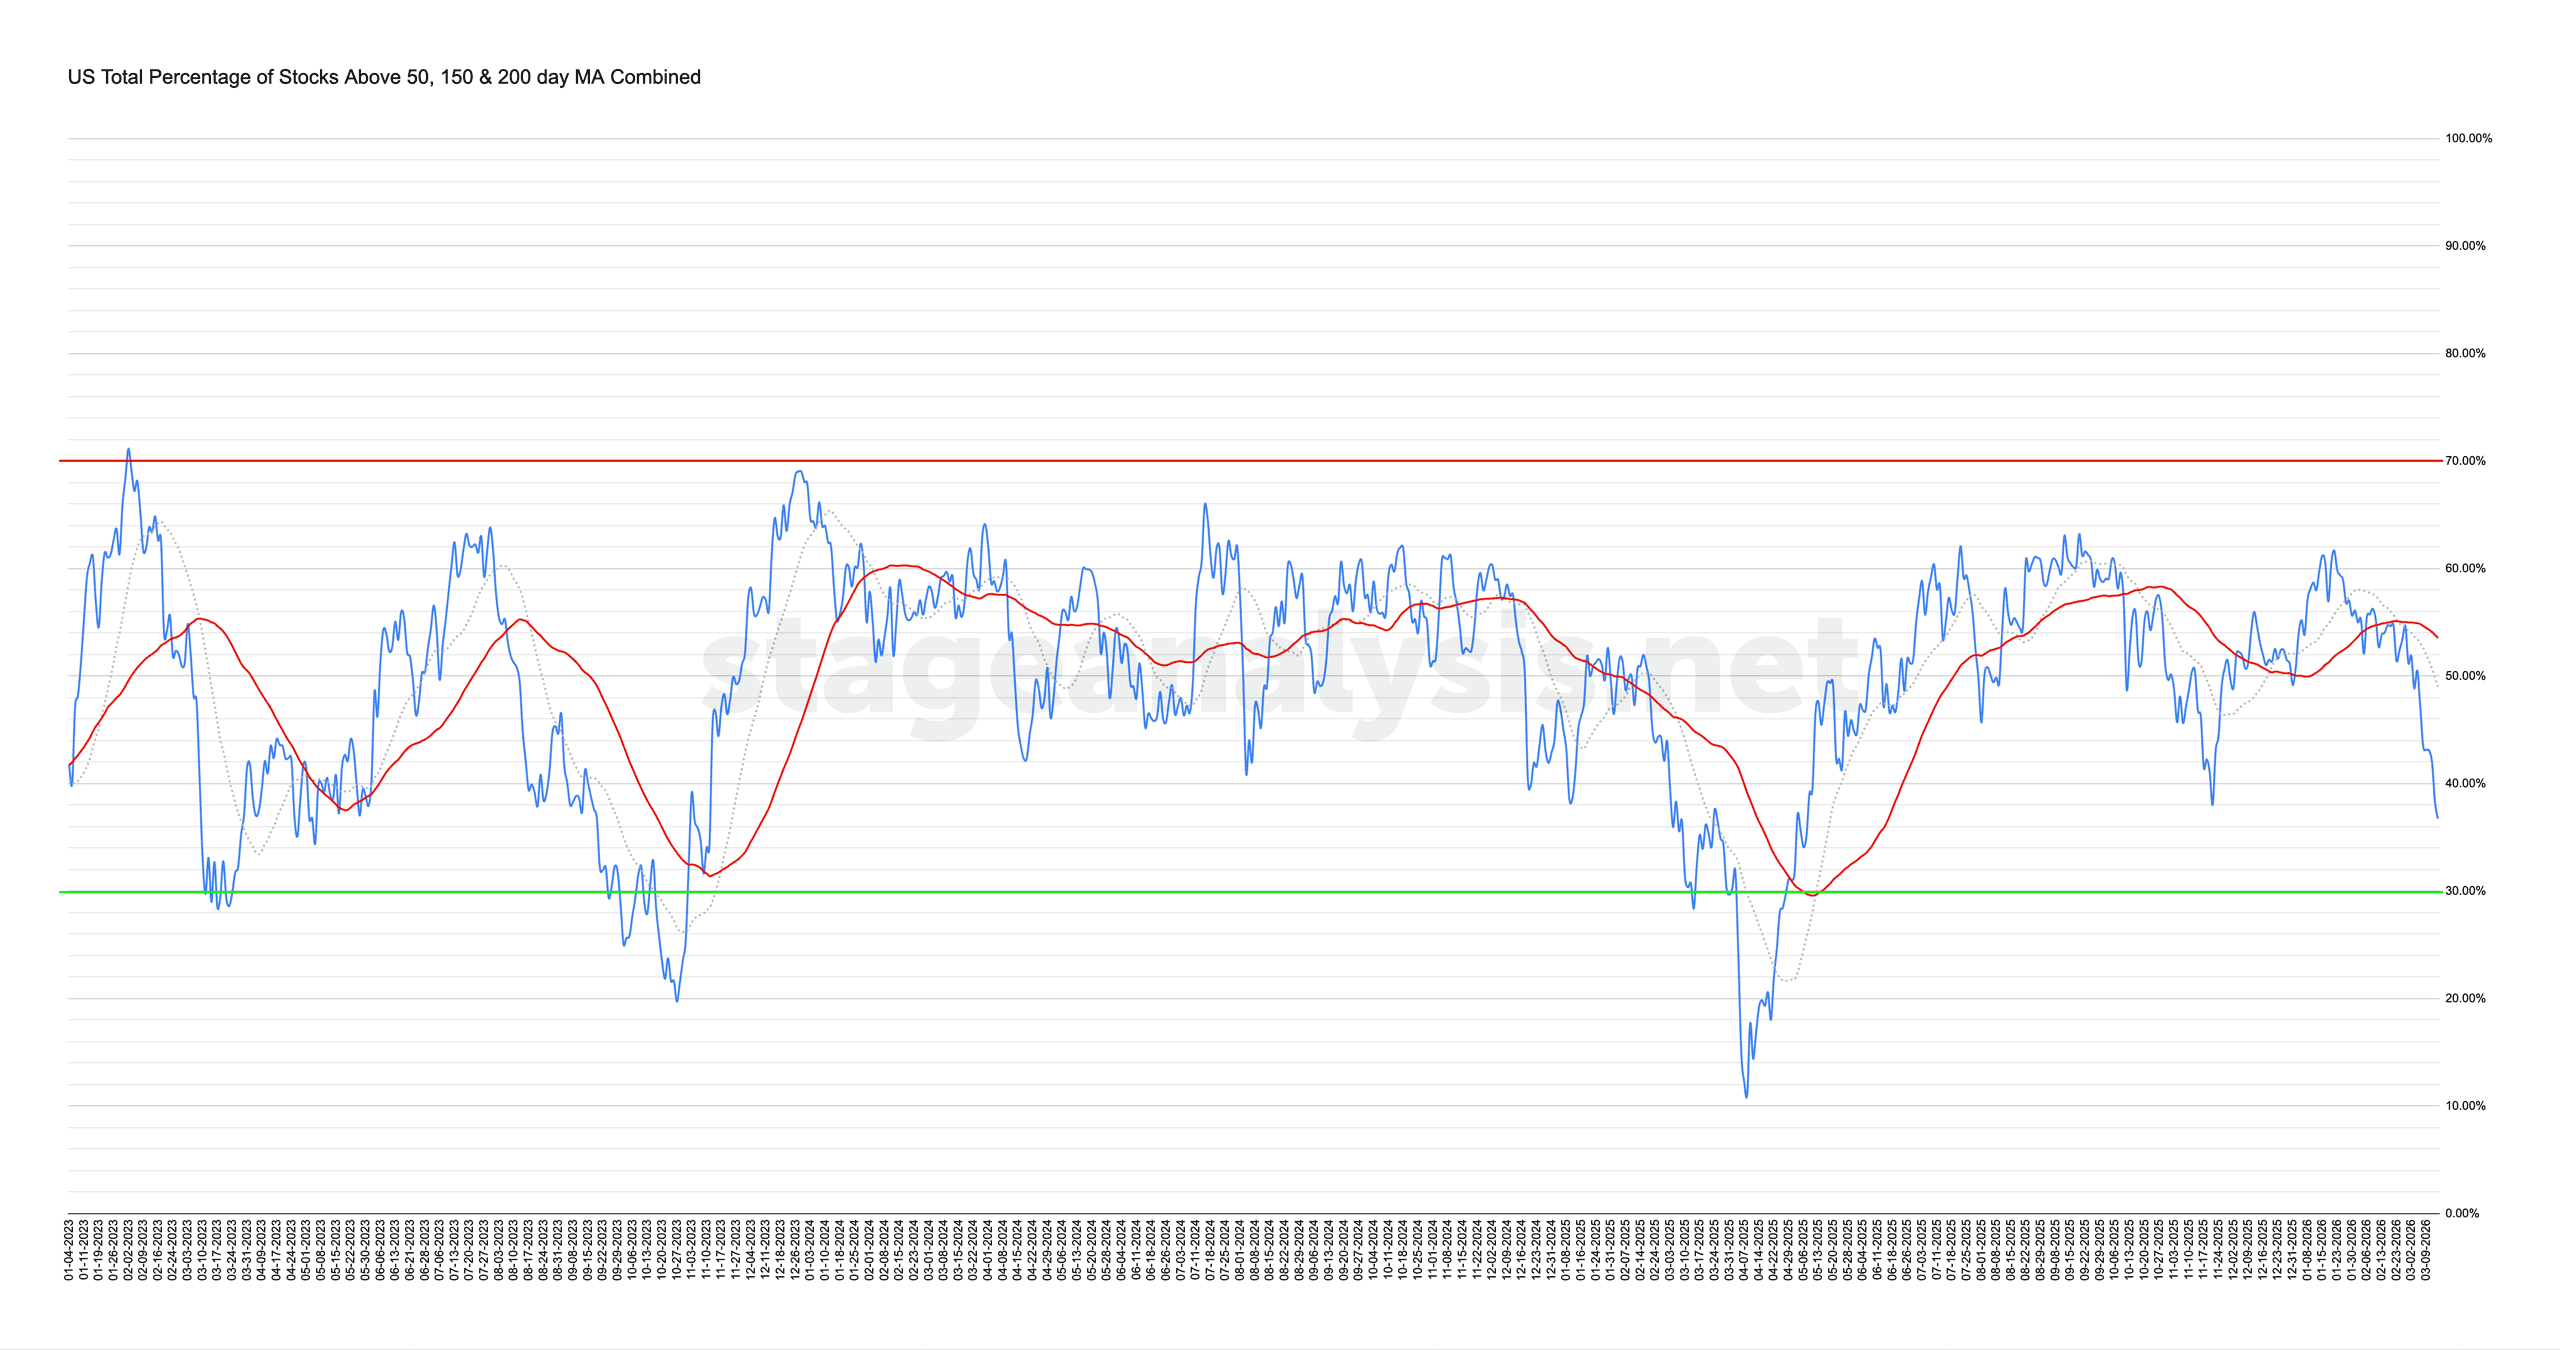
36.73% (-6.77% 1wk)
Status: Difficult Environment
The US Total Percentage of Stocks above their 50 Day, 150 Day & 200 Day Moving Averages (shown above) decreased by -6.77% this week.
Therefore, the overall combined average is at 36.73% in the US market (NYSE and Nasdaq markets combined) above their short, medium and long term moving averages.
The combined average continued lower for another week, ending the week below the 40% level, which is the Weak range (i.e. Stage 4 stocks are on the increase and starting to outnumber Stage 2 stocks in the main sub-stages). So the US market is in potential Stage 3 territory currently.
Distance from combined average is -12.27% below its short-term 20 day MA, and -16.81% below its 50 day MA (signal line). Hence the status continues to be on Difficult Environment status.
So extreme caution is prudent, as major US indexes move closer to their current Stage 4 levels.
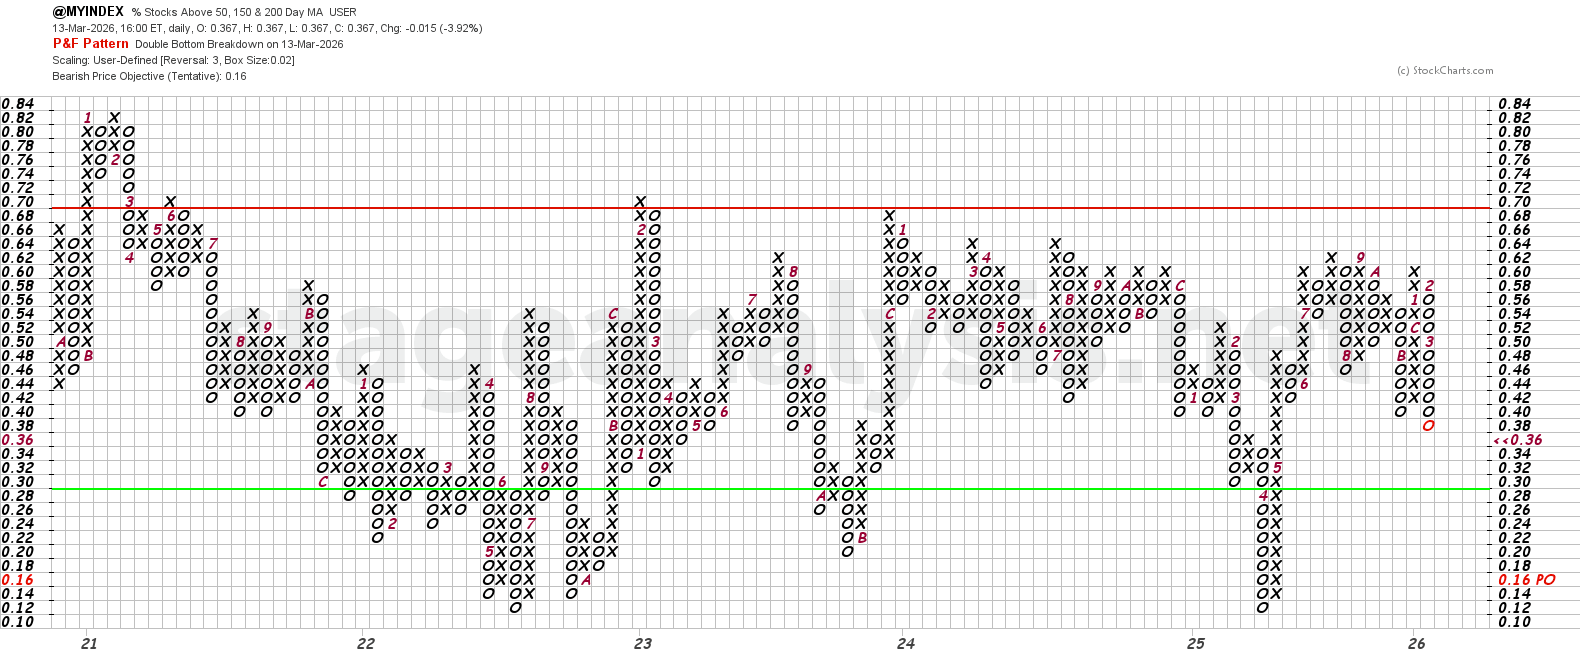
The Point and Figure (P&F) chart (shown above) dropped by a further 3 Os in the current column of Os. So the P&F strategy remains on Defense (as it is in a column of Os), and the P&F status changed to Bear Confirmed status in the lower-middle of the field.
See the Bullish Percent article for more information on the P&F statuses.
Become a Stage Analysis Member:
To see more like this – US Stocks watchlist posts, detailed videos each weekend, use our unique Stage Analysis tools, such as the US Stocks & ETFs Screener, Charts, Market Breadth, Group Relative Strength and more...
Join Today
Disclaimer: For educational purpose only. Not investment advice. Seek professional advice from a financial advisor before making any investing decisions.