There were 15 stocks highlighted from the US stocks watchlist scans today...
Read More

Blog
12 May, 2024
US Stocks Watchlist – 12 May 2024
12 May, 2024
Stage Analysis Members Video – 12 May 2024 (1hr 3mins)
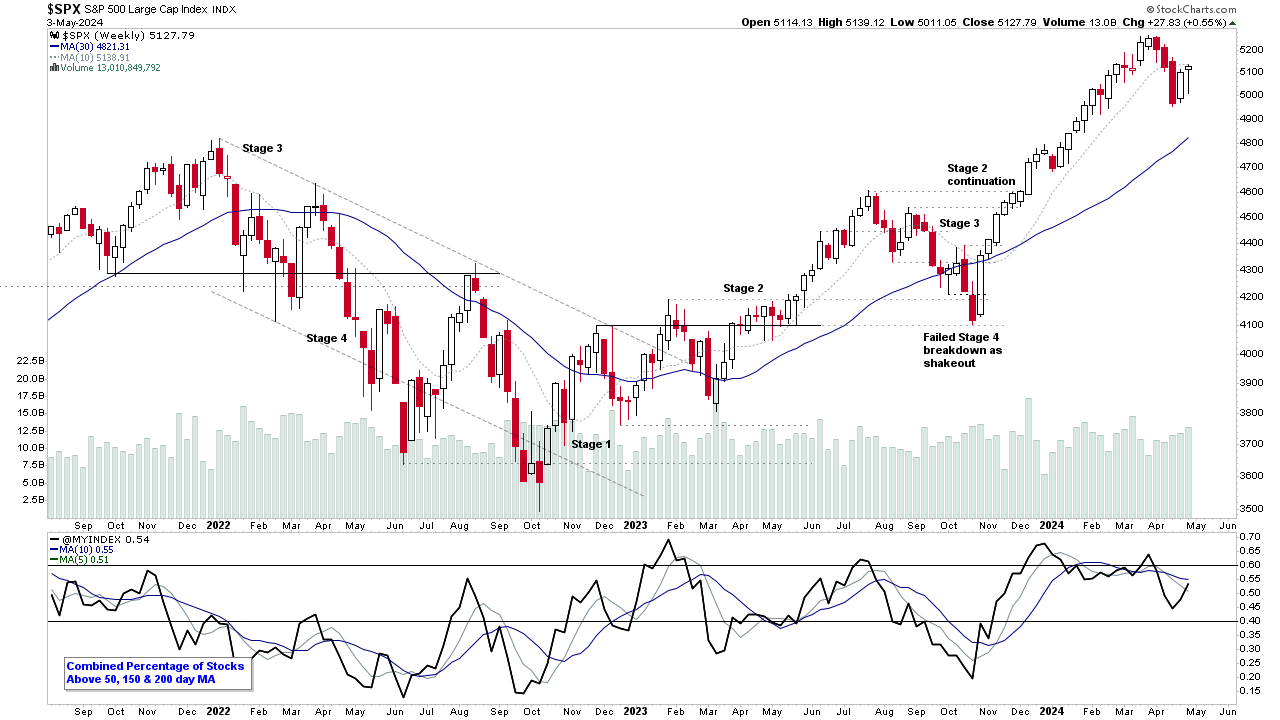
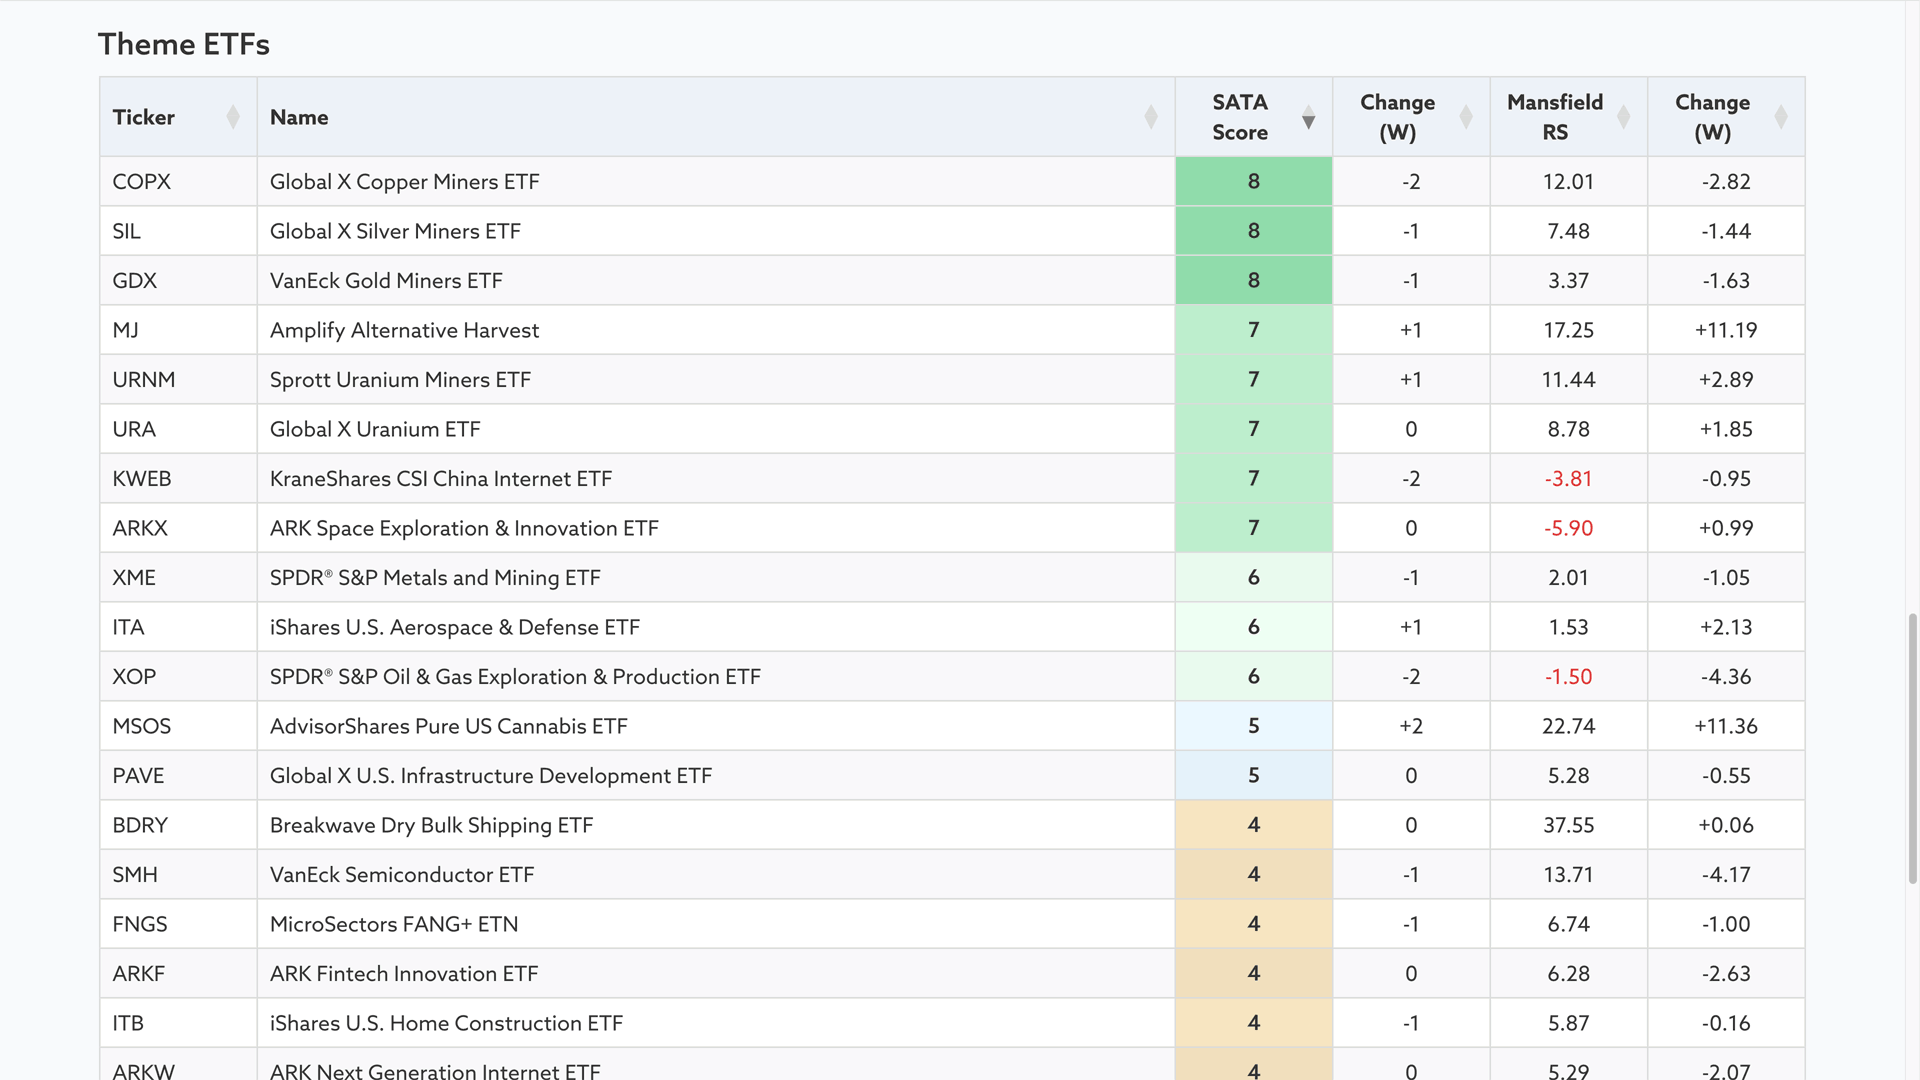
Stage Analysis members weekend video beginning with a look at some of this weeks Significant Bars, followed by the weekend US watchlist stocks, then the New Stage Analysis Screener options, the Industry Groups Relative Strength (RS) Rankings, the key Market Breadth Charts to determine the Weight of Evidence, and the Major US Stock Market Indexes.
Read More
09 May, 2024
US Stocks Watchlist – 9 May 2024
There were 23 stocks highlighted from the US stocks watchlist scans today...
Read More
07 May, 2024
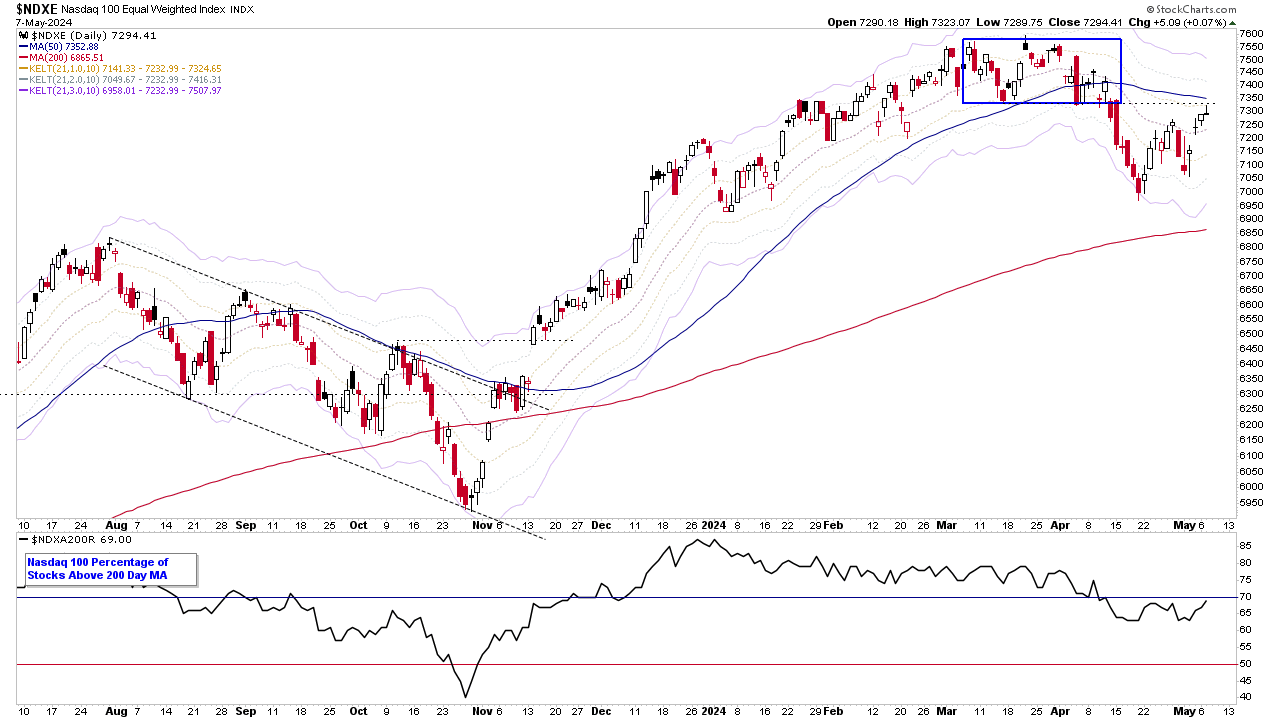
US Stocks Watchlist – 7 May 2024
I've included the Equal Weighted version of the Nasdaq 100 in tonights post, as it's at pivotal point below its 50 day MA, and prior upper-range breakdown level from mid April. Plus, it gives a different perspective to the standard Nasdaq 100 chart, which moved above its own 50 day MA two days ago...
Read More
05 May, 2024
Stage Analysis Members Video – 5 May 2024 (47 mins)
Stage Analysis members weekend video looking at the most recent US watchlist stocks, discussing the New Stage Analysis Screener options and changes to the Members section, the Industry Groups Relative Strength (RS) Rankings, the key Market Breadth Charts to determine the Weight of Evidence, and the Major US Stock Market Indexes.
Read More
05 May, 2024
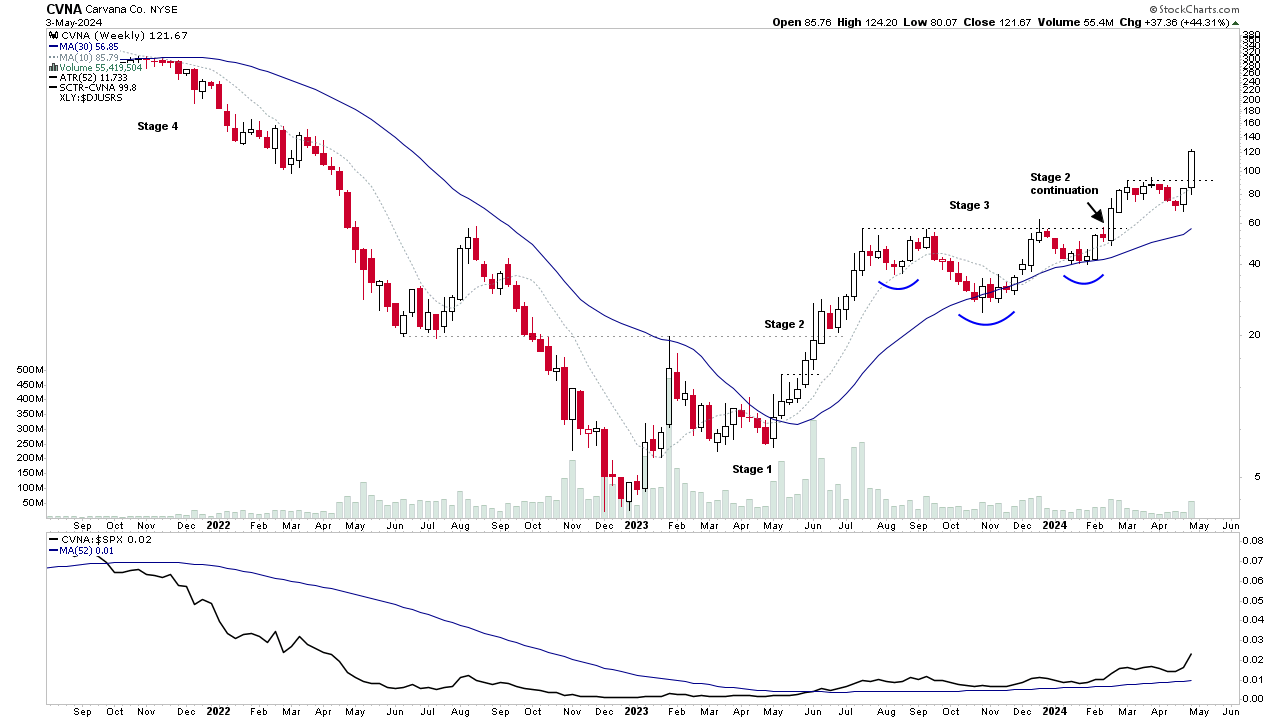
Video: Significant Weekly Bars – CVNA, ASPN, TMDX and More – 5 May 2024 (20mins)
Discussing some of the weeks biggest movers in Stage 2 including CVNA, ASPN, TMDX and more...
Read More
05 May, 2024
US Stocks Watchlist – 5 May 2024
There were 23 stocks highlighted from the US stocks watchlist scans today...
Read More
02 May, 2024
US Stocks Watchlist – 2 May 2024
There were 26 stocks highlighted from the US stocks watchlist scans today...
Read More
01 May, 2024
Video: New Features – 1 May 2024 (25mins)
Video discussing more of the new features added in the last week to the Stage Analysis website...
Read More
30 April, 2024
US Stocks Watchlist – 30 April 2024
There were 30 stocks highlighted from the US stocks watchlist scans today...
Read More