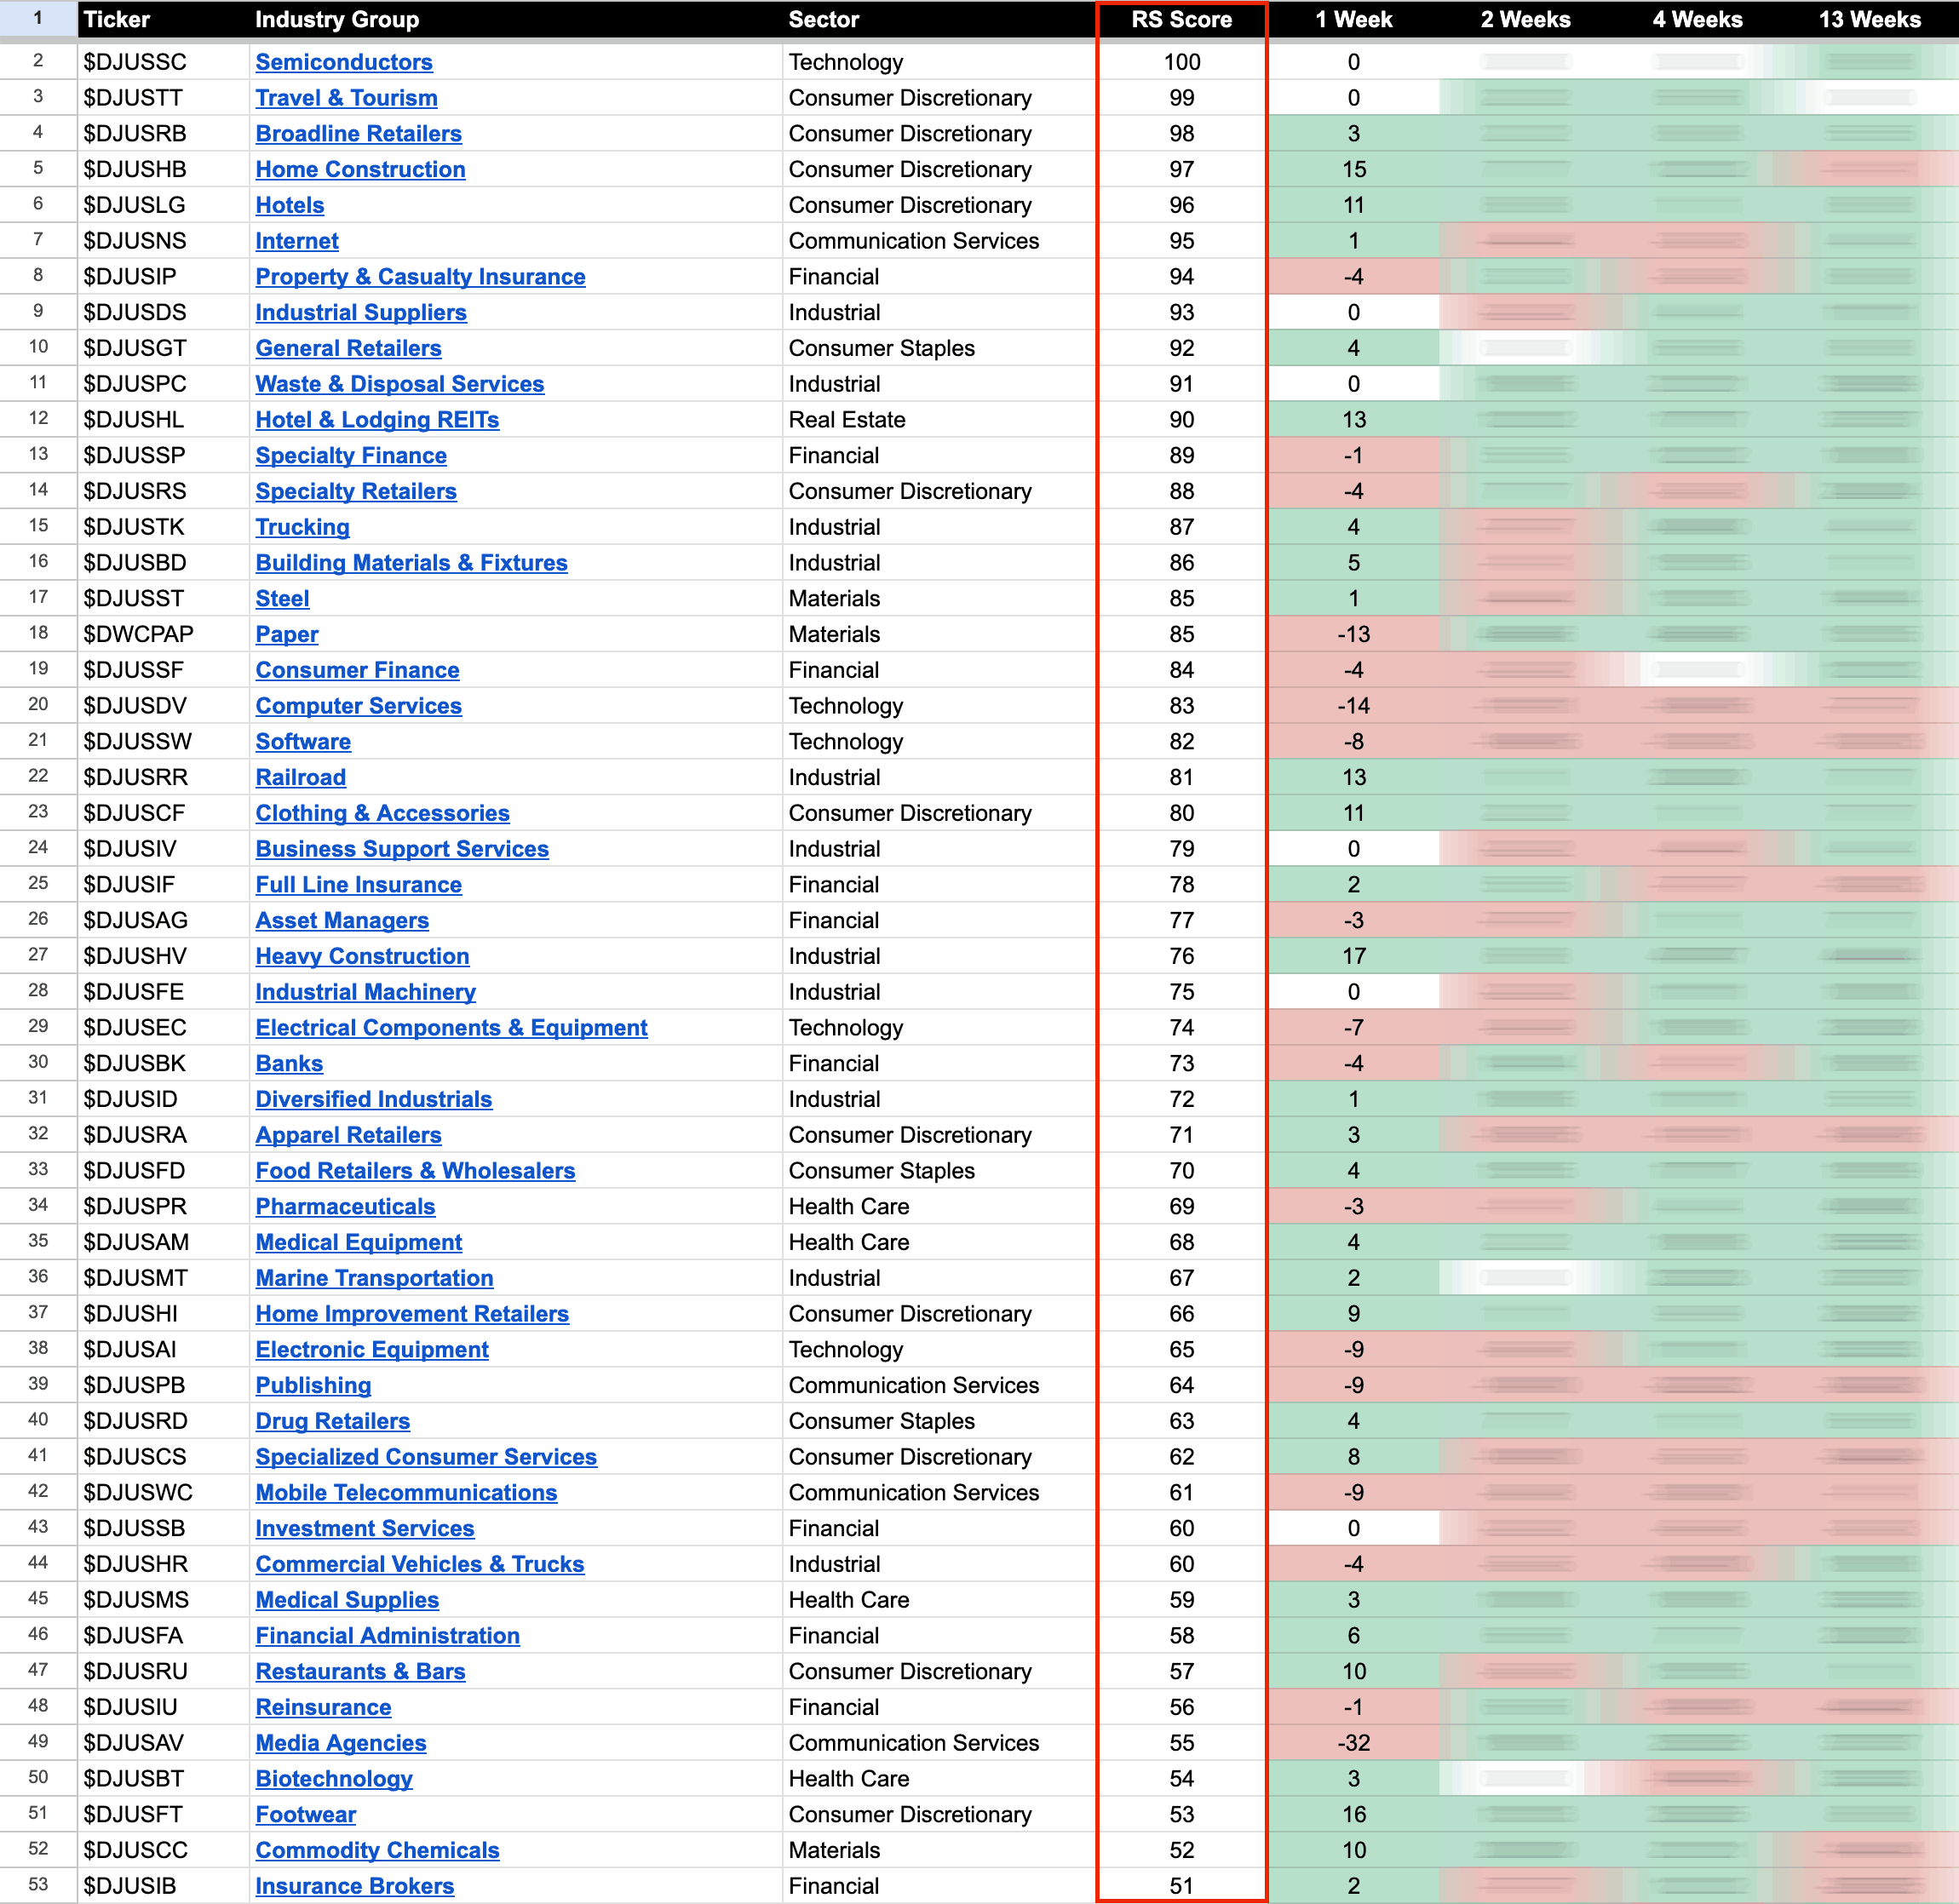
The purpose of the Relative Strength (RS) tables is to track the short, medium and long term RS changes of the individual groups to find the new leadership earlier than the crowd...
Read More

Blog
23 February, 2024
US Stocks Industry Groups Relative Strength Rankings
22 February, 2024
US Stocks Watchlist – 22 February 2024
There were 27 stocks highlighted from the US stocks watchlist scans today...
Read More
20 February, 2024
US Stocks Watchlist – 20 February 2024
There were 20 stocks highlighted from the US stocks watchlist scans today...
Read More
18 February, 2024
Stage Analysis Members Video – 18 February 2024 (1hr 12mins)
Stage Analysis members weekend video discussing the US watchlist stocks in detail on multiple timeframes, the Significant Weekly Bars, Industry Groups Relative Strength (RS) Rankings, IBD Industry Group Bell Curve – Bullish Percent, the key Market Breadth Charts to determine the Weight of Evidence, and the Major US Stock Market Indexes...
Read More
18 February, 2024
US Stocks Watchlist – 18 February 2024
There were 20 stocks highlighted from the US stocks watchlist scans today...
Read More
16 February, 2024
US Stocks Watchlist – 15 February 2024
There were 31 stocks highlighted from the US stocks watchlist scans today...
Read More
14 February, 2024
Video: Earnings Moves – 14 February 2024 (29mins)
Stage Analysis midweek video discussing of some of this weeks strongest earnings moves...
Read More
13 February, 2024
US Stocks Watchlist – 13 February 2024
There were 23 stocks highlighted from the US stocks watchlist scans today...
Read More
11 February, 2024
Stage Analysis Members Video – 11 February 2024 (1hr 15mins)
Stage Analysis members weekend video discussing the Significant Weekly Bars, the US watchlist stocks in detail on multiple timeframes, Industry Groups Relative Strength (RS) Rankings, IBD Industry Group Bell Curve – Bullish Percent, the key Market Breadth Charts to determine the Weight of Evidence, the Futures charts and finishing with the Stages of the Major US Stock Market Indexes...
Read More
11 February, 2024
US Stocks Watchlist – 11 February 2024
There were 20 stocks highlighted from the US stocks watchlist scans today...
Read More