Stage Analysis members weekend video beginning with a look at the most recent US watchlist stocks, Significant Weekly Bars moving on volume, the new interactive GICS Sub-industries Bell Curve improvements, the Industry Groups Relative Strength (RS) Rankings, the key Market Breadth Charts to determine the Weight of Evidence, and the Major US Stock Market Indexes.
Read More

Blog
28 April, 2024
Stage Analysis Members Video – 28 April 2024 (1hr 4mins)
26 April, 2024
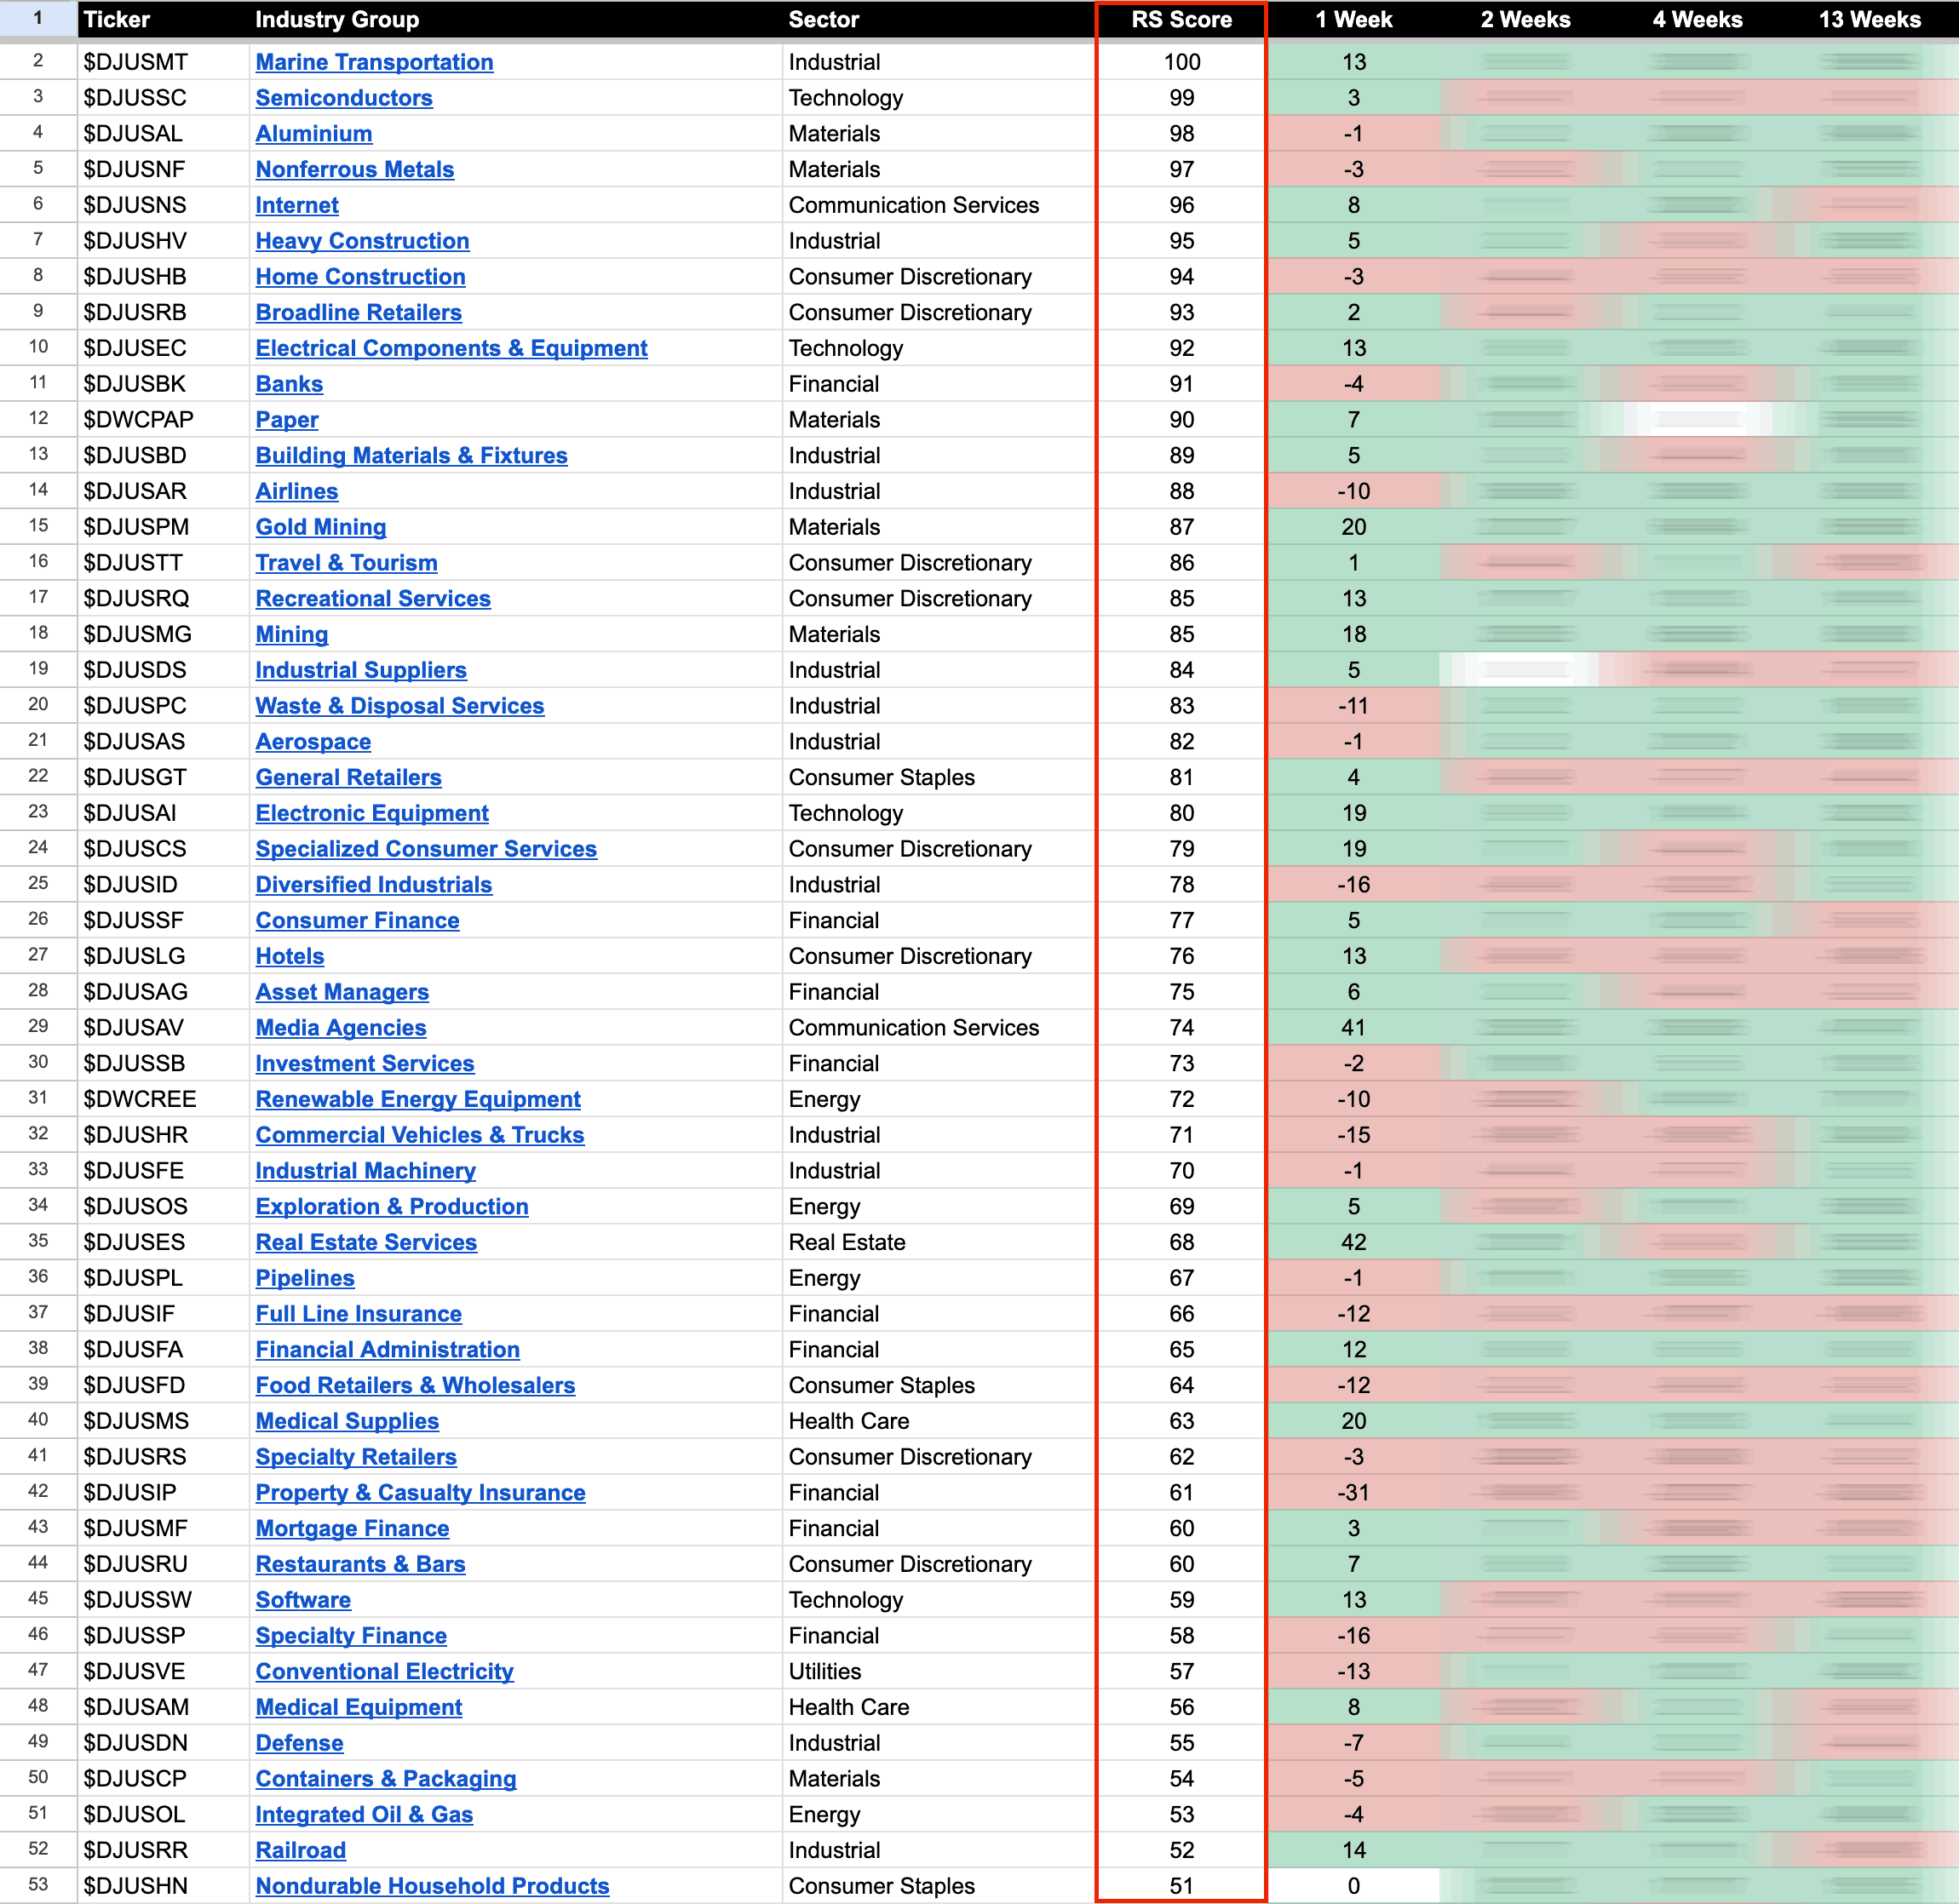
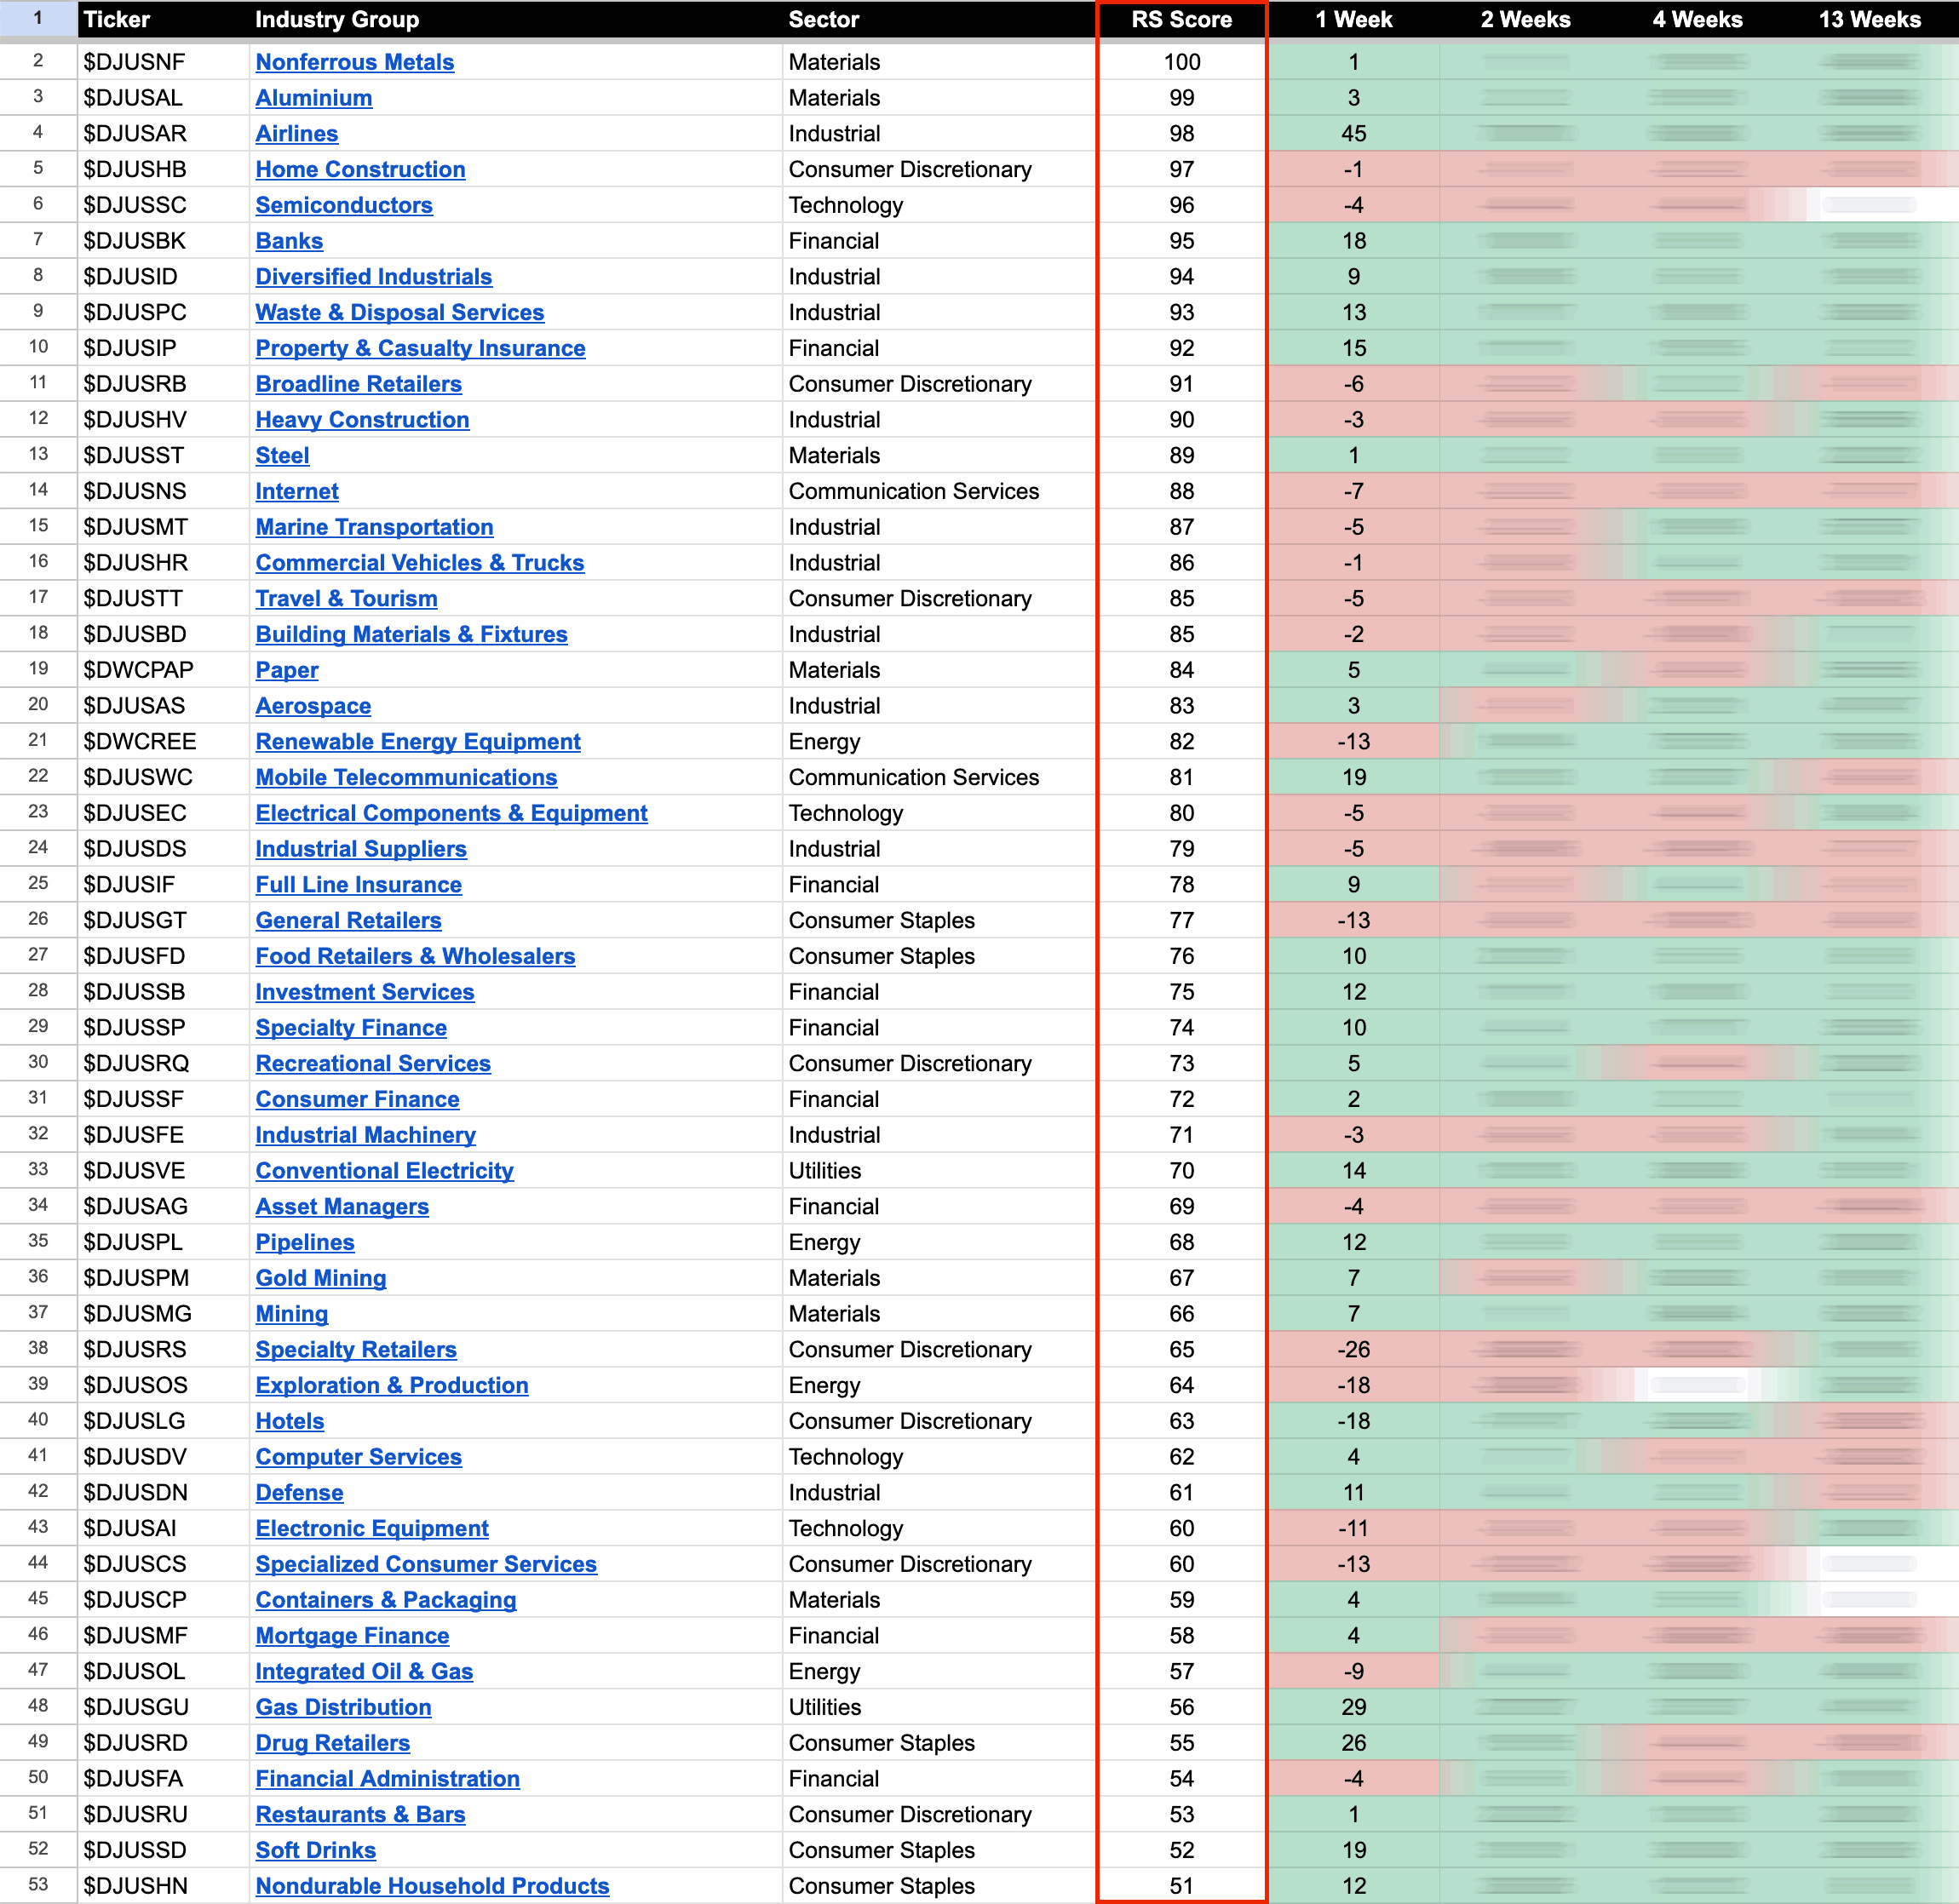
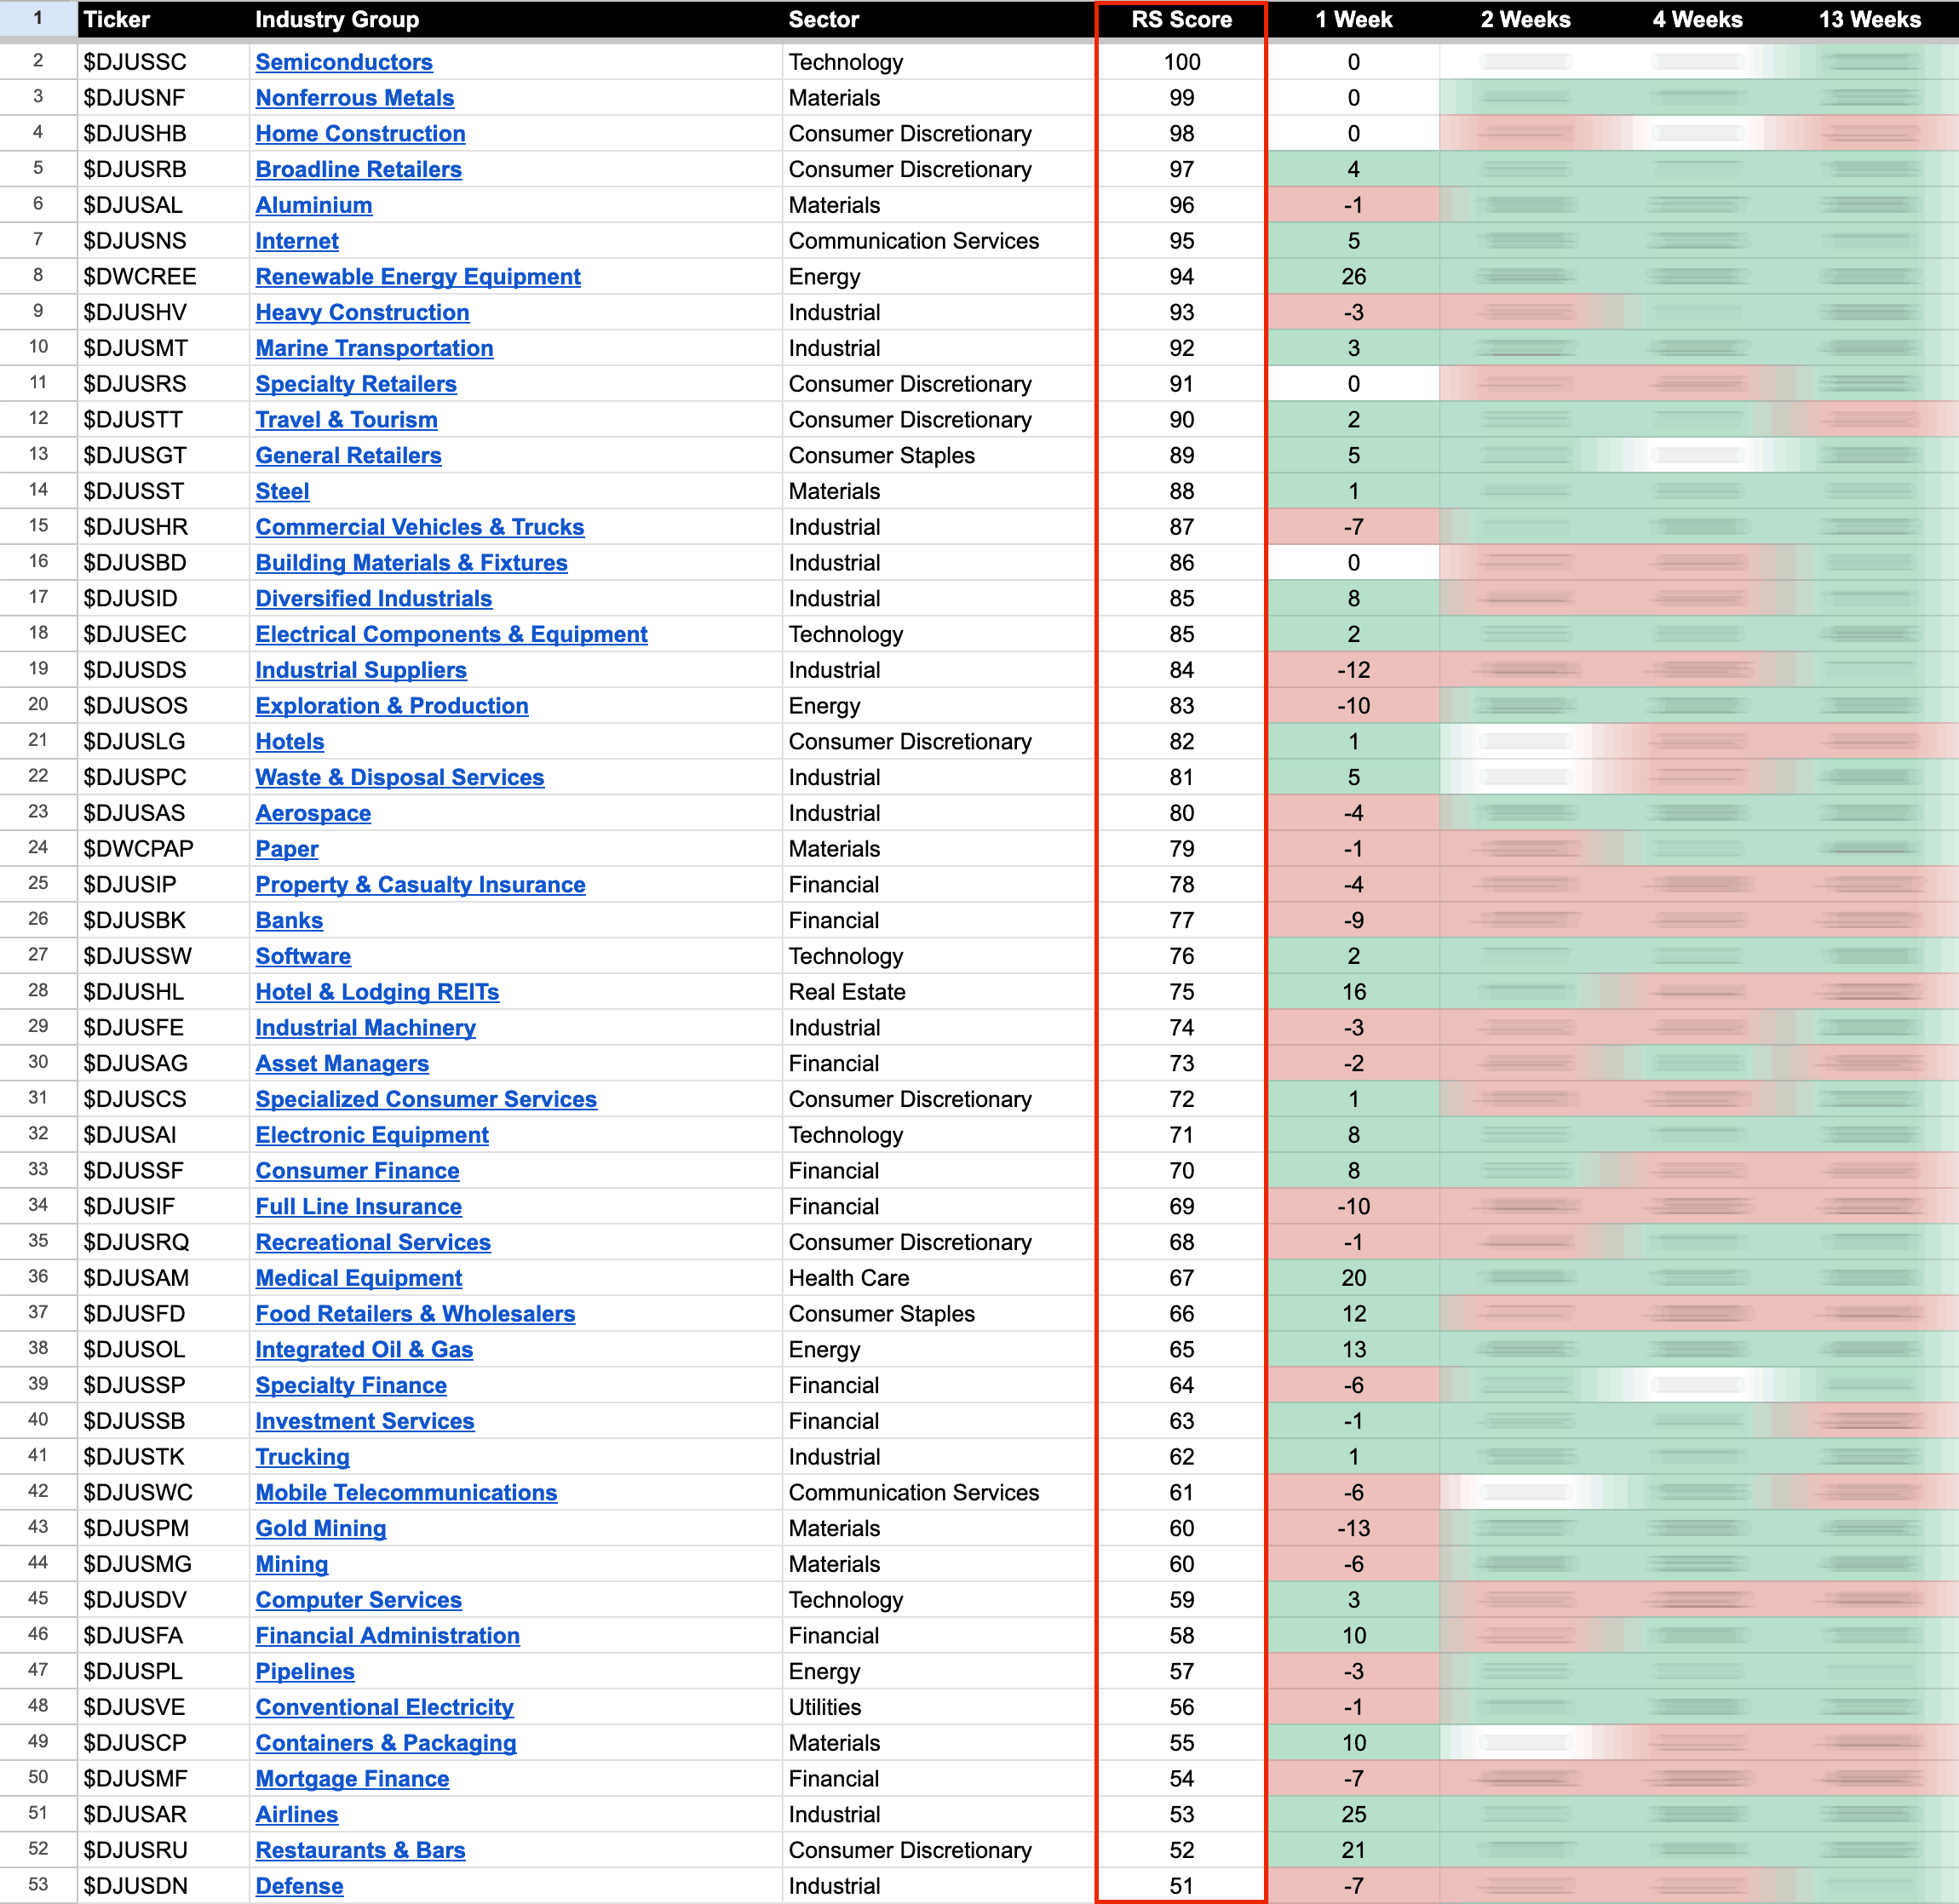
US Stocks Industry Groups Relative Strength Rankings
The purpose of the Relative Strength (RS) tables is to track the short, medium and long term RS changes of the individual groups to find the new leadership earlier than the crowd...
Read More
24 April, 2024
Video: New Features – 24 April 2024 (23mins)
Brief video discussing some of the new features added this week to the Stage Analysis website and a look at the current group and sector themes via the new interactive tools.
Read More
21 April, 2024
Stage Analysis Members Video – 21 April 2024 (56mins)
Stage Analysis members weekend video discussing the US watchlist stocks, Significant Weekly Bars moving on volume, the new interactive GICS Sub-industries Bell Curve, the Industry Groups Relative Strength (RS) Rankings, the key Market Breadth Charts to determine the Weight of Evidence, and the Major US Stock Market Indexes.
Read More
20 April, 2024
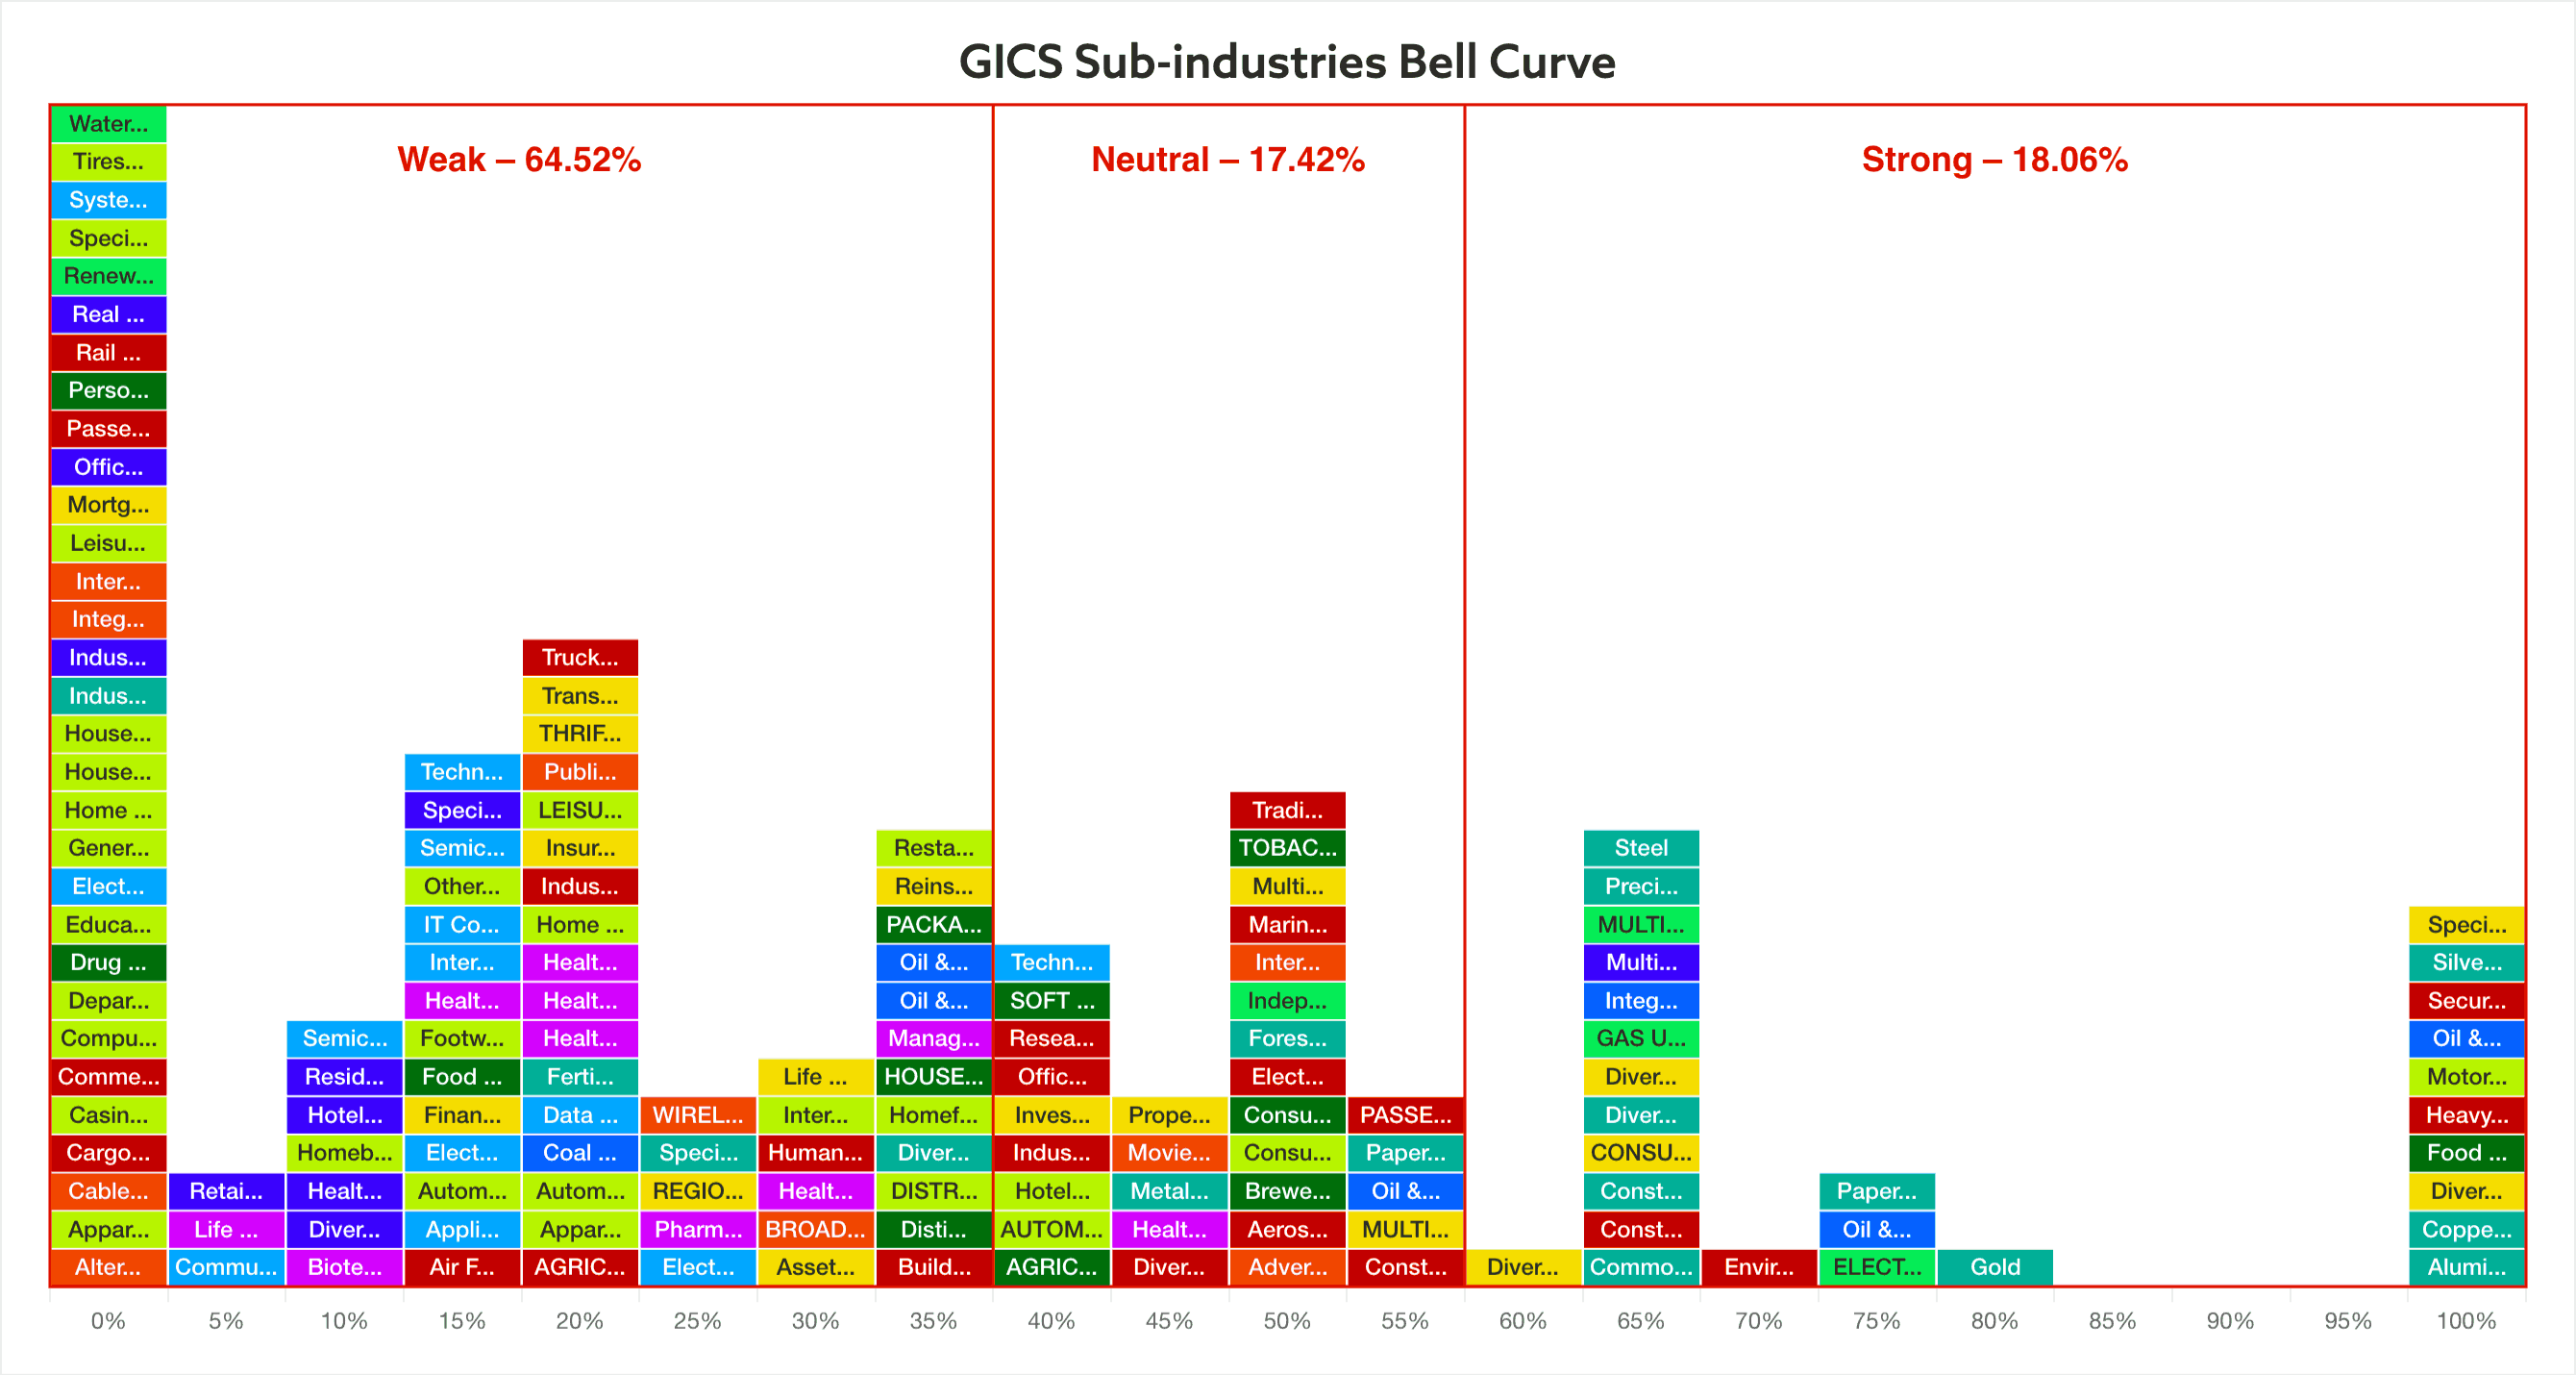
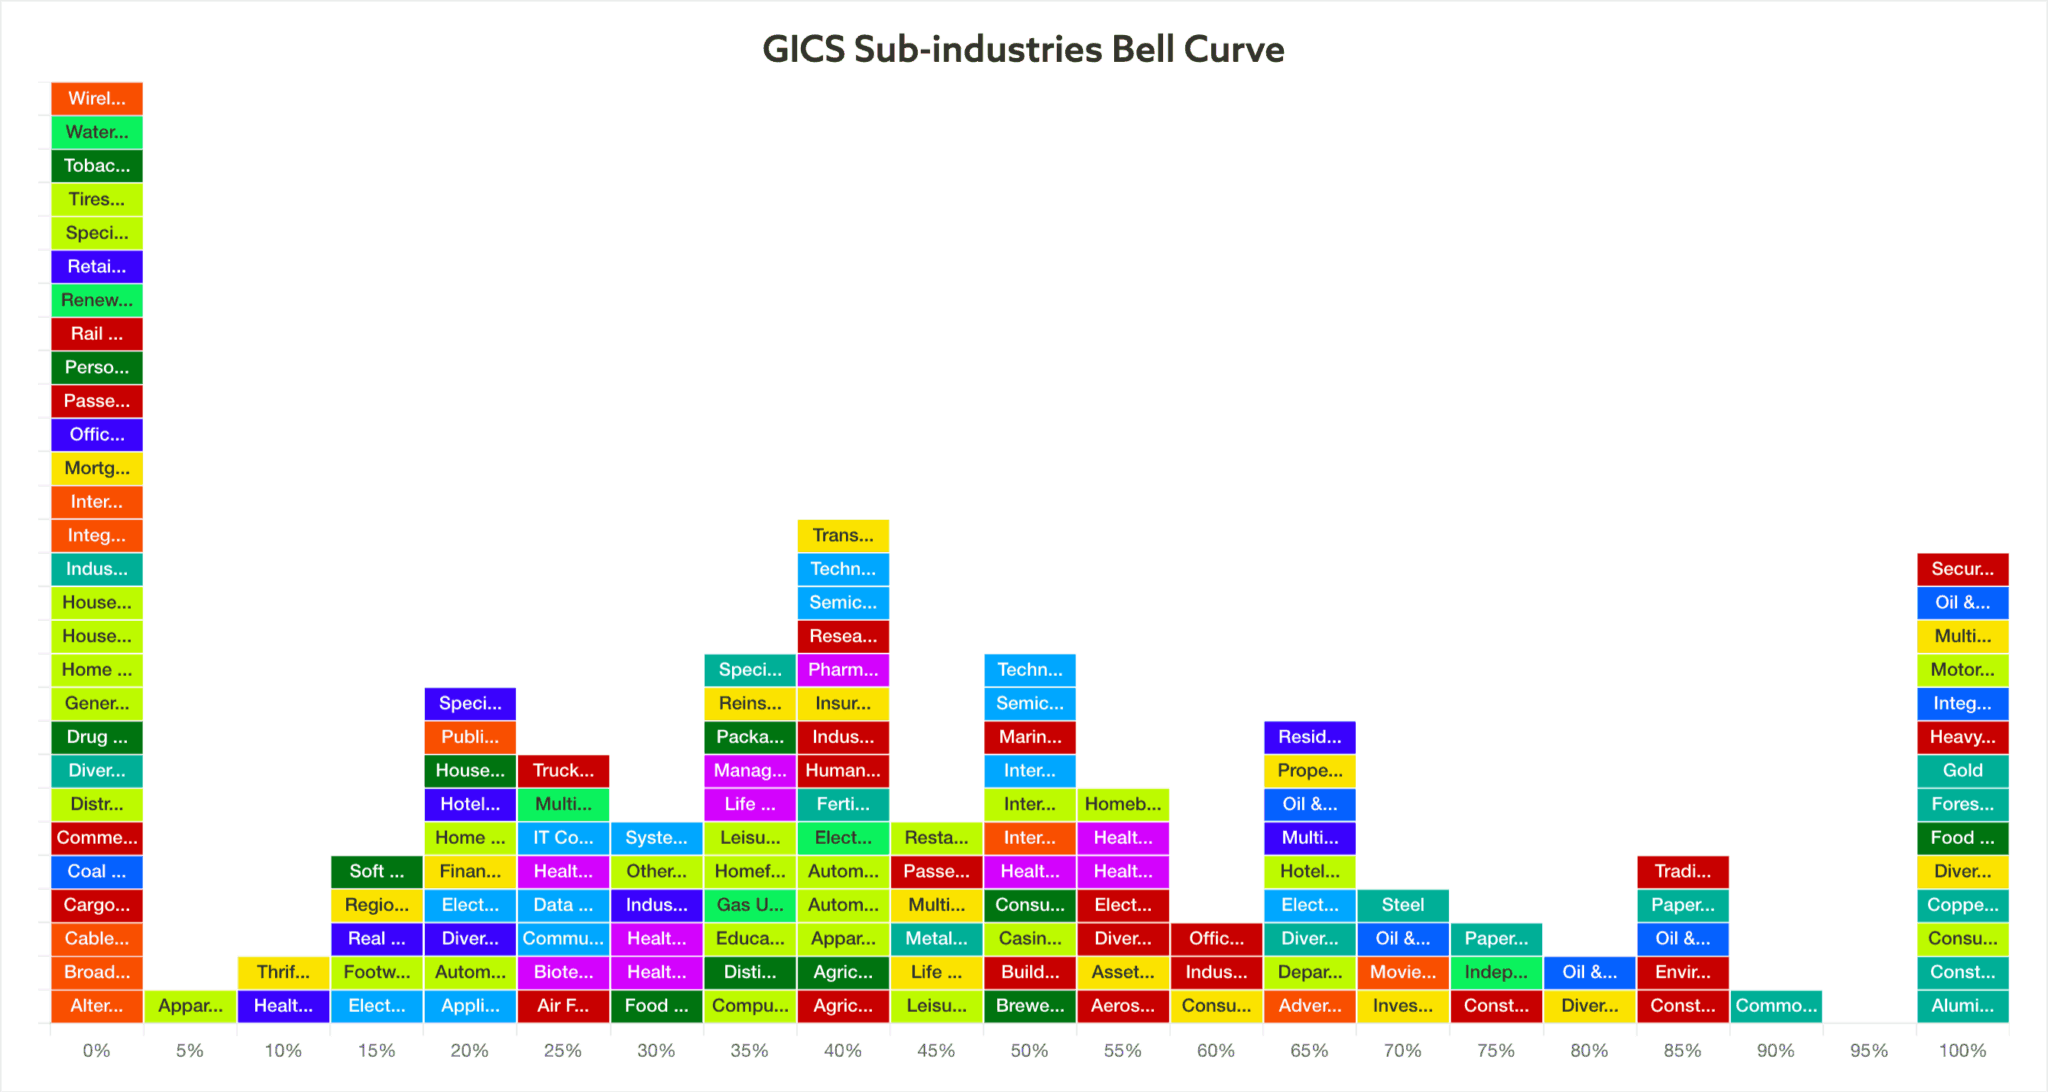
Video: GICS Sub-industries Bell Curve (10 mins)
Discussing the GICS Sub-industries on the move and explaining how to use Bell Curve interactive graphic and table.
Read More
19 April, 2024
US Stocks Industry Groups Relative Strength Rankings
The purpose of the Relative Strength (RS) tables is to track the short, medium and long term RS changes of the individual groups to find the new leadership earlier than the crowd...
Read More
14 April, 2024
Stage Analysis Members Video – 14 April 2024 (46mins)
Stage Analysis members weekend video discussing the Major US Stock Market Indexes, the Industry Groups Relative Strength (RS) Rankings, IBD Industry Group Bell Curve – Bullish Percent and transitioning to the new GICS Sub-industries Bell Curve data, the key Market Breadth Charts to determine the Weight of Evidence, this weeks Significant Weekly Bars moving on volume, and the US watchlist stocks.
Read More
13 April, 2024
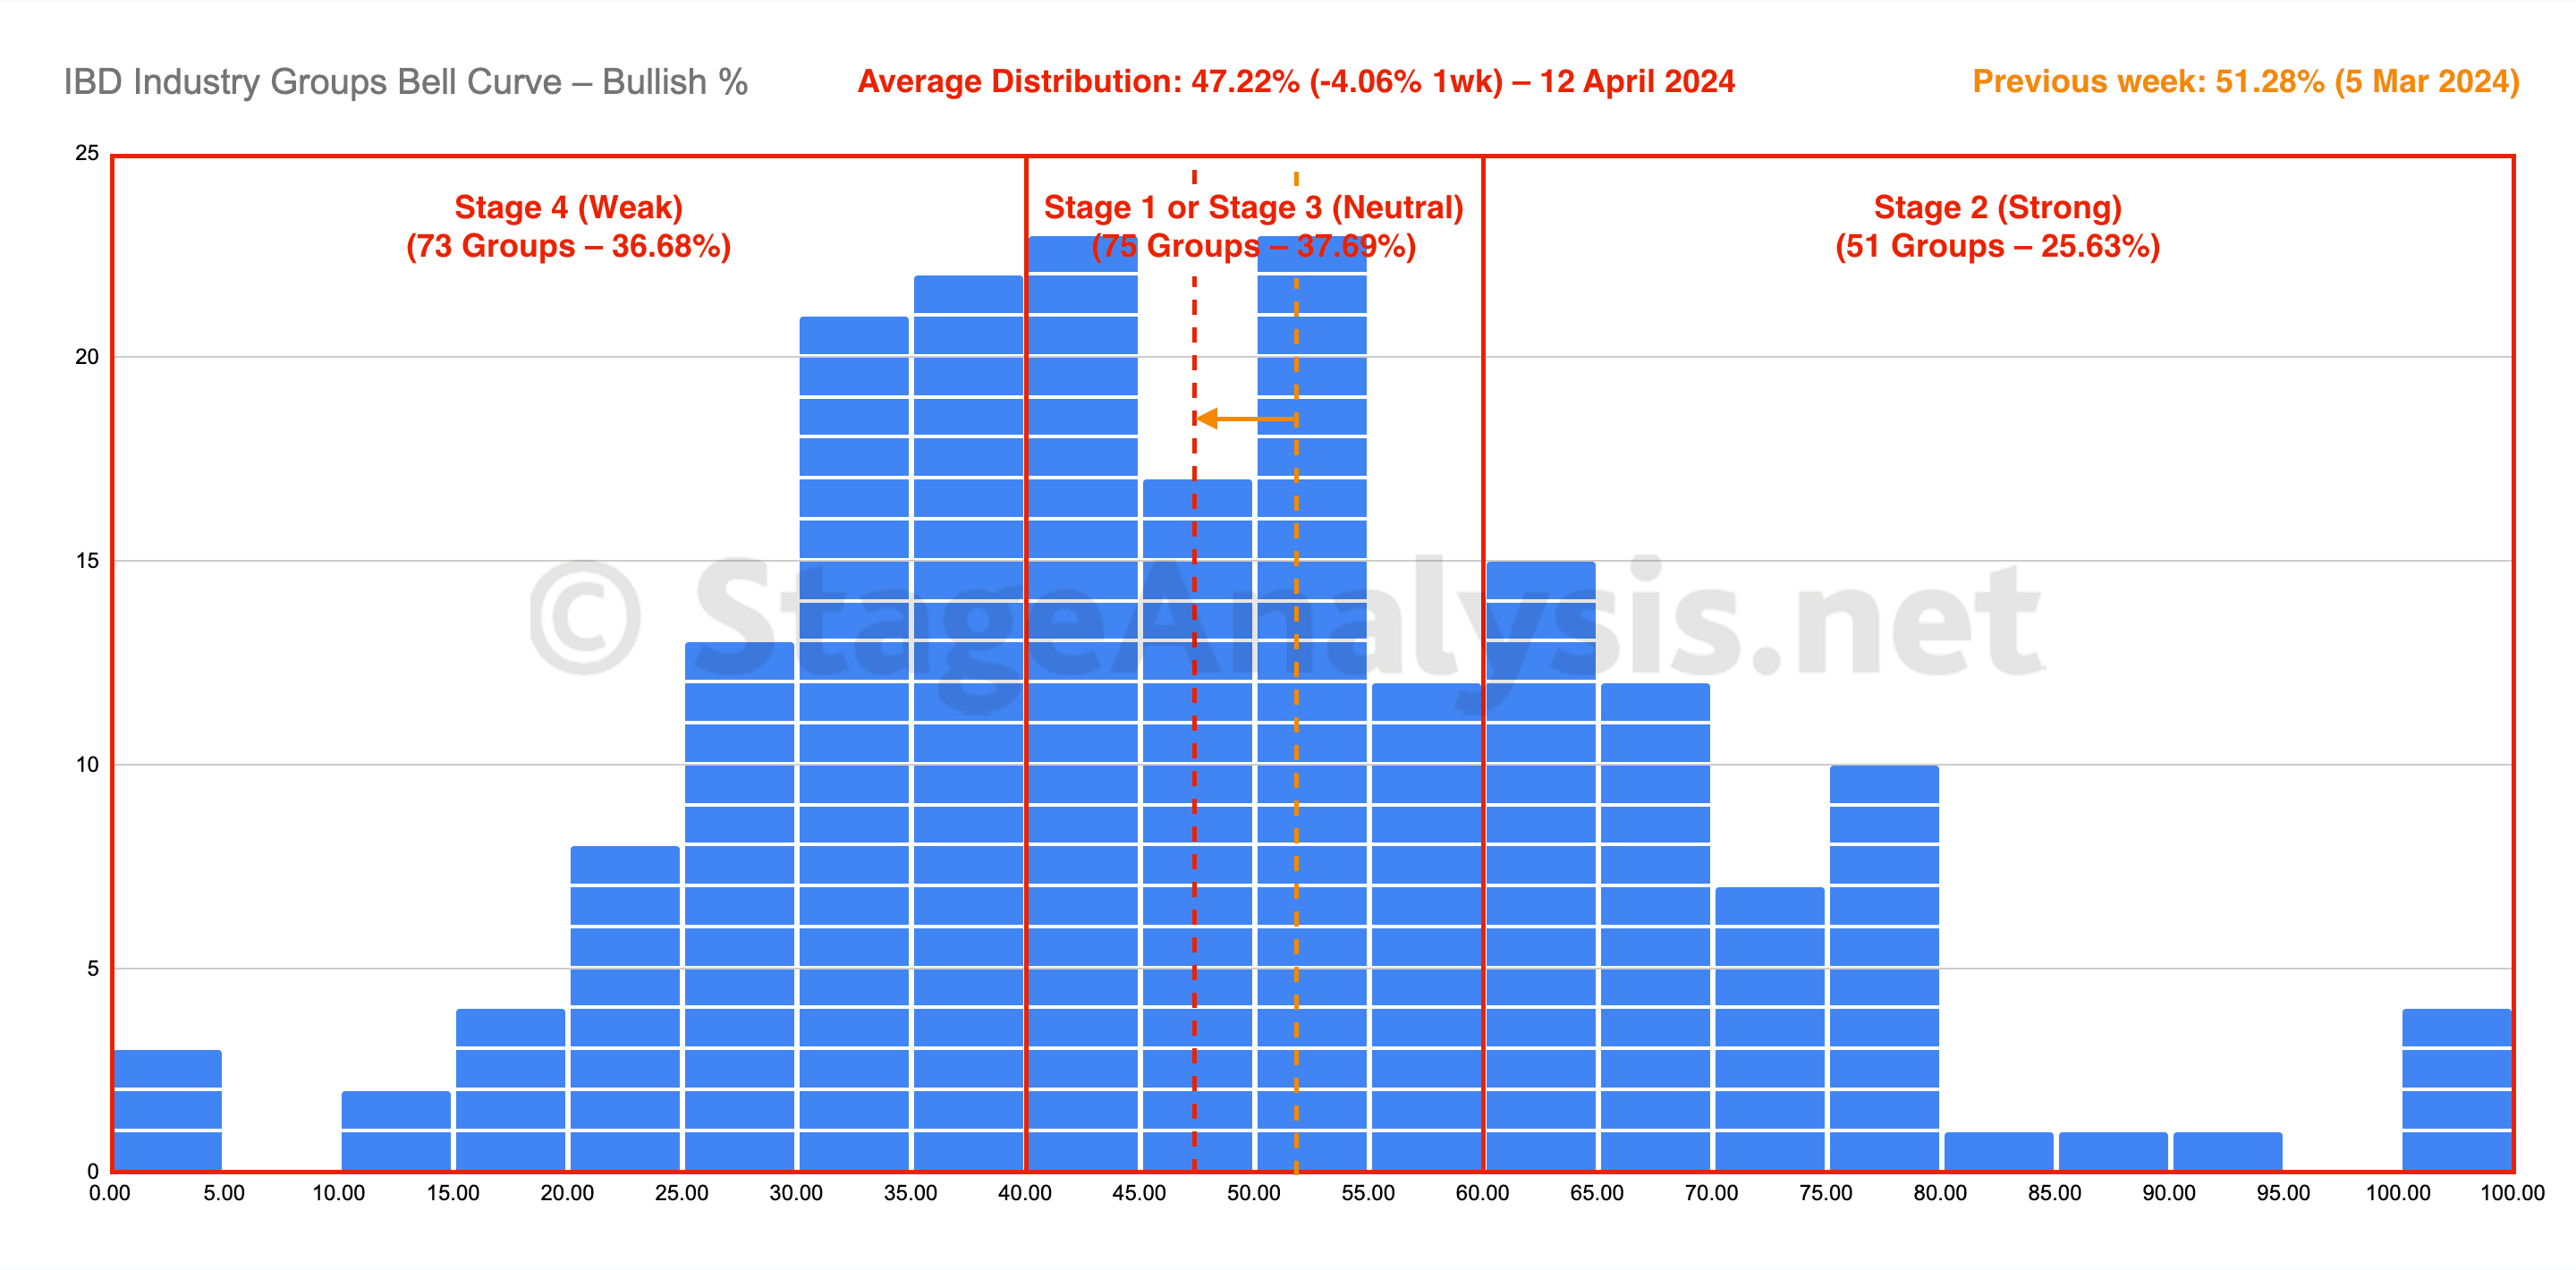
IBD Industry Groups Bell Curve – Bullish Percent
The IBD Industry Groups Bell Curve decreased by -4.06% this week to finish at 47.22% overall. The amount of groups in Stage 4 (Weak) increased by 15 (+7.5%), and the amount of groups in Stage 2 (Strong) decreased by 18 (-9%), while the amount groups in Stage 1 or Stage 3 (Neutral) increased by 3 (+1.5%).
Read More
12 April, 2024
US Stocks Industry Groups Relative Strength Rankings
The purpose of the Relative Strength (RS) tables is to track the short, medium and long term RS changes of the individual groups to find the new leadership earlier than the crowd...
Read More
10 April, 2024
Video: New Features – View GICS Sub-industries Stocks in the Bell Curve – 10 April 2024 (29mins)
Brief video highlighting some of the new features added this week to the Stage Analysis website for the members to use...
Read More