Stage Analysis members weekend video starting with a discussion of the Significant Weekly Bars, the US Watchlist Stocks in detail on multiple timeframes, the Sectors and Sub-industries Bell Curves, the key Market Breadth Charts to determine the Weight of Evidence and the Major US Stock Market Indexes Update.
Read More

Blog

18 August, 2024
Stage Analysis Members Video – 18 August 2024 (48mins)
17 August, 2024
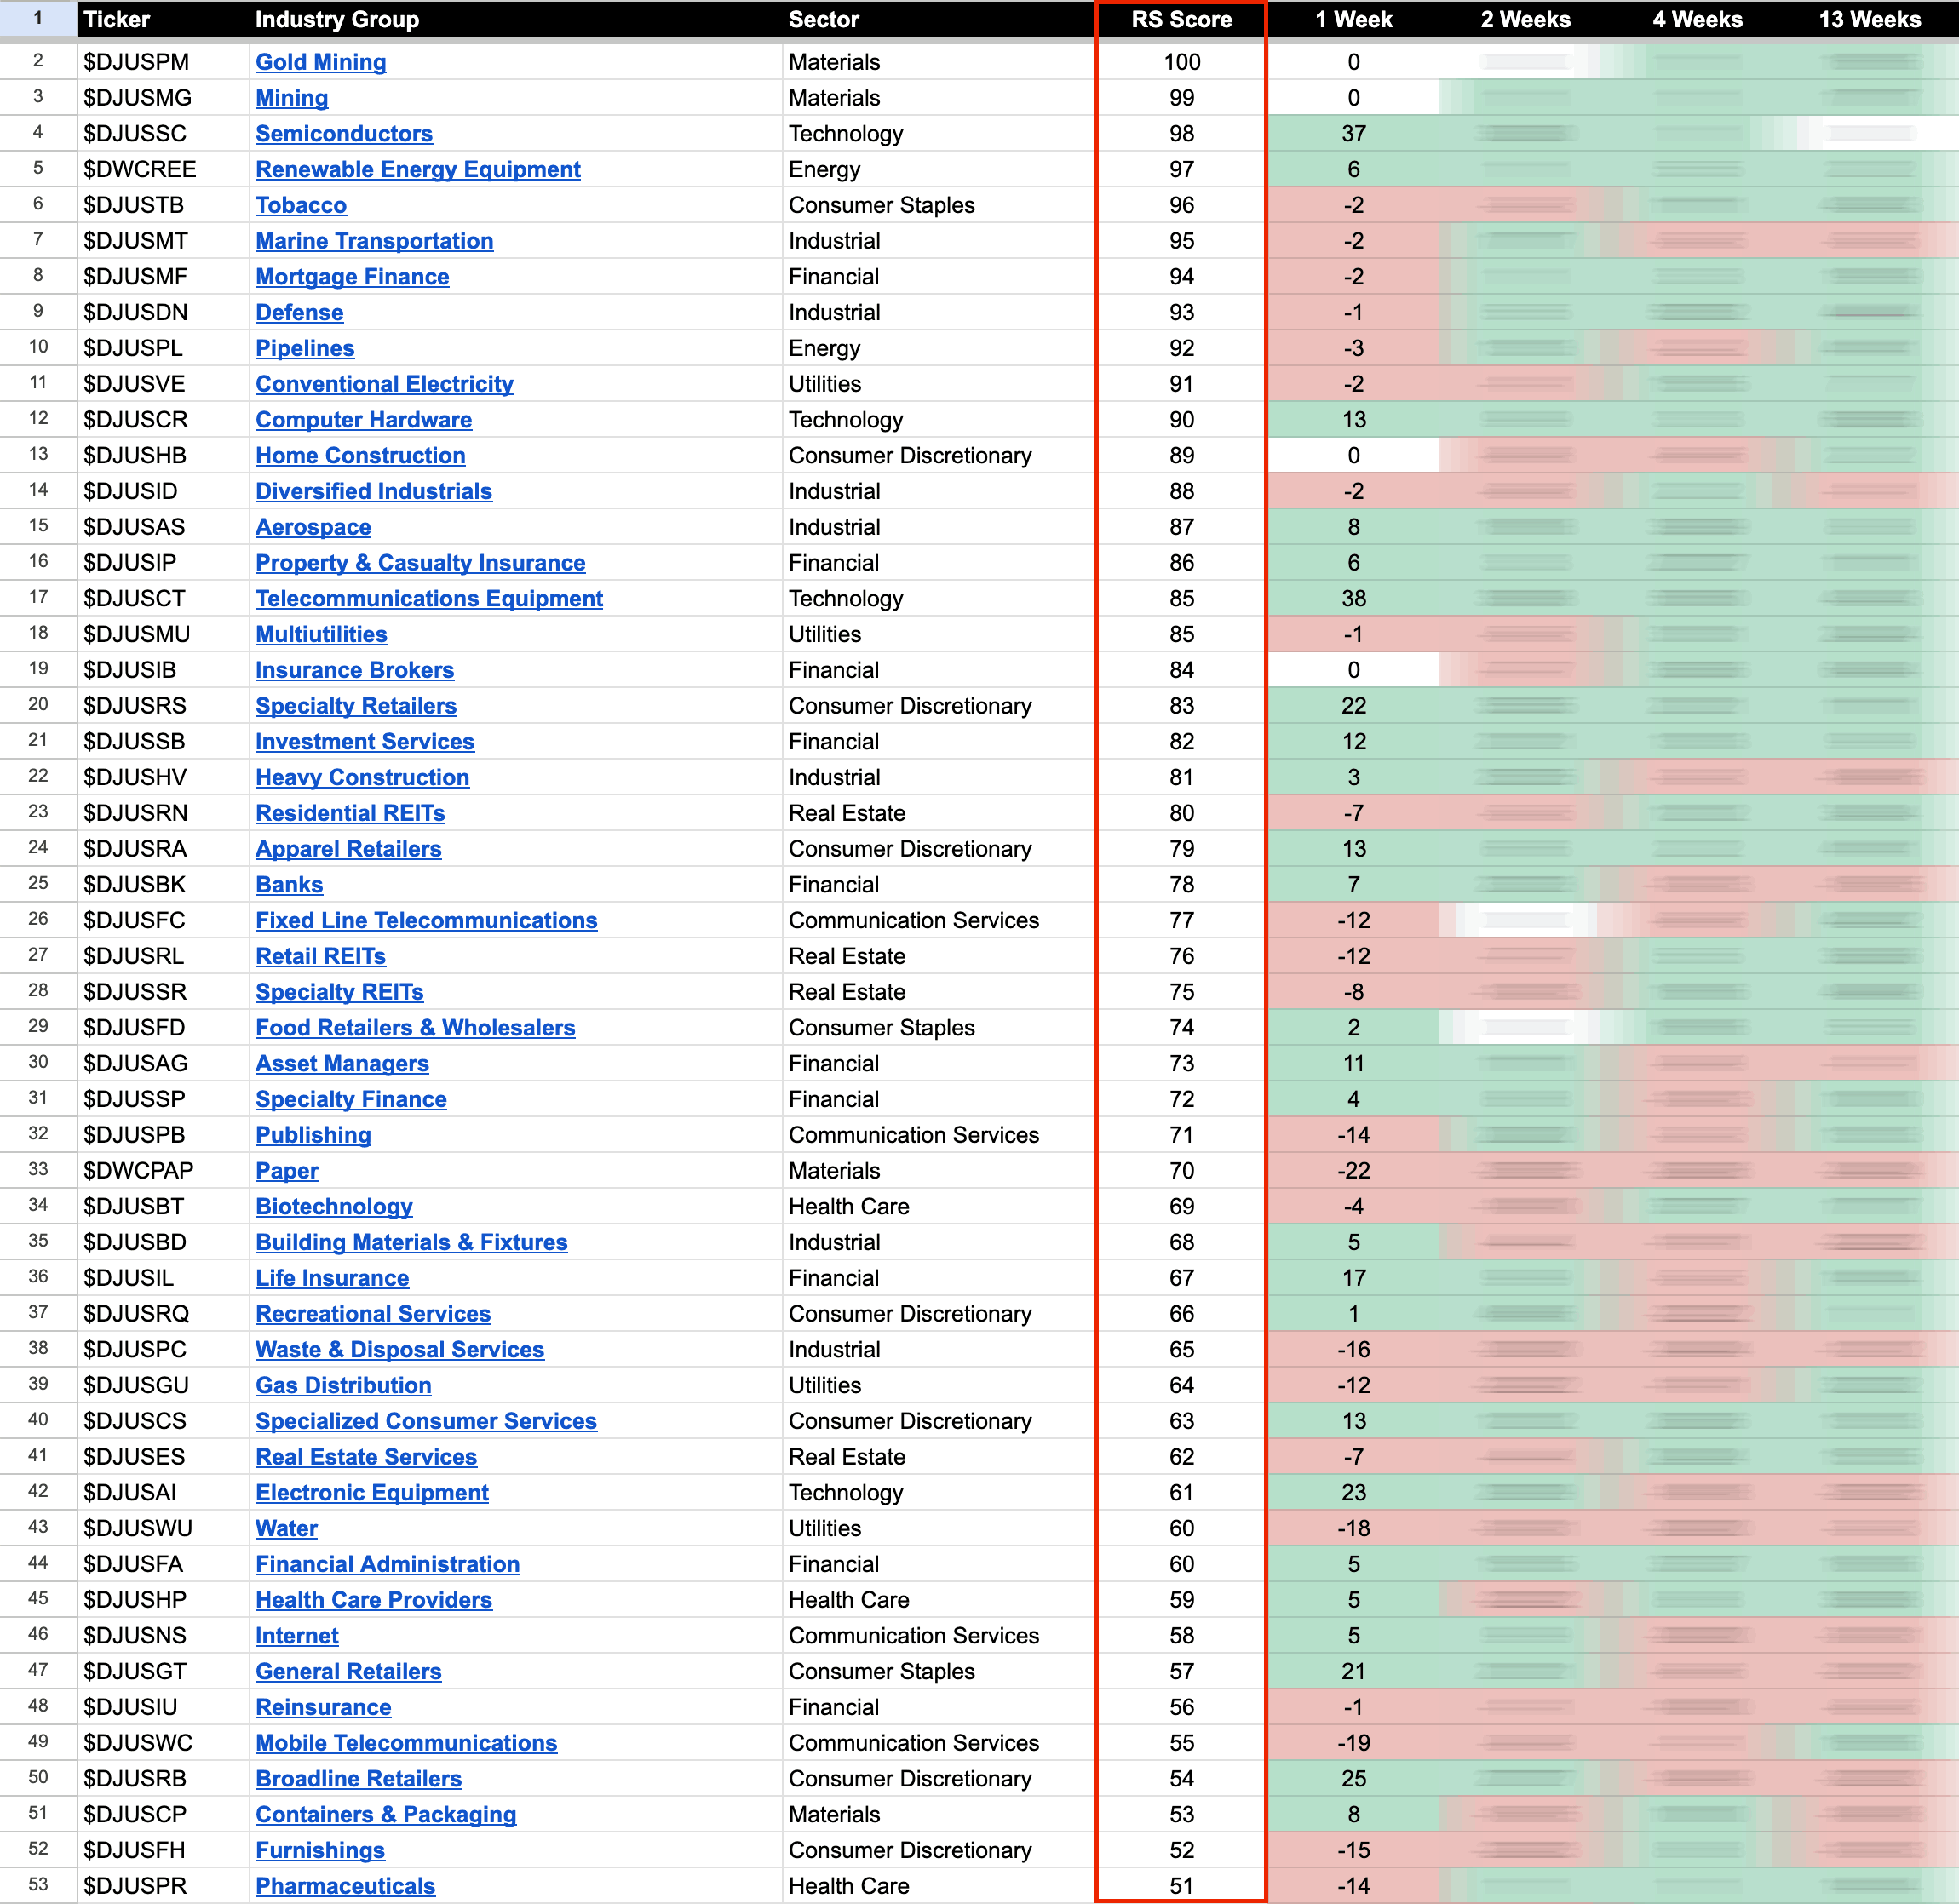
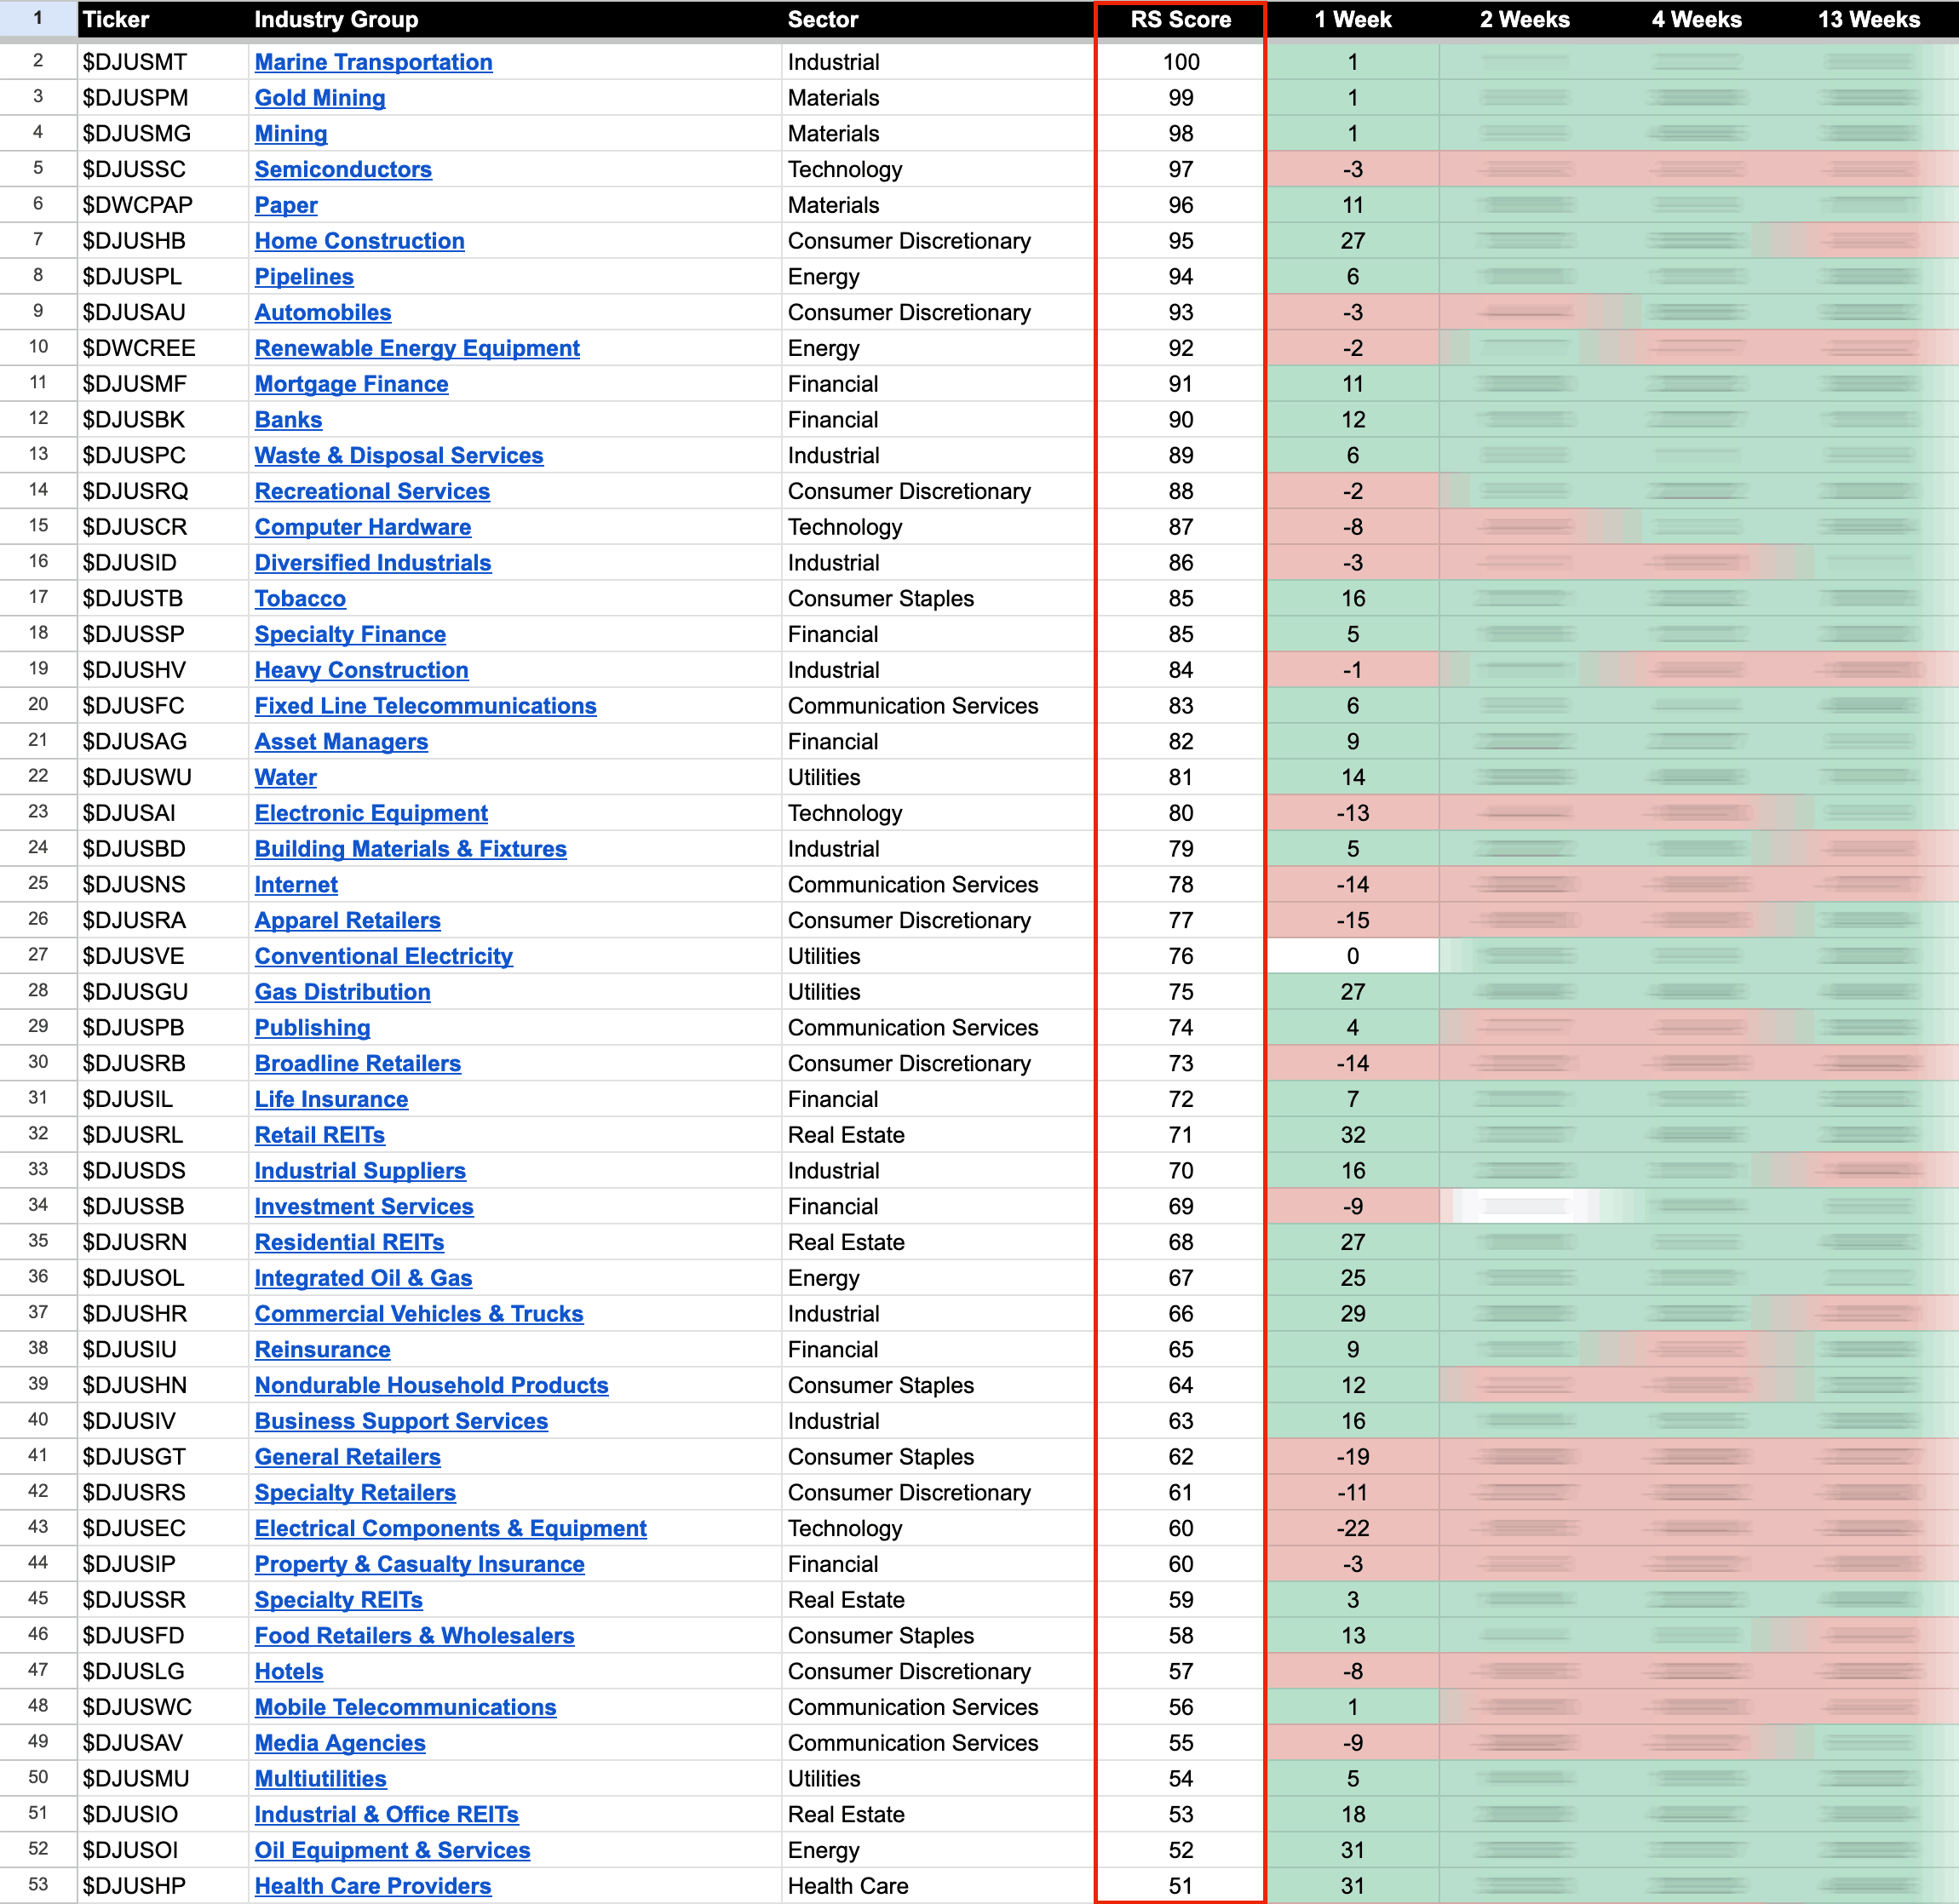
US Stocks Industry Groups Relative Strength Rankings
The purpose of the Relative Strength (RS) tables is to track the short, medium and long term RS changes of the individual groups to find the new leadership earlier than the crowd...
Read More
11 August, 2024
Stage Analysis Members Video – 11 August 2024 (58mins)
Stage Analysis members weekend video starting with a discussion of the Significant Weekly Bars, the Major US Stock Market Indexes, the Sectors and Sub-industries Bell Curves, the key Market Breadth Charts to determine the Weight of Evidence and the US Watchlist Stocks in detail on multiple timeframes
Read More
10 August, 2024
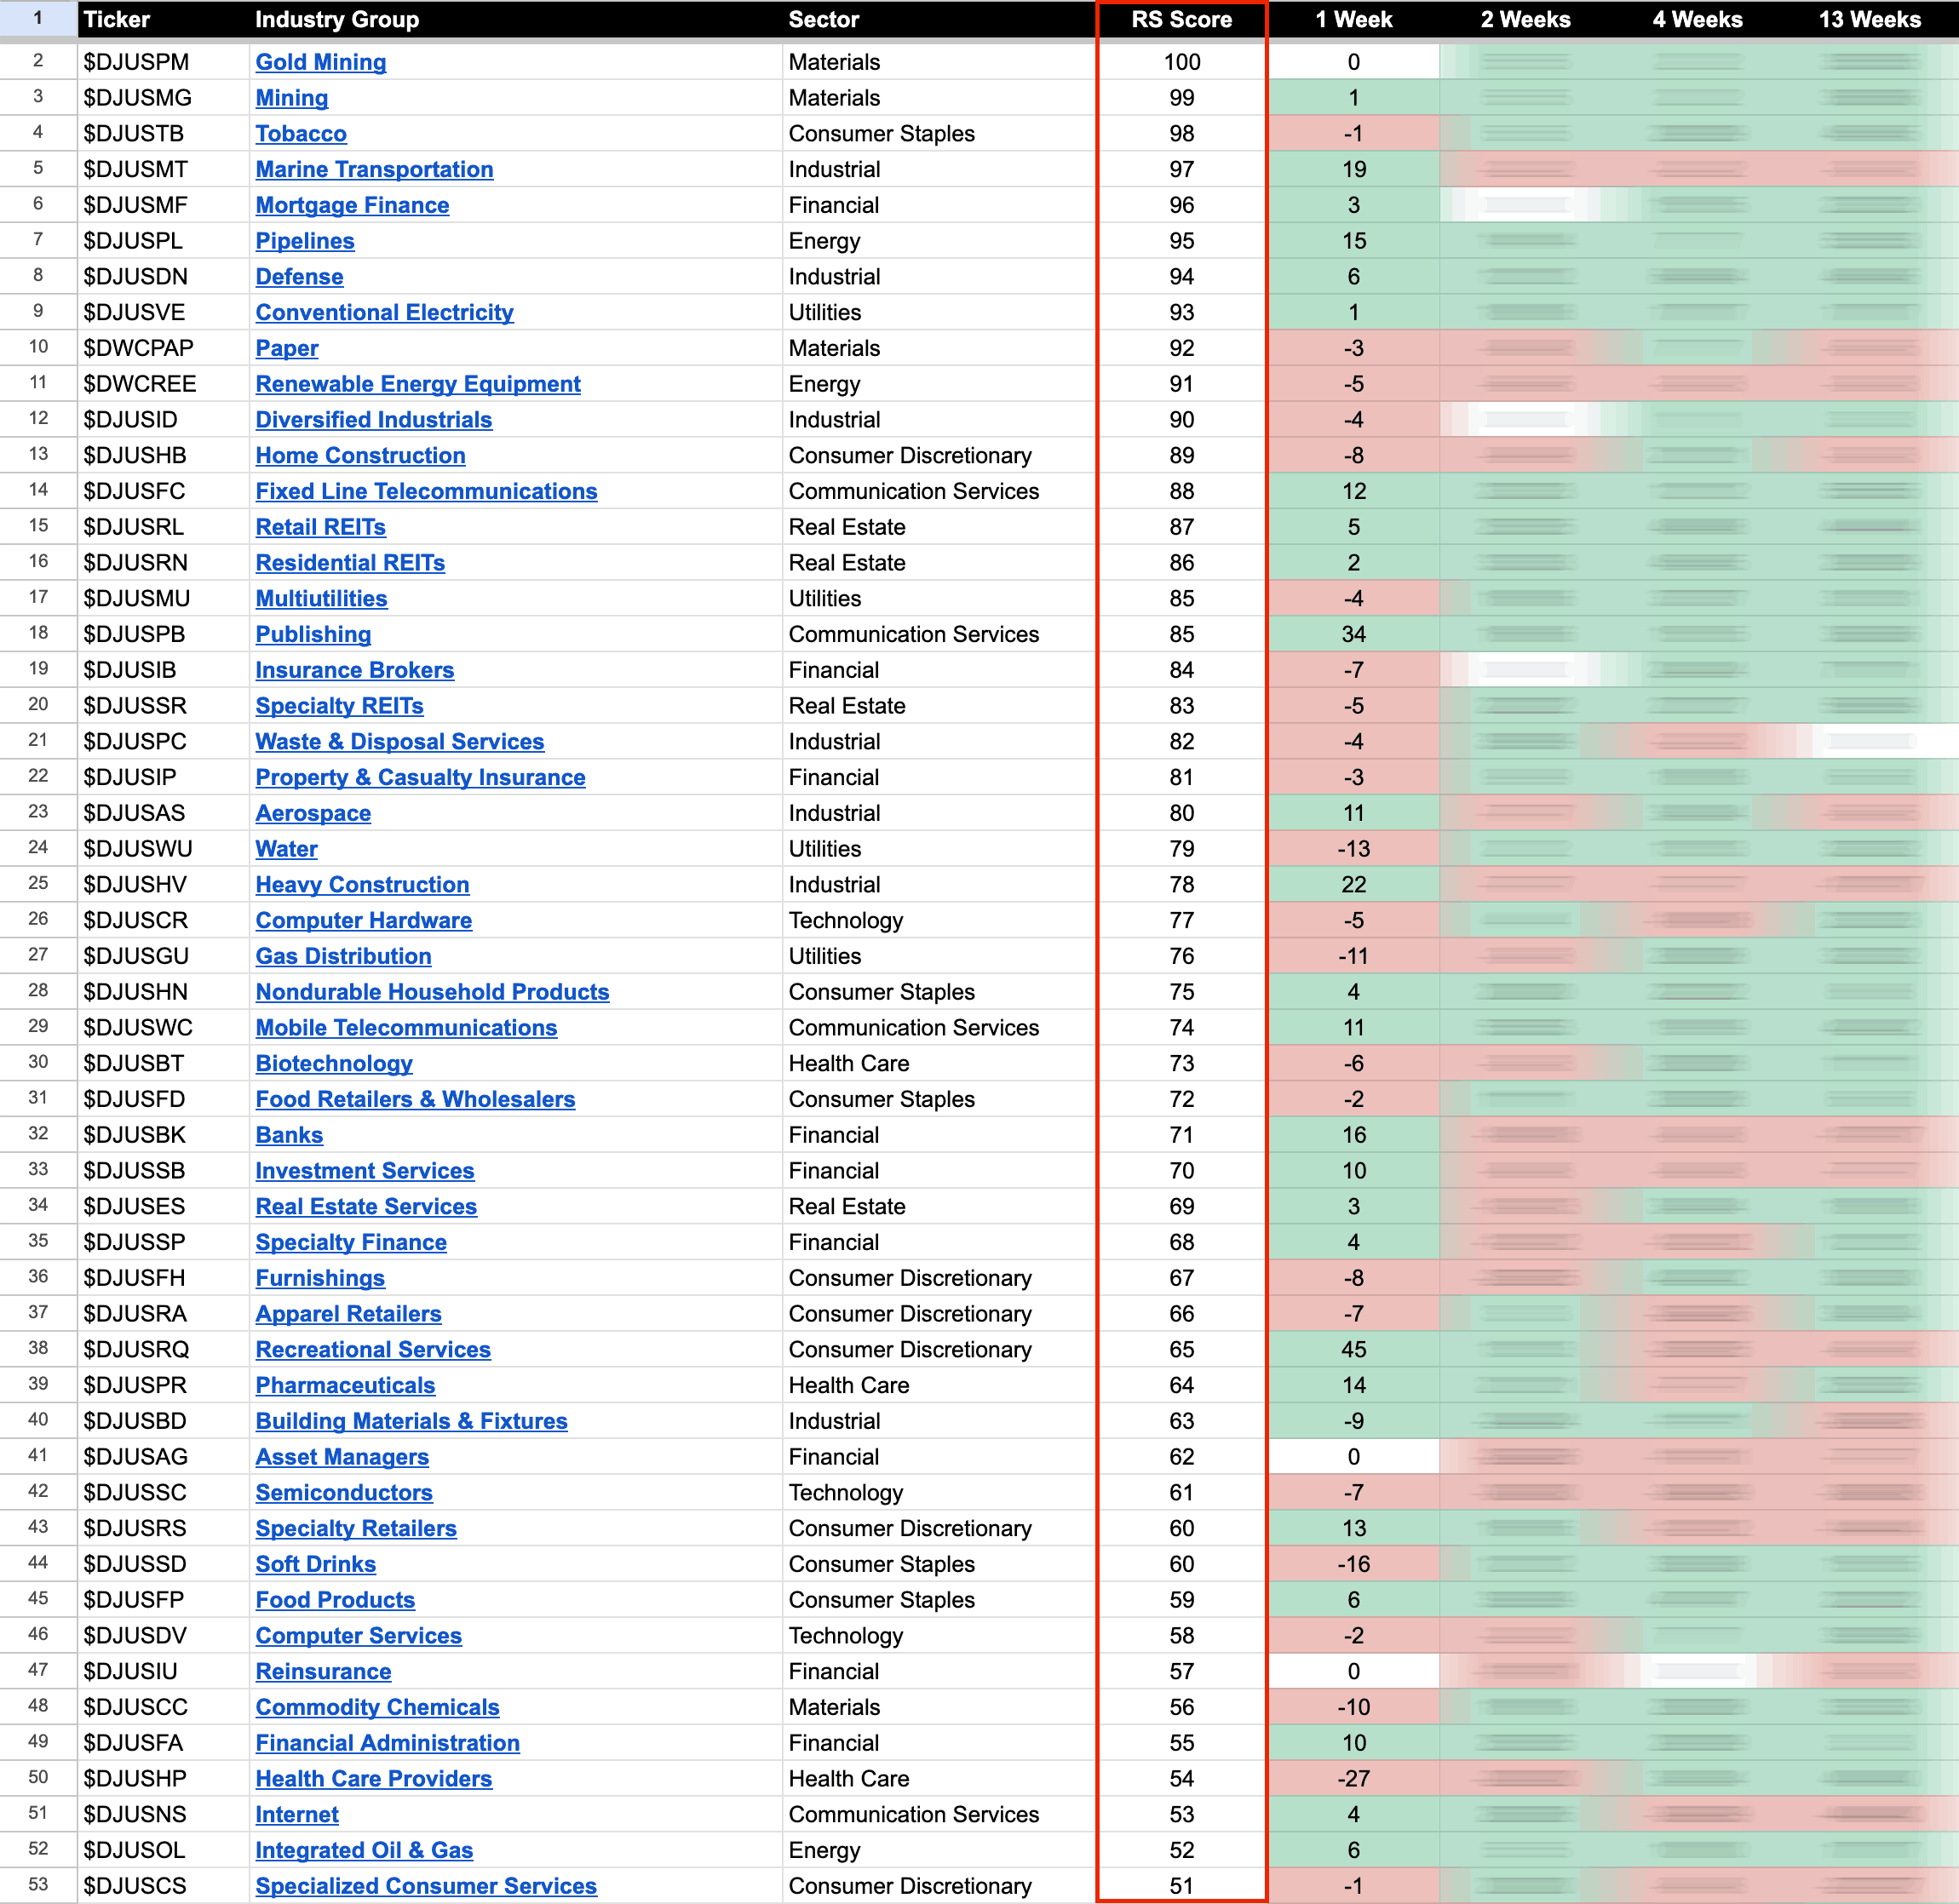
US Stocks Industry Groups Relative Strength Rankings
The purpose of the Relative Strength (RS) tables is to track the short, medium and long term RS changes of the individual groups to find the new leadership earlier than the crowd...
Read More
04 August, 2024
Stage Analysis Members Video – 4 August 2024 (45mins)
Stage Analysis members weekend video starting with a discussion about the Stage 4 breakdown attempt in Ethereum. Followed by the Major US Stock Market Indexes, the Sector Breadth and Sub-industry Bell Curve, the key Market Breadth Charts to determine the Weight of Evidence and a look at some of the stocks with upcoming earnings this coming week.
Read More
03 August, 2024
US Stocks Industry Groups Relative Strength Rankings
The purpose of the Relative Strength (RS) tables is to track the short, medium and long term RS changes of the individual groups to find the new leadership earlier than the crowd...
Read More
28 July, 2024
Stage Analysis Members Video – 28 July 2024 (59mins)
Stage Analysis members weekend video starting with a discussion of the US Watchlist Stocks in detail on multiple timeframes, the Industry Groups Relative Strength (RS) Rankings and GICS Group, Industry and Sub-industry Bell Curves with notable changes, the key Market Breadth Charts to determine the Weight of Evidence, Significant Weekly Bars, and the Major US Stock Market Indexes.
Read More
26 July, 2024
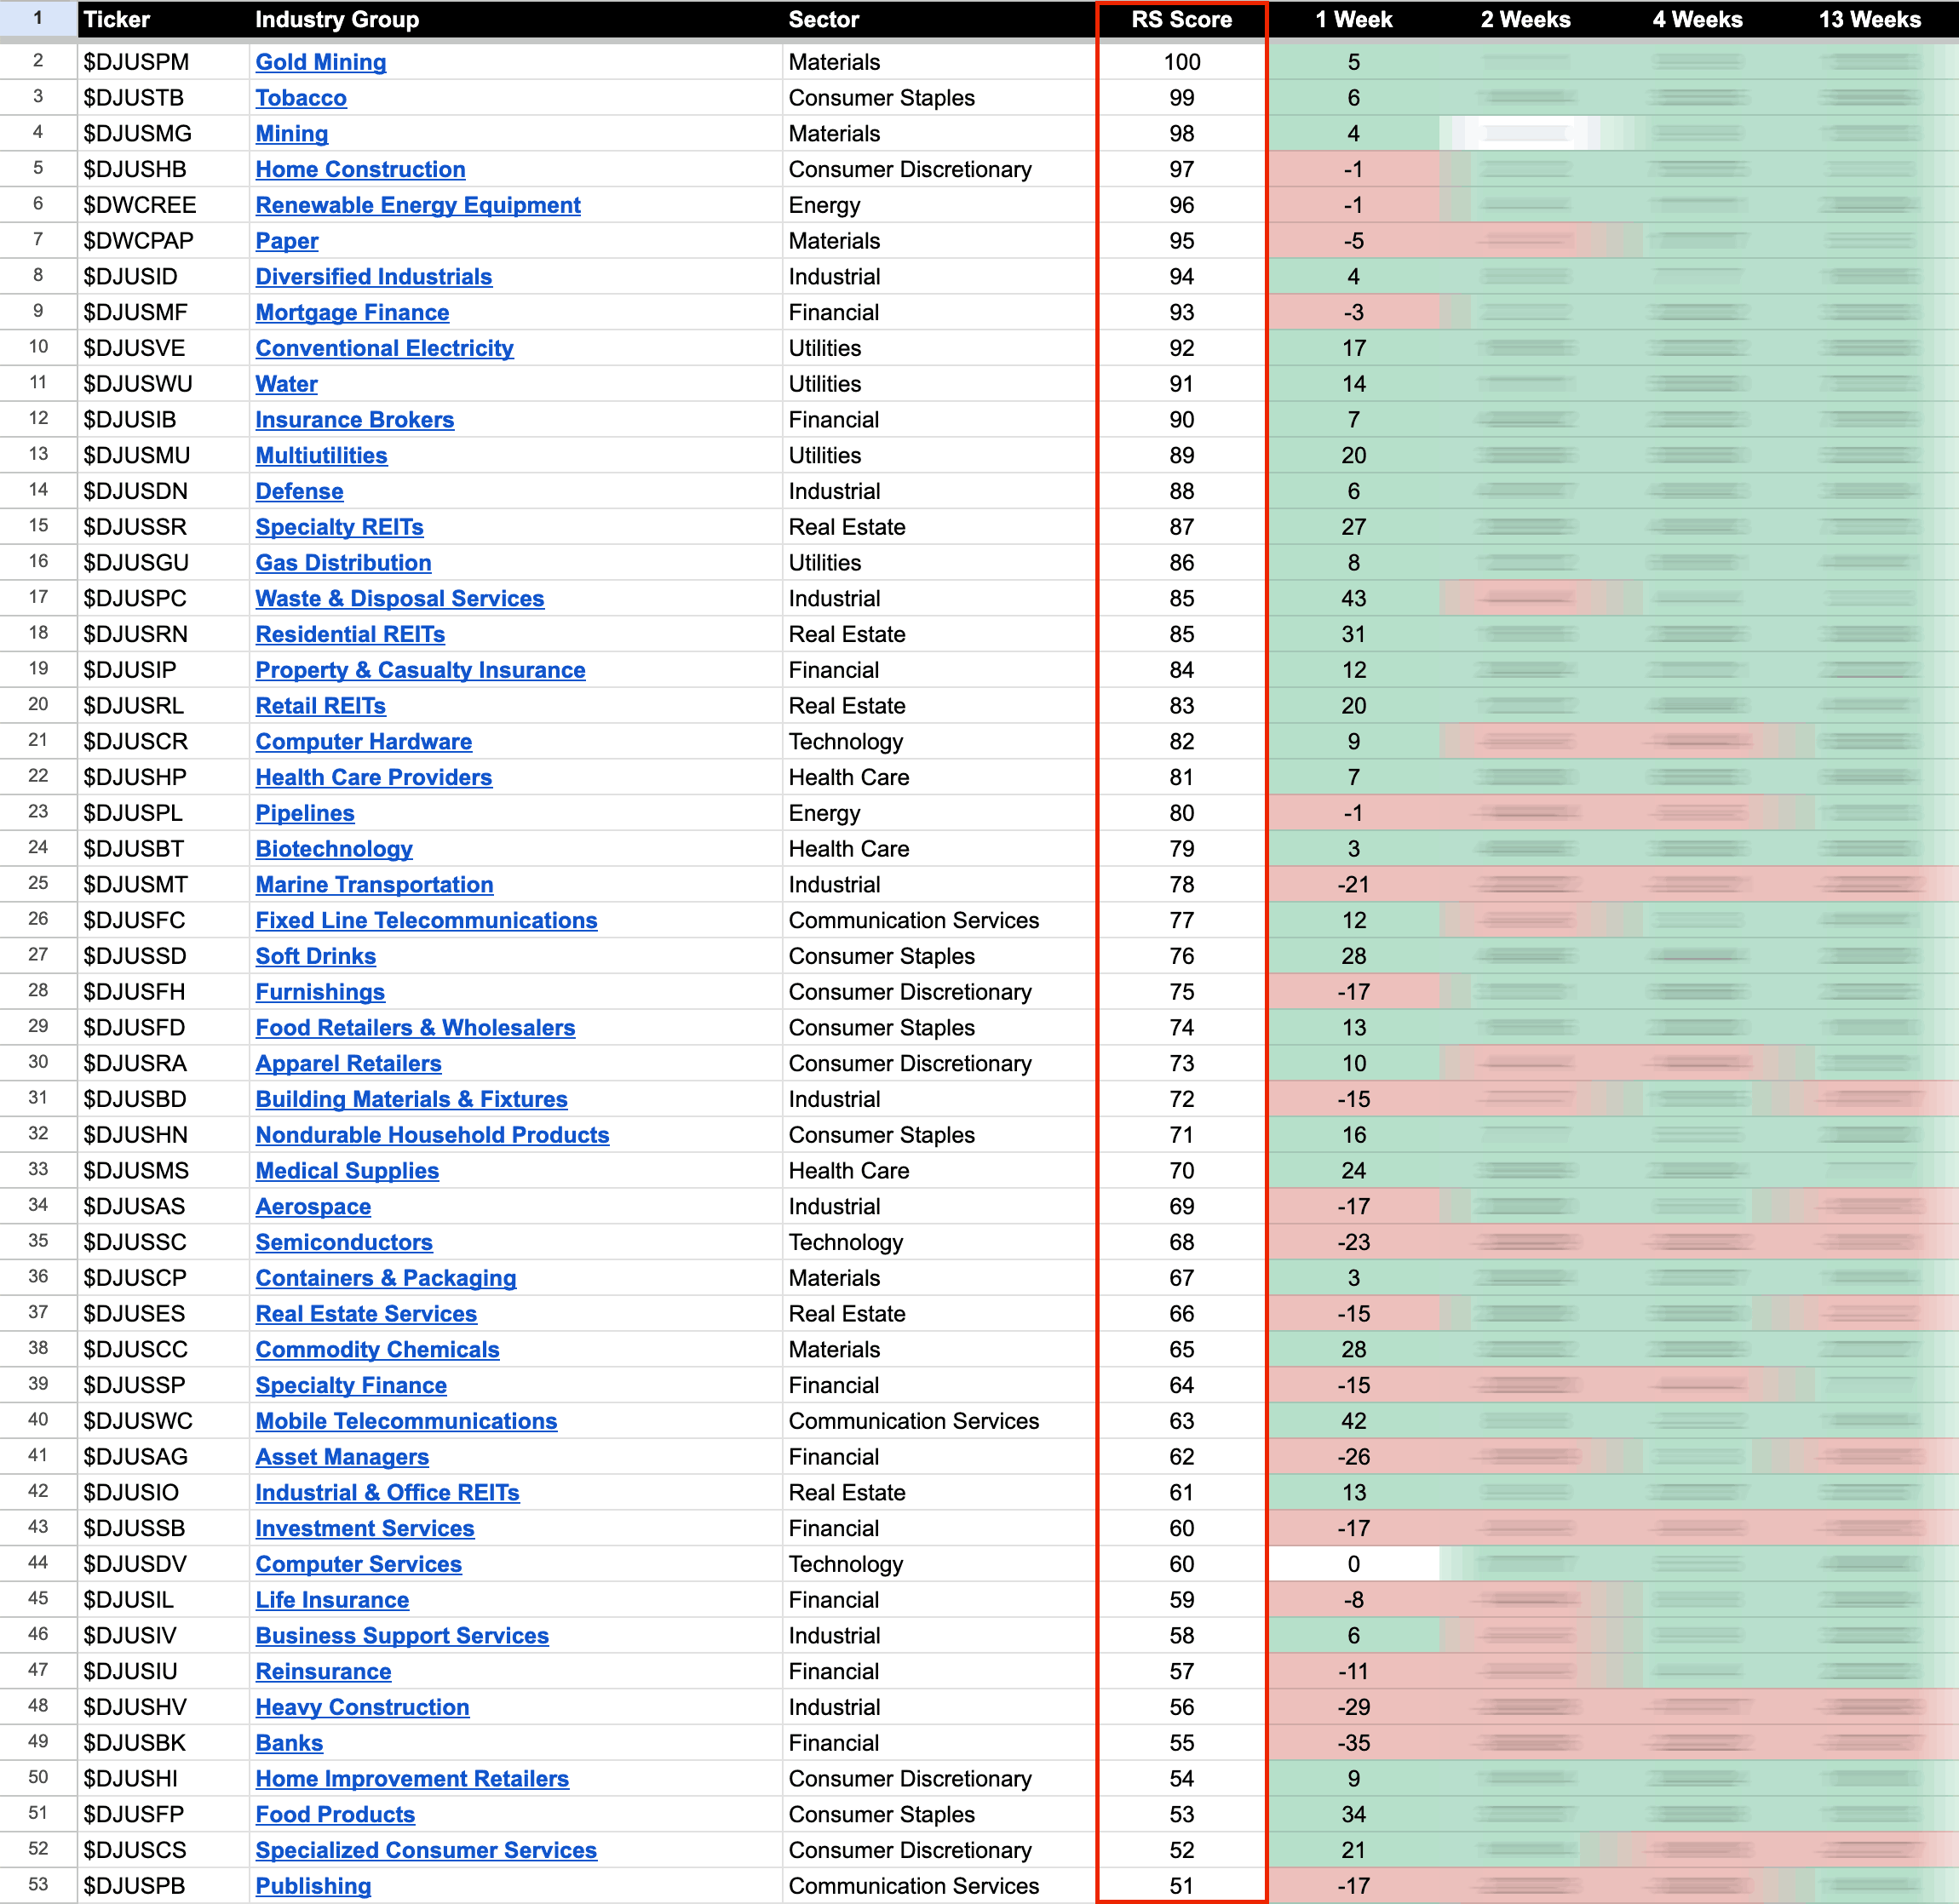
US Stocks Industry Groups Relative Strength Rankings
The purpose of the Relative Strength (RS) tables is to track the short, medium and long term RS changes of the individual groups to find the new leadership earlier than the crowd...
Read More
21 July, 2024
Stage Analysis Members Video – 21 July 2024 (52mins)
Stage Analysis members weekend video starting with a discussion of the US Watchlist Stocks in detail on multiple timeframes, the Industry Groups Relative Strength (RS) Rankings and GICS Group, Industry and Sub-industry Bell Curves with notable changes, the key Market Breadth Charts to determine the Weight of Evidence, Significant Weekly Bars, and the Major US Stock Market Indexes.
Read More
19 July, 2024
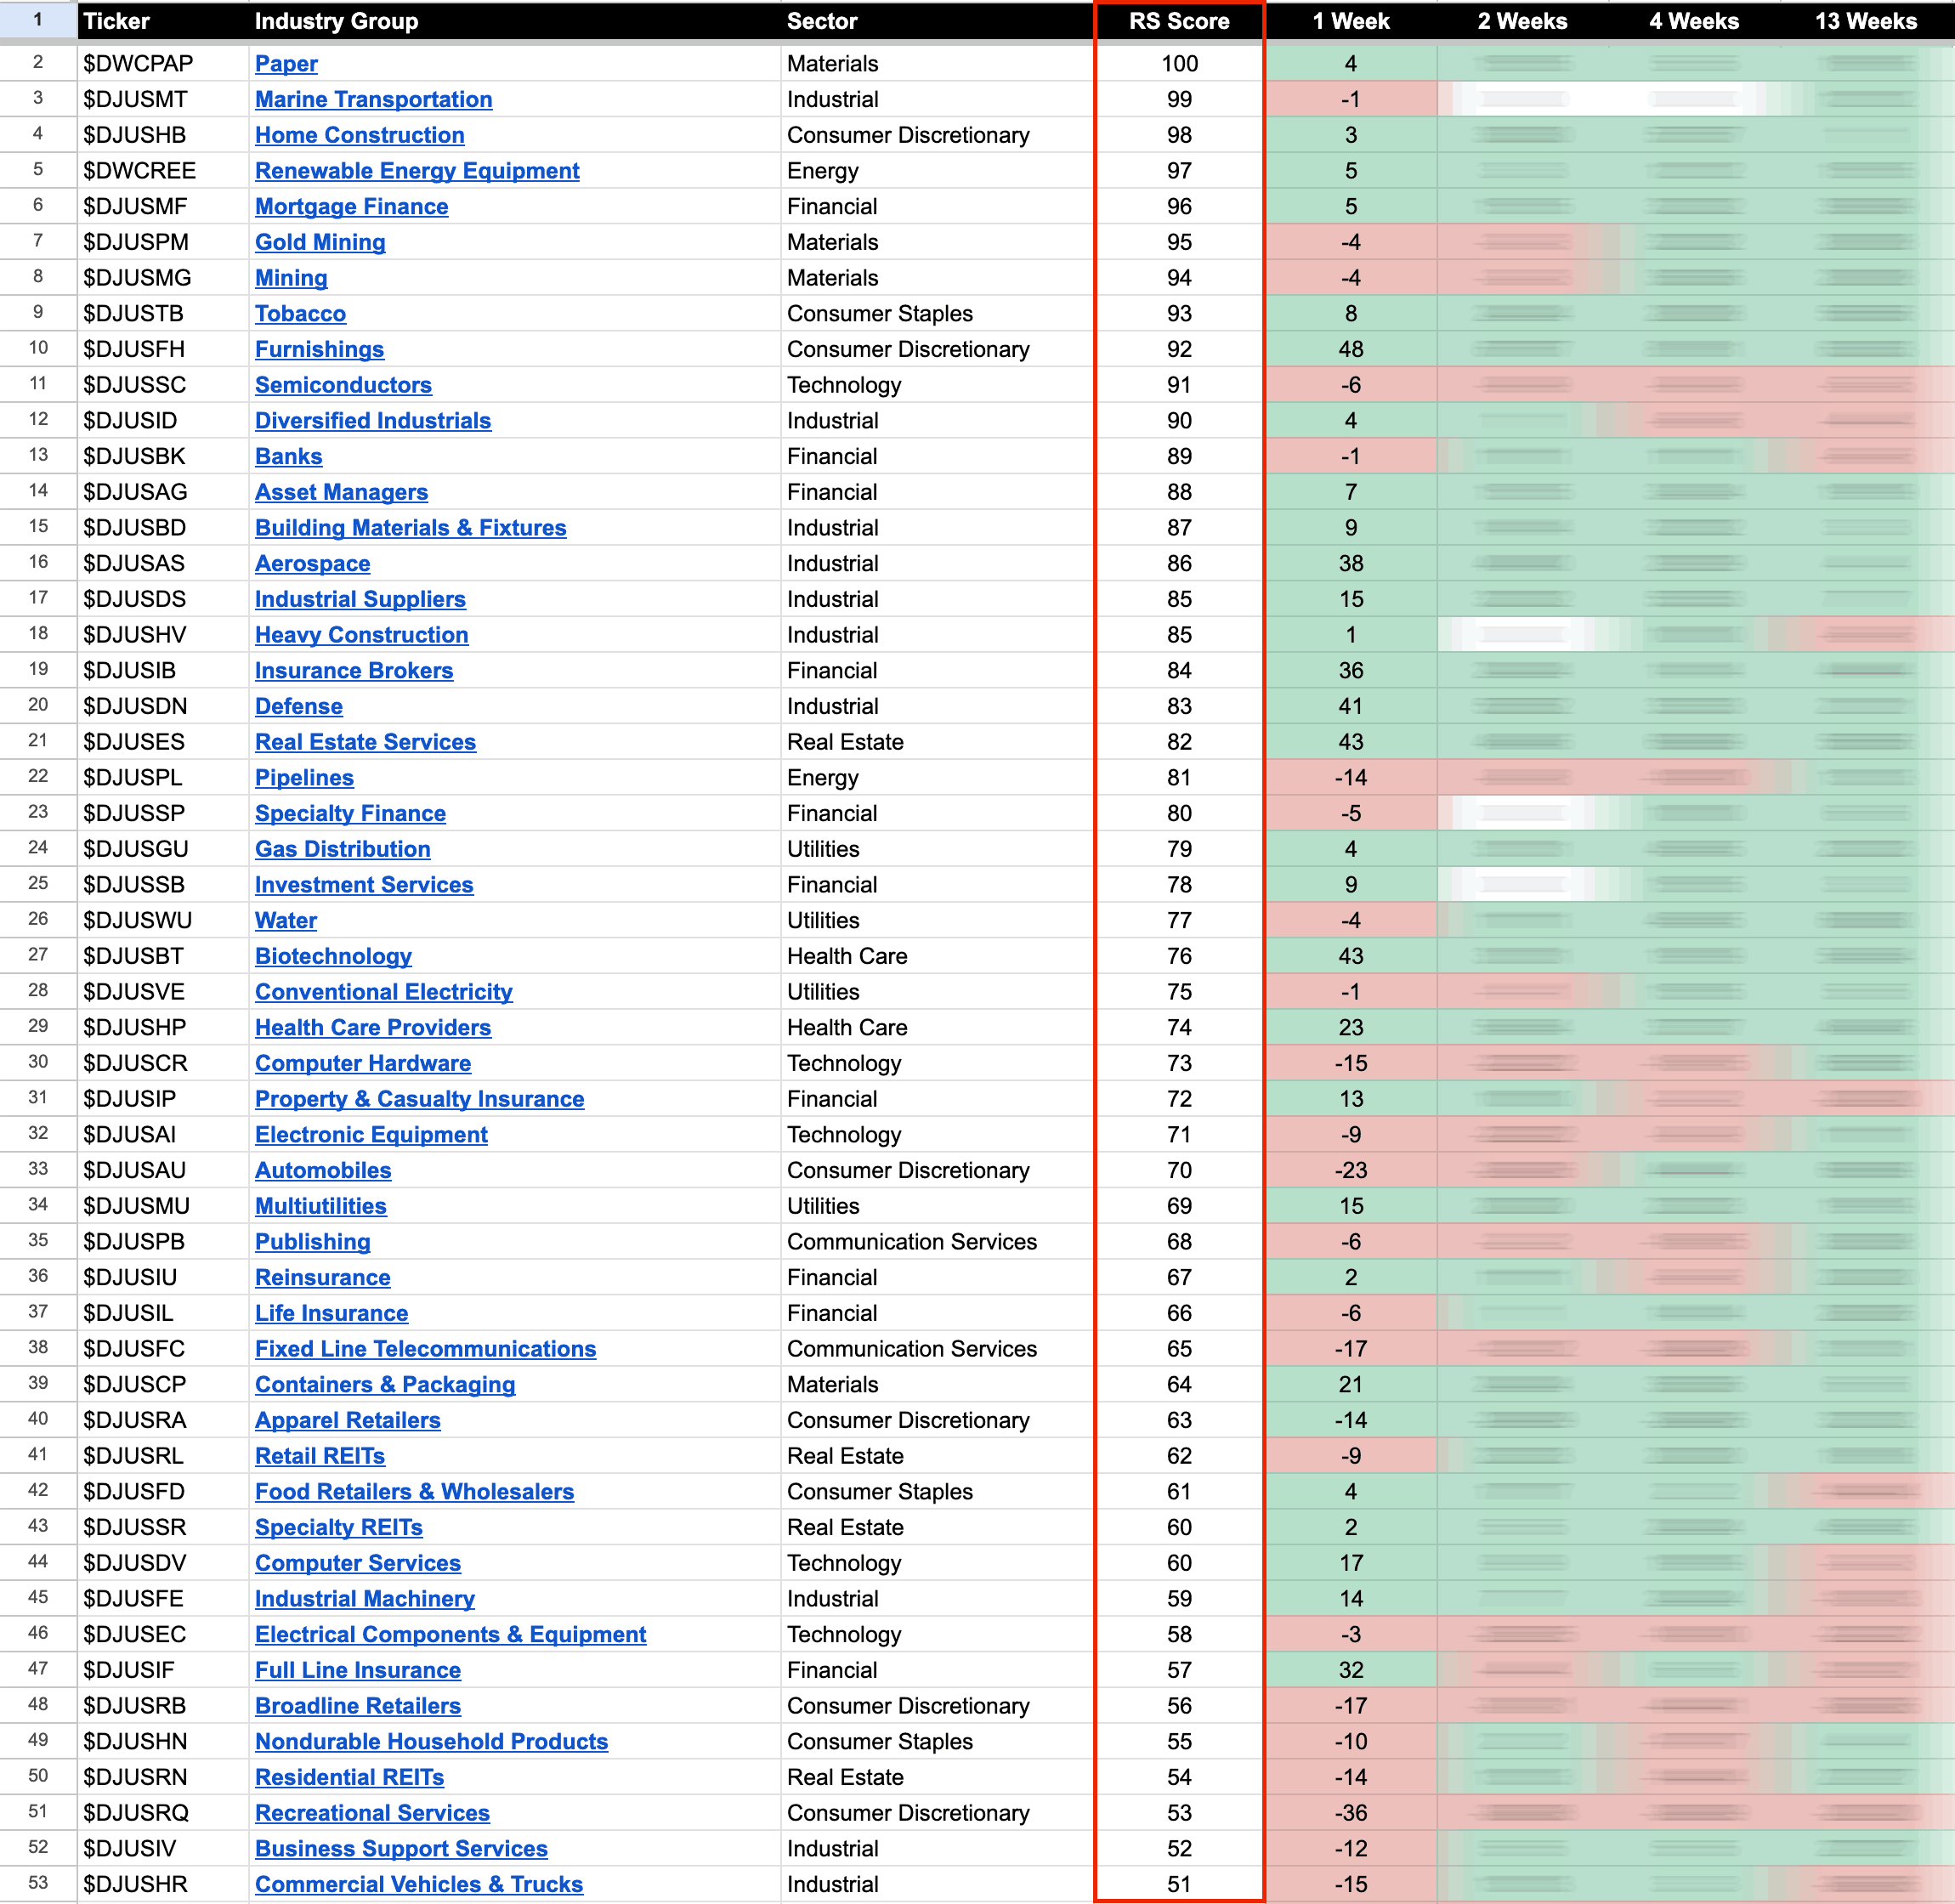
US Stocks Industry Groups Relative Strength Rankings
The purpose of the Relative Strength (RS) tables is to track the short, medium and long term RS changes of the individual groups to find the new leadership earlier than the crowd...
Read More