
US Stocks Industry Groups Relative Strength Rankings
The full post is available to view by members only. For immediate access:
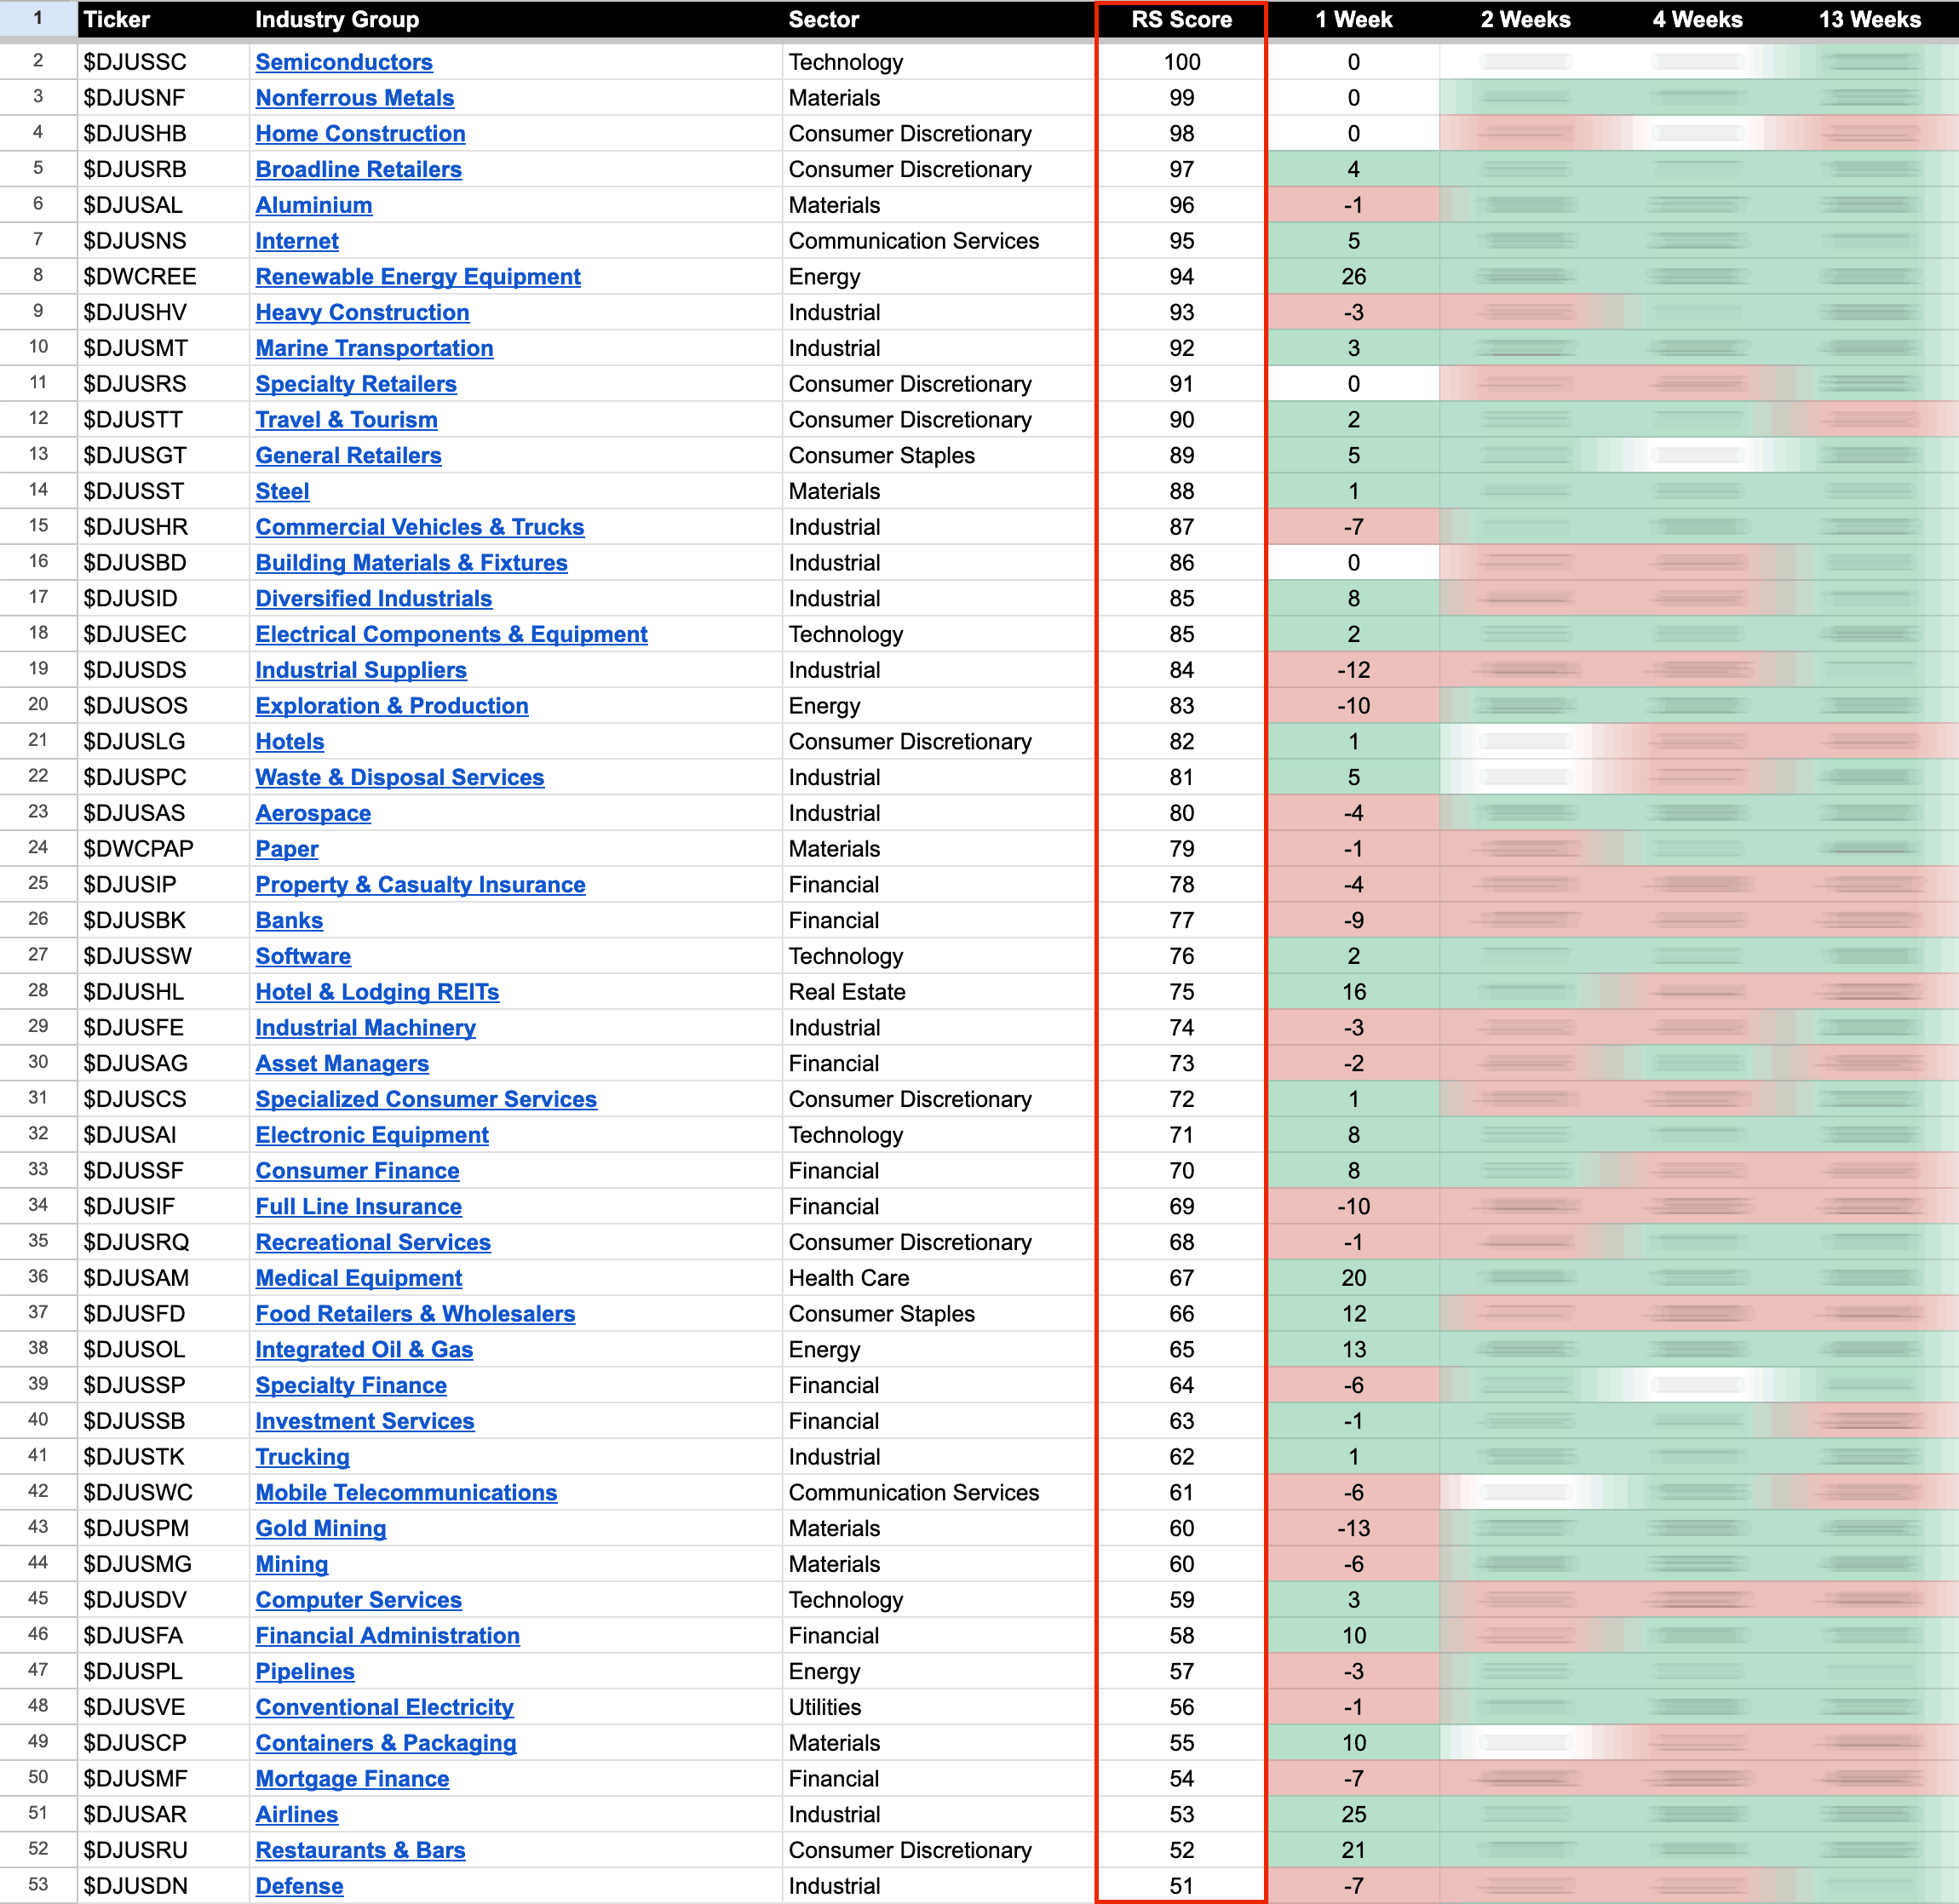
US Industry Groups by Highest RS Score
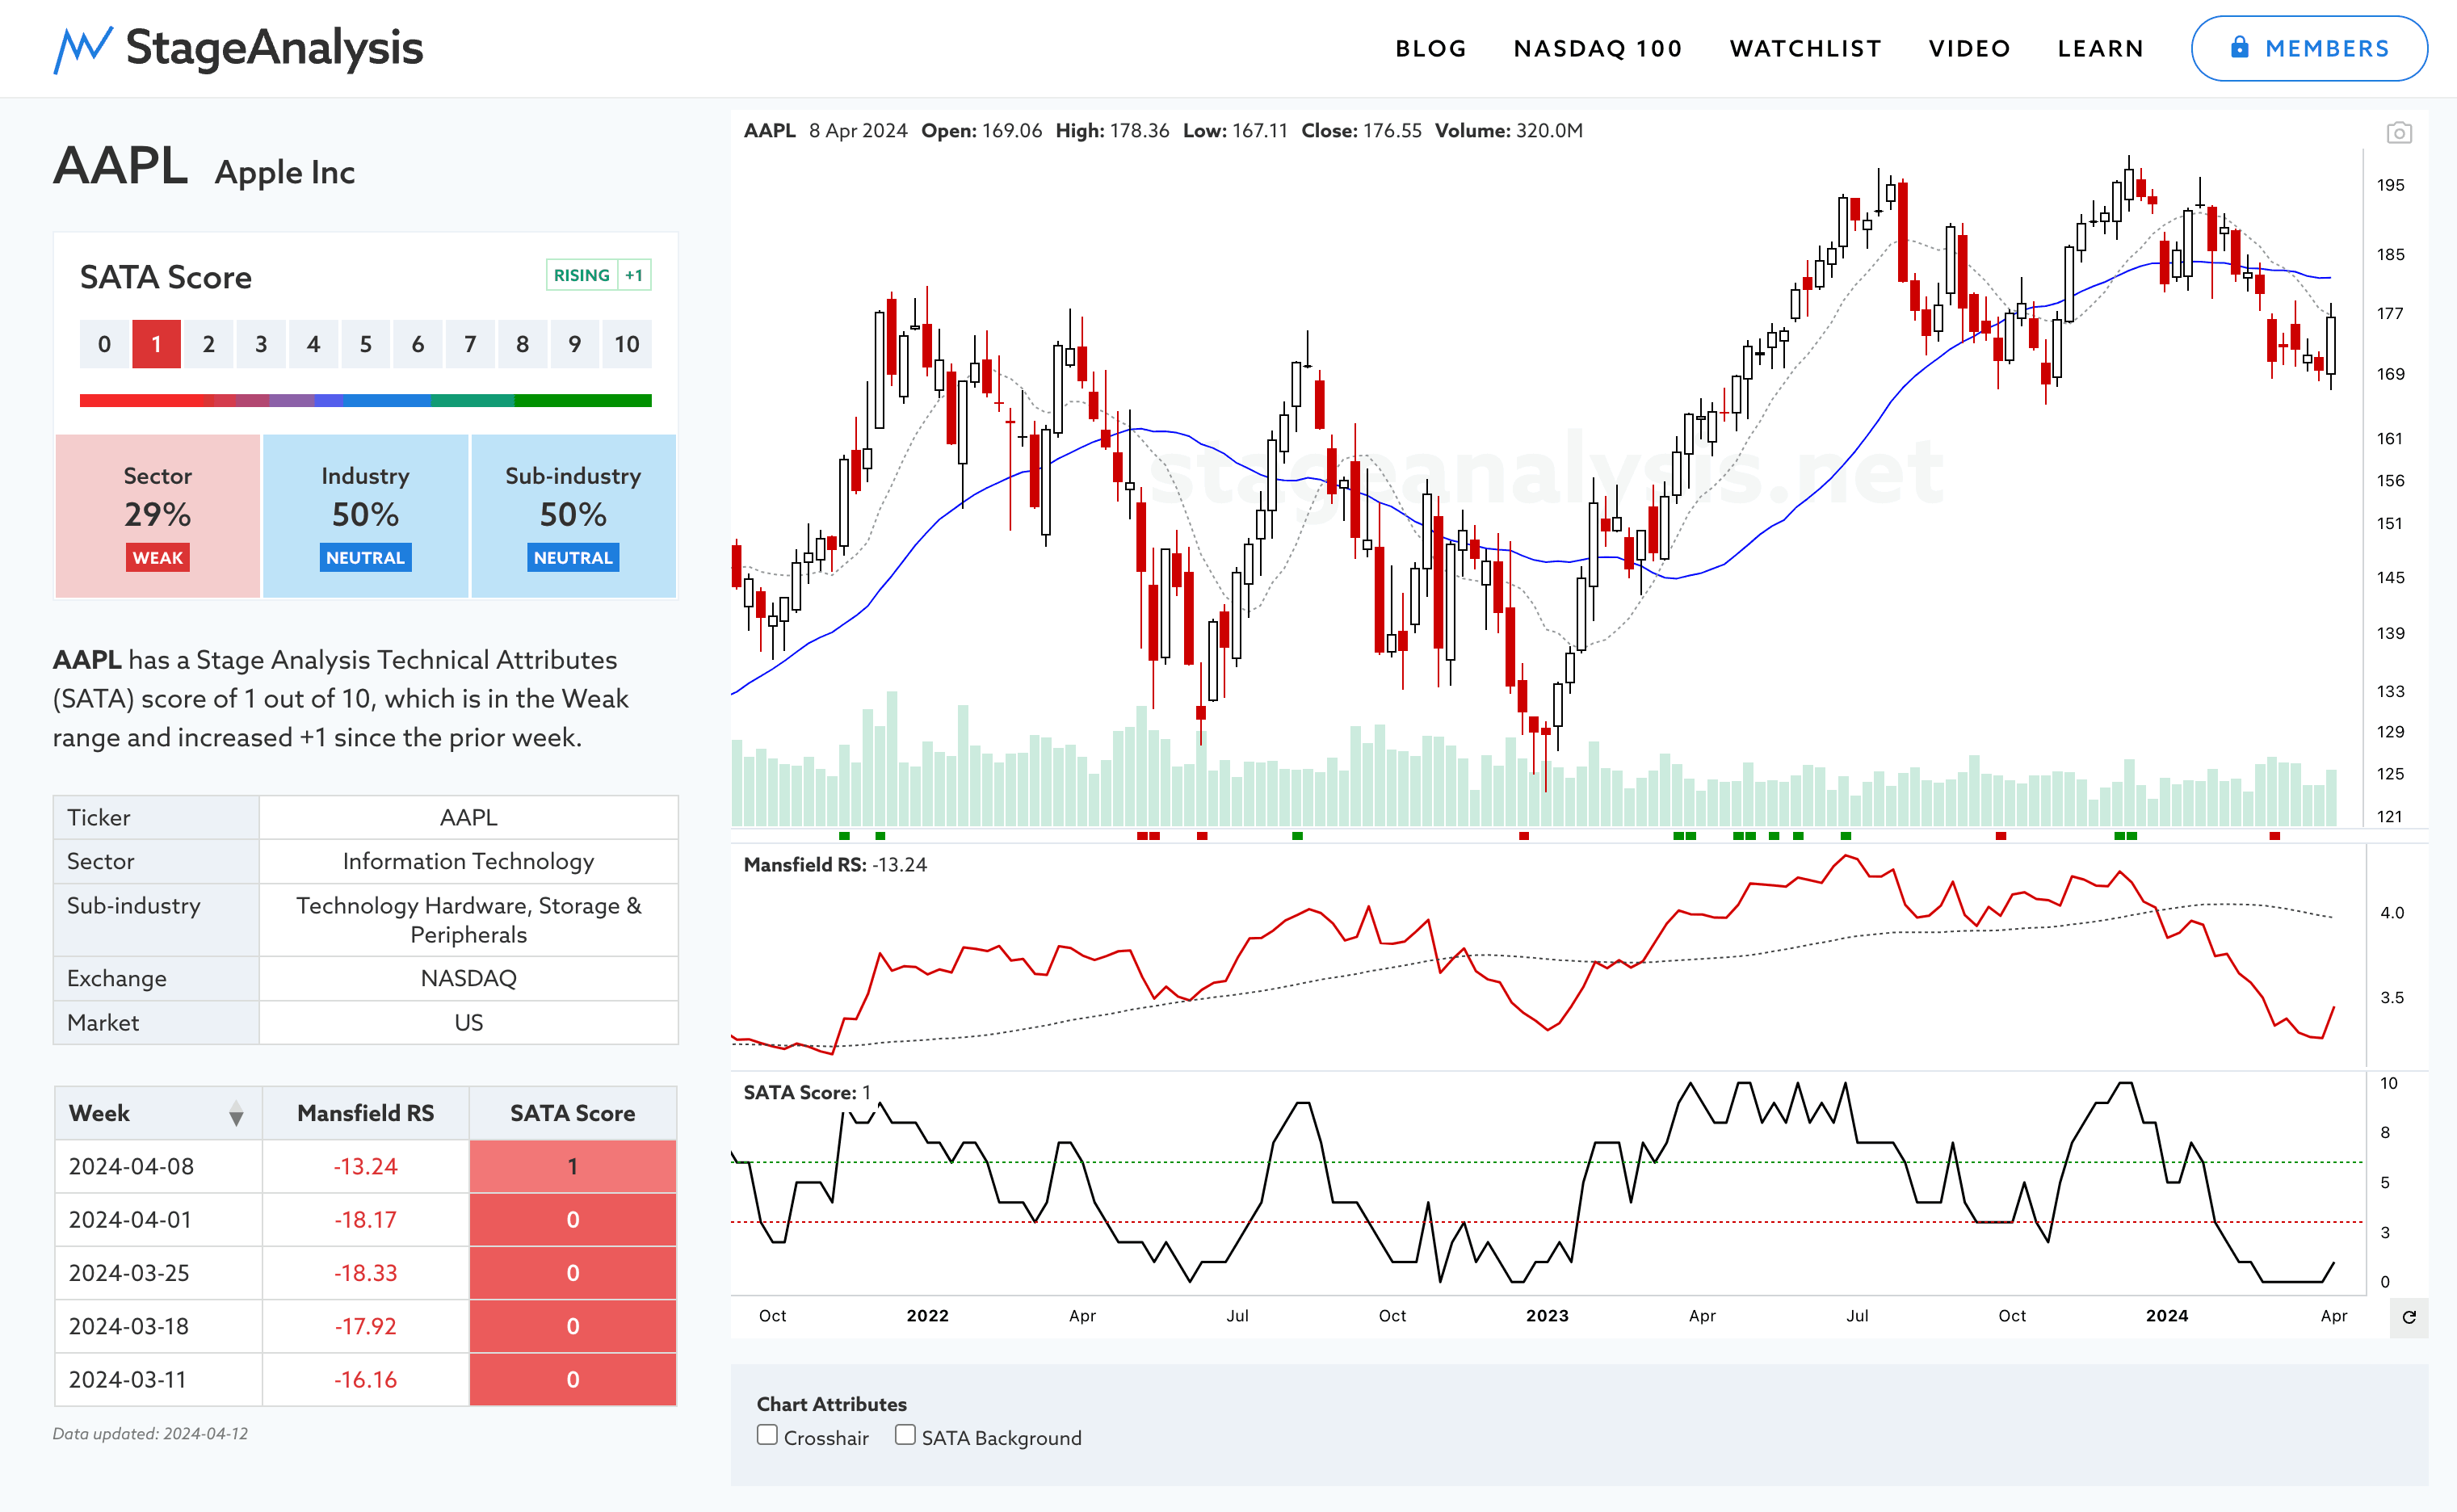
Around two thirds of the S&P 1500 stocks had negative Mansfield RS changes this week. So there wasn't many areas of strength. AAPL being a notable RS stand out, as it formed a Spring pattern, and rebounded back towards its still declining 10 week MA in its current Stage 4 decline, which increased its Stage Analysis Technical Attributes (SATA) score to a SATA 1 of 10, and is the first improvement in SATA in 6 weeks, but remains a very weak score.
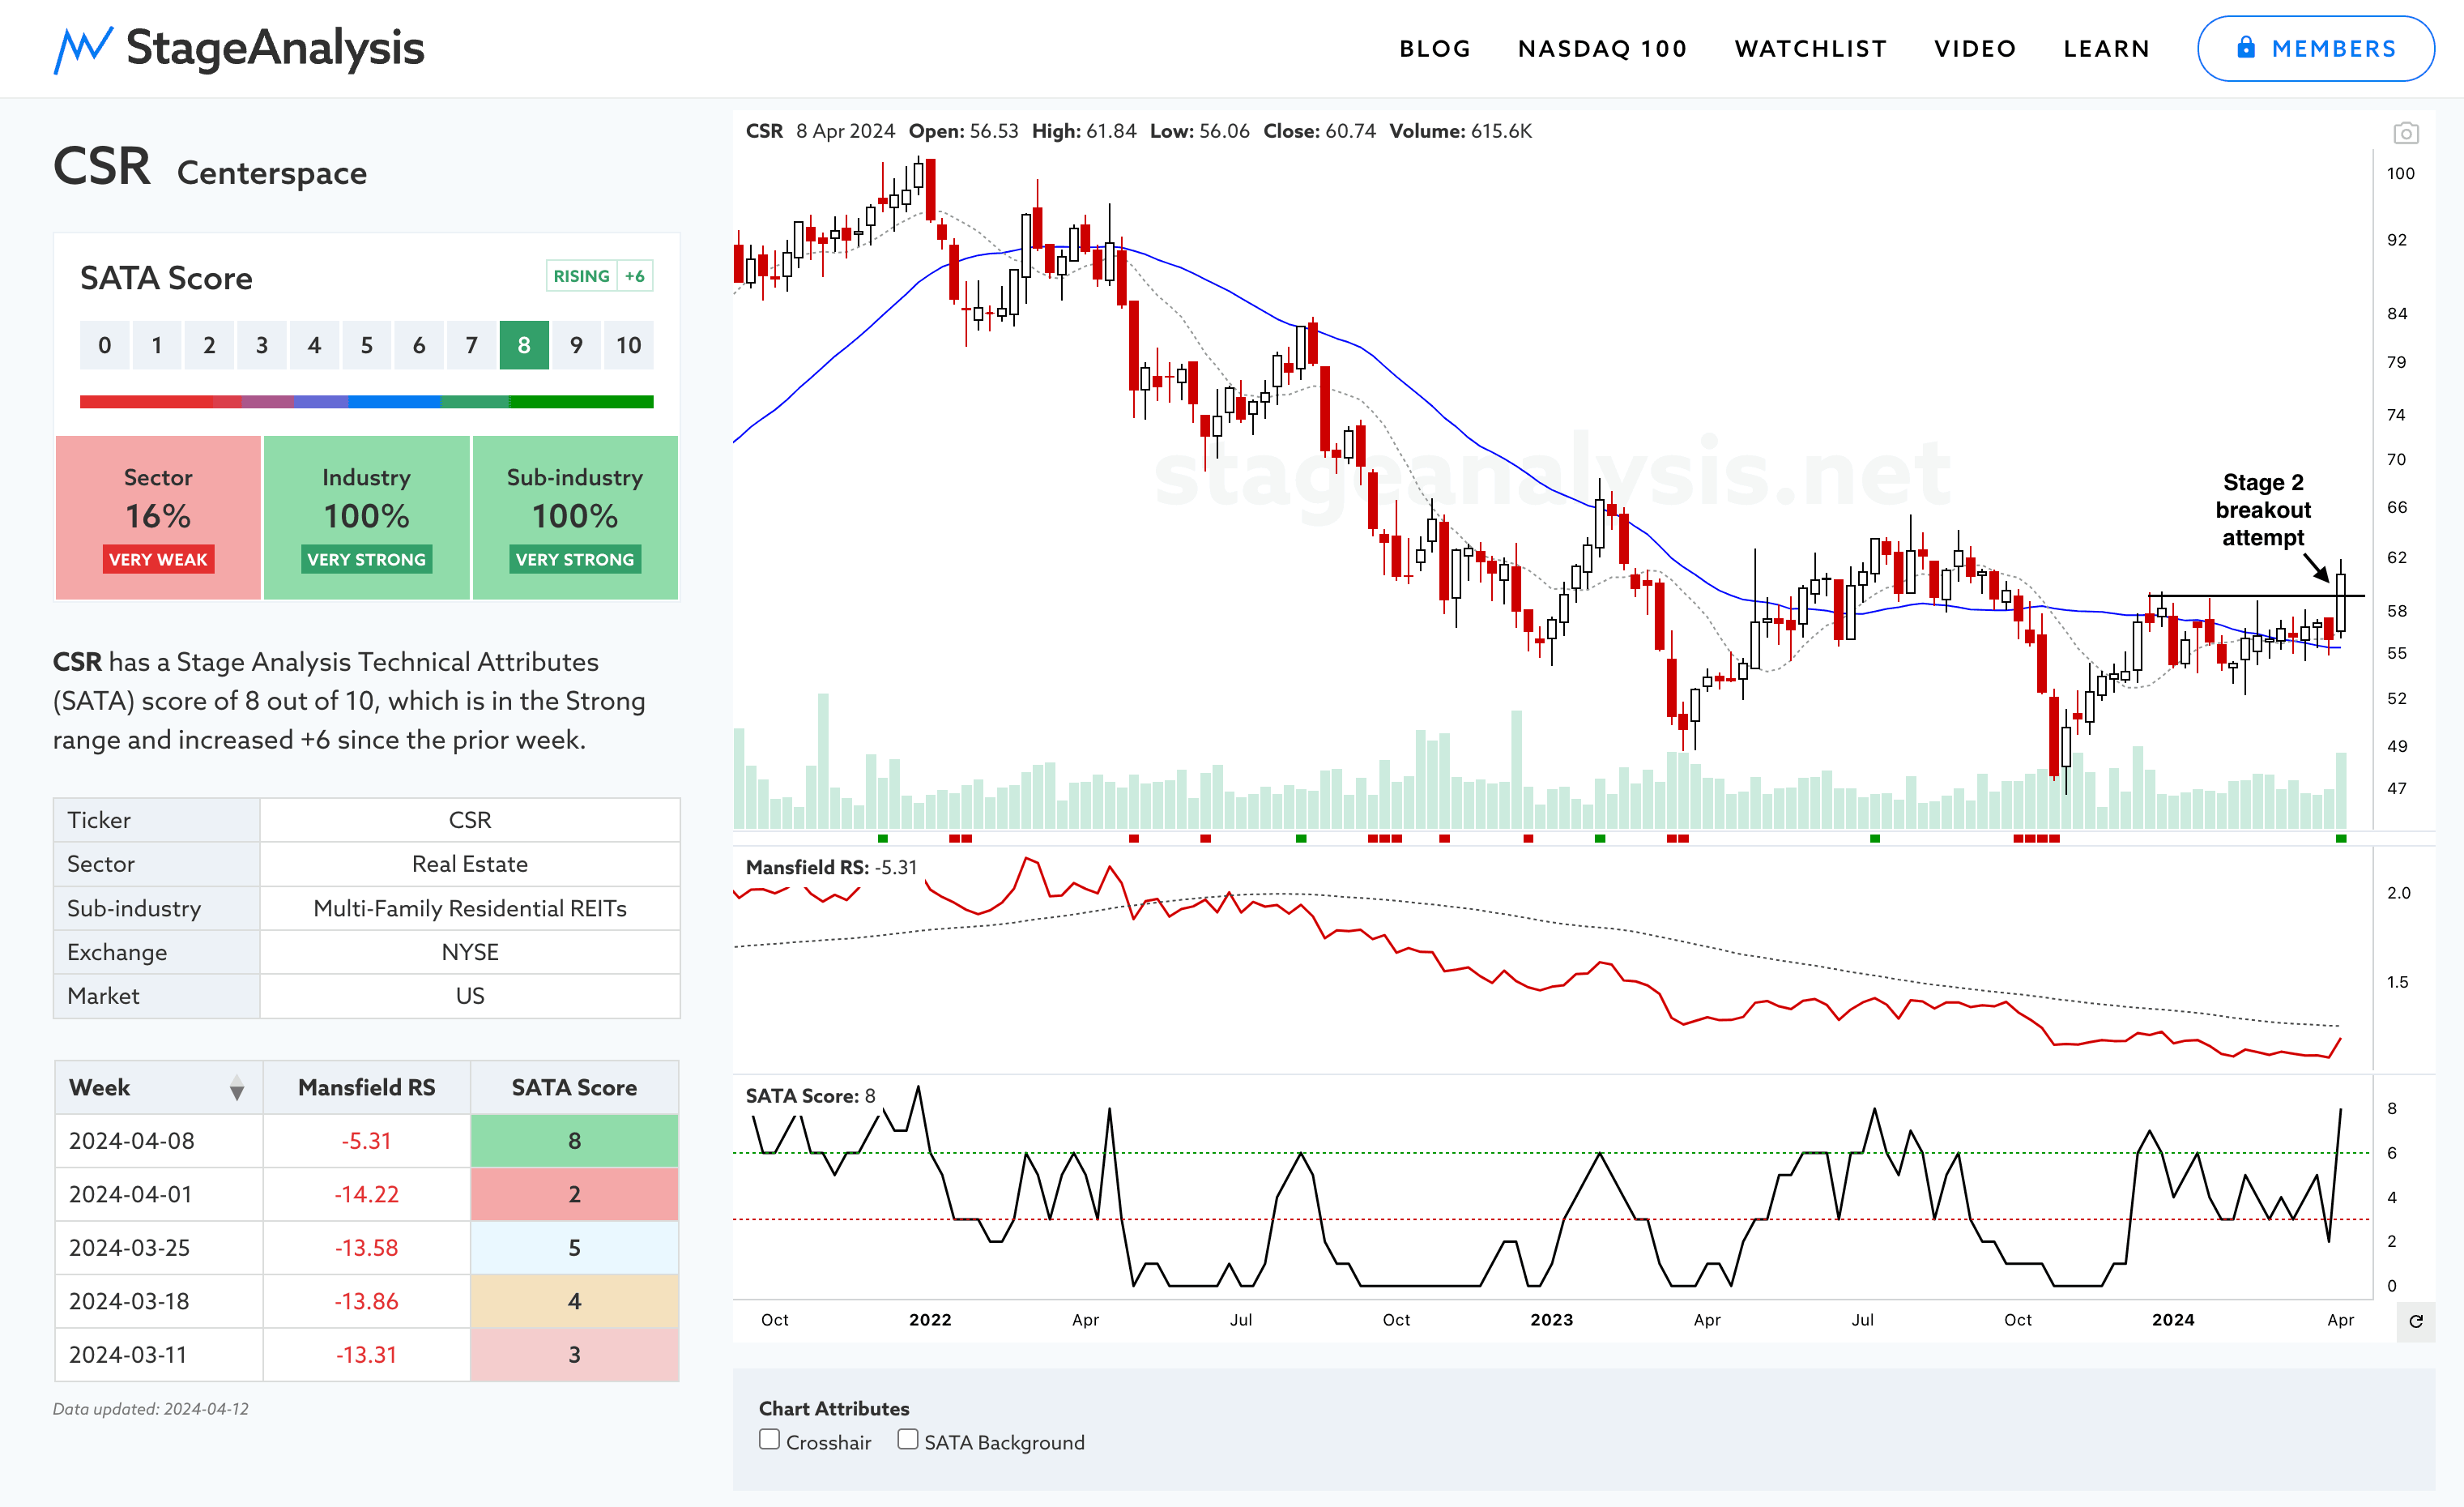
A number of the REITs were some of the other few RS improvers this week, with multiple Real Estate groups seeing Stage Analysis Technical Attributes (SATA) score improvements. CSR for example, which made a Stage 2 breakout attempt.
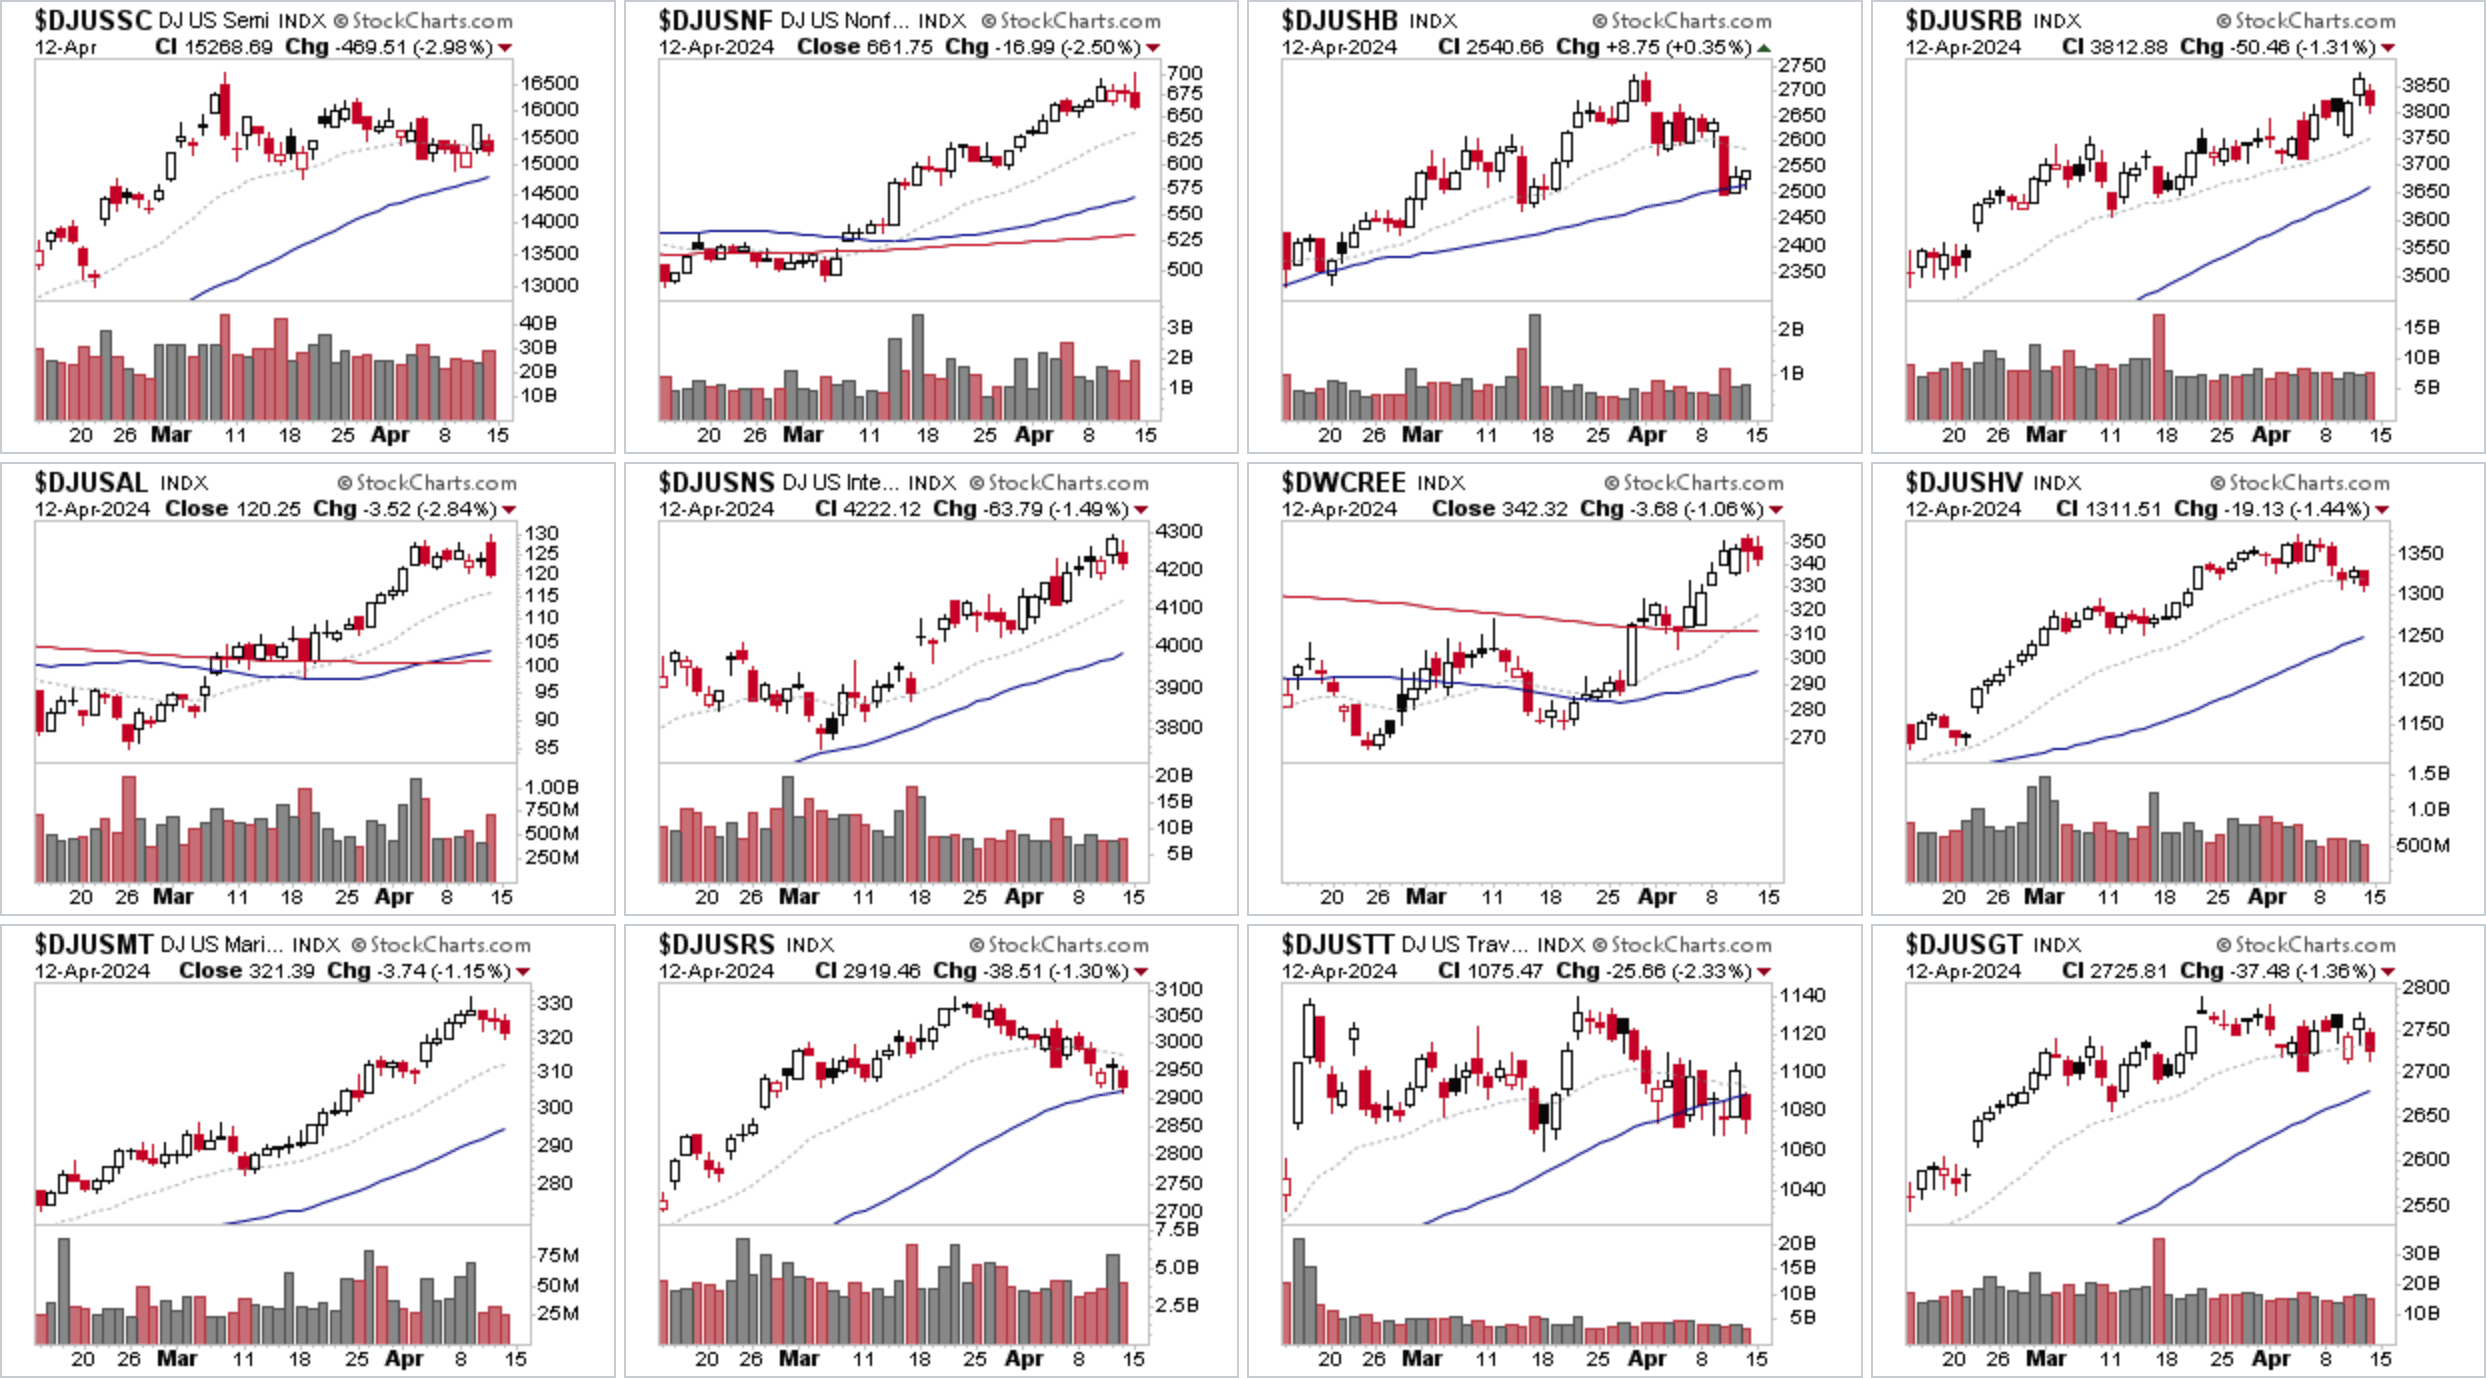
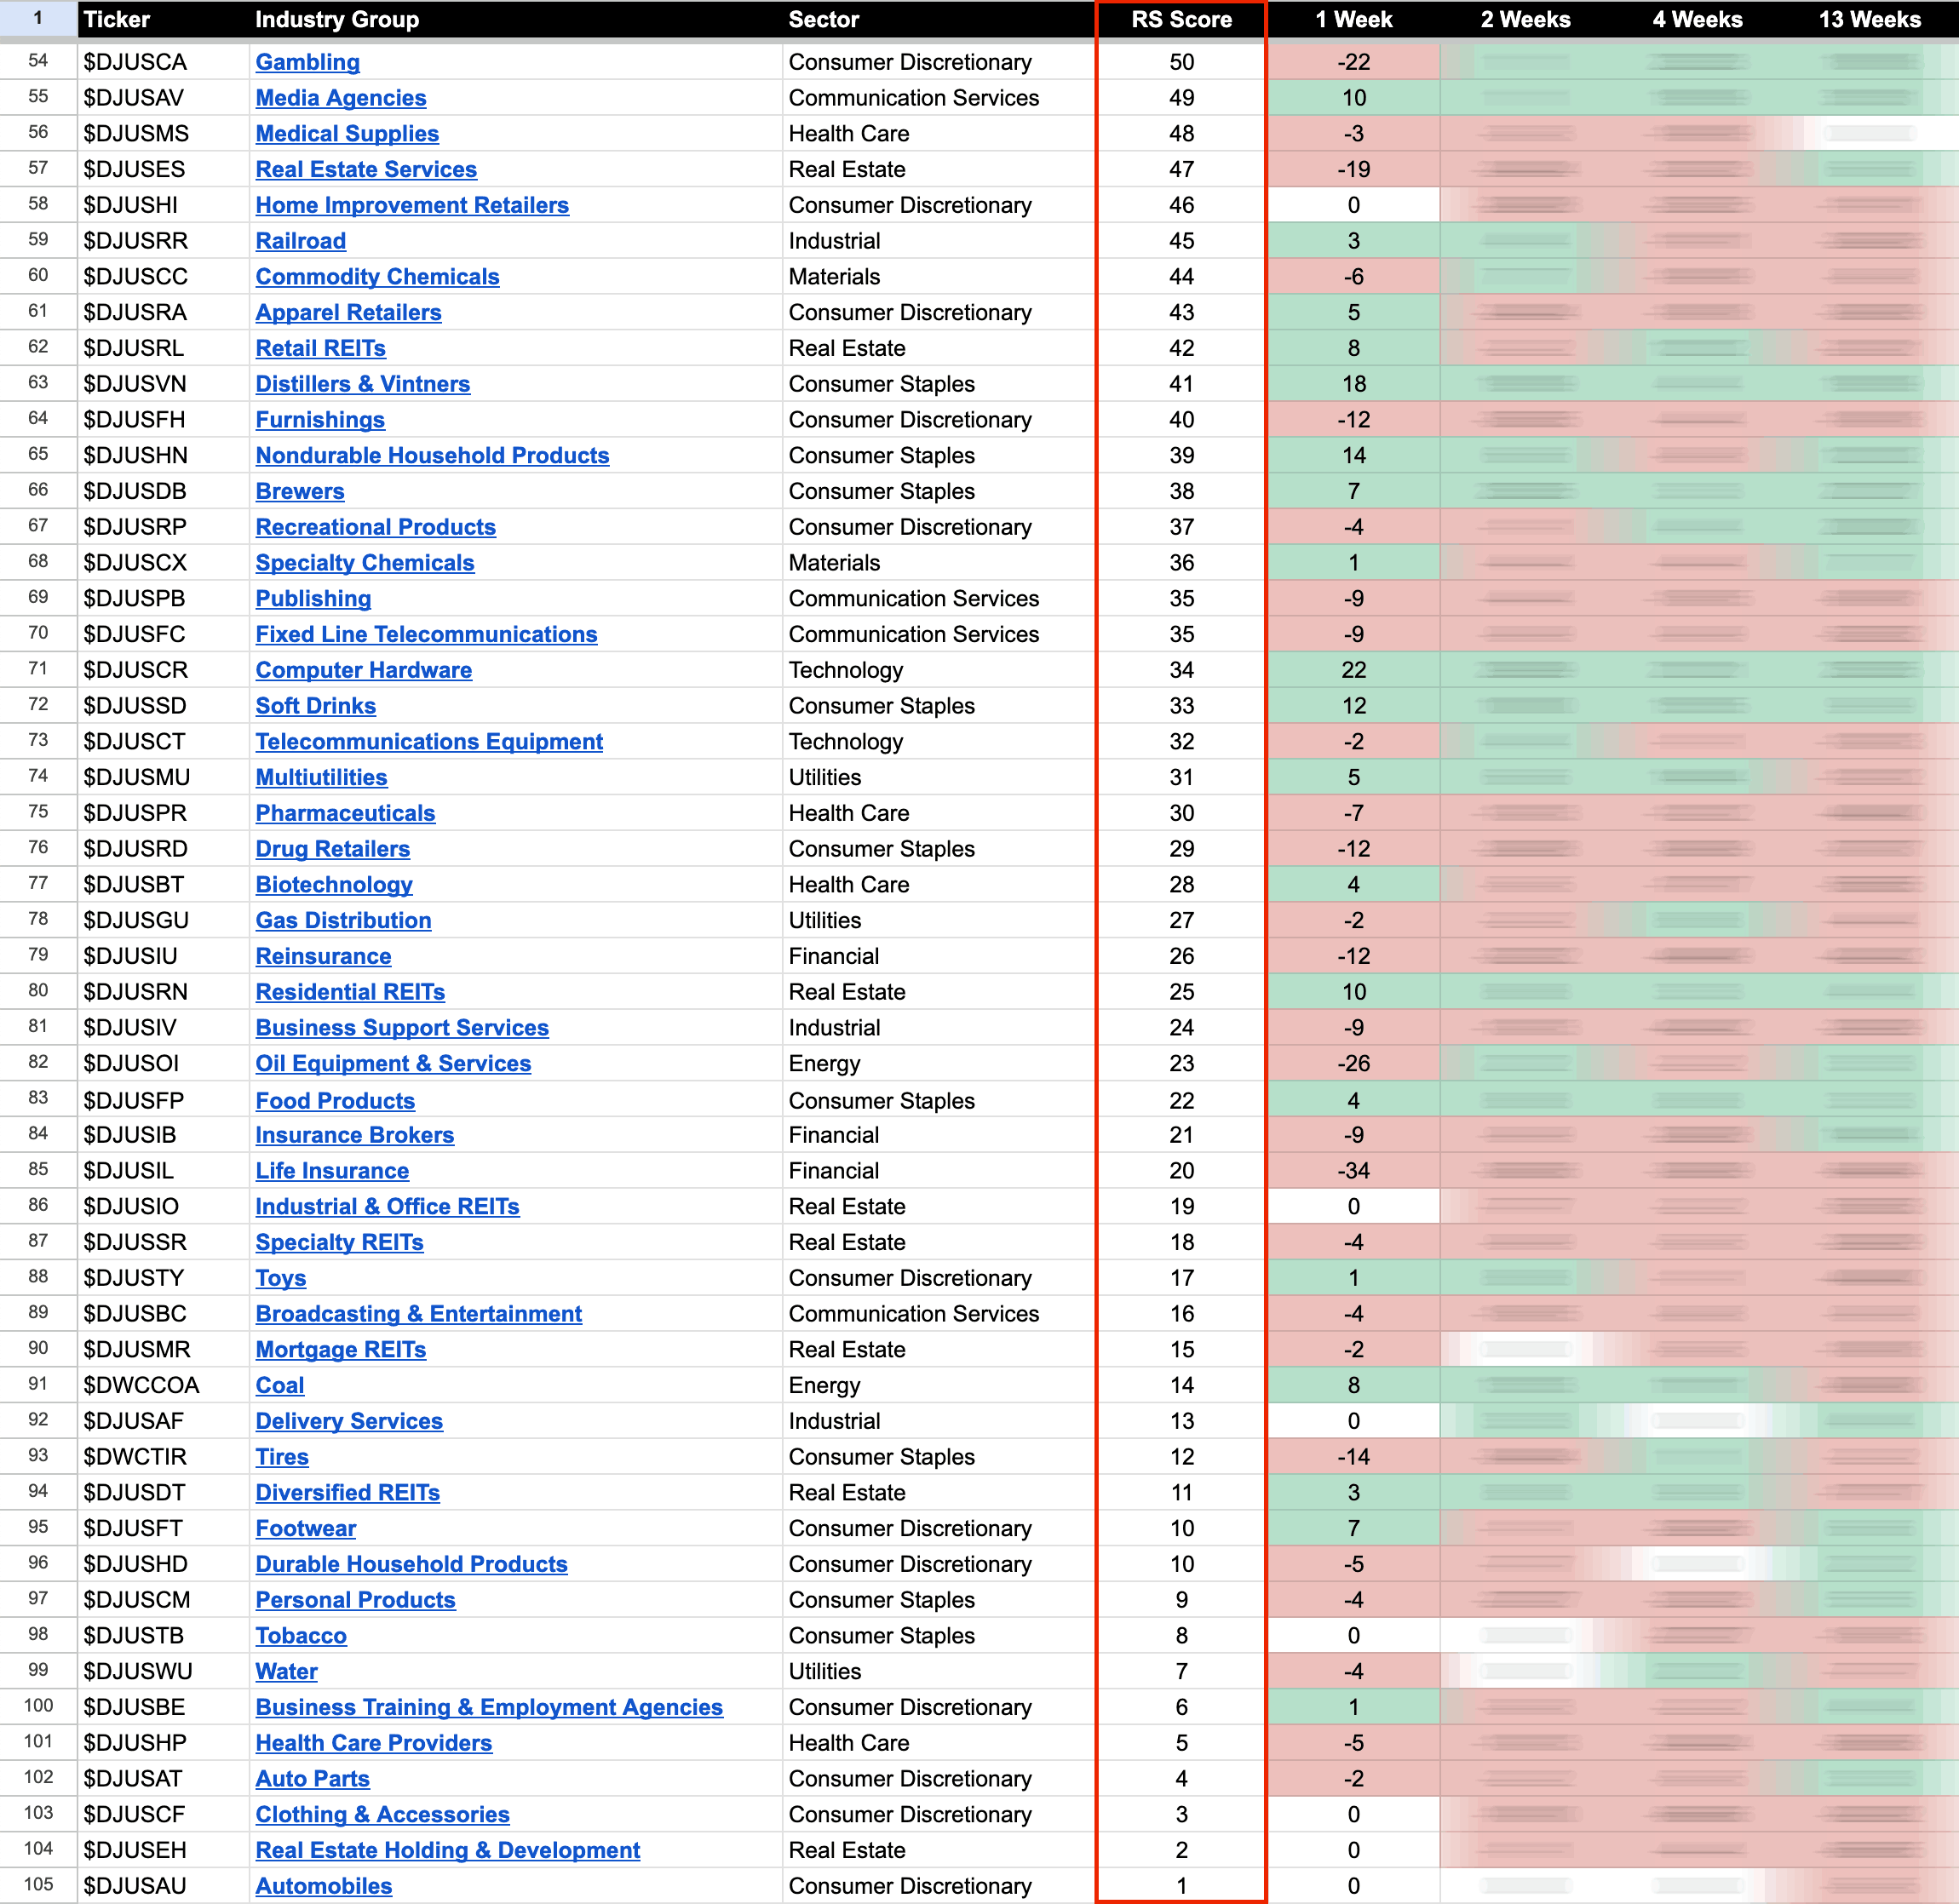
US Industry Groups by Weakest RS Score
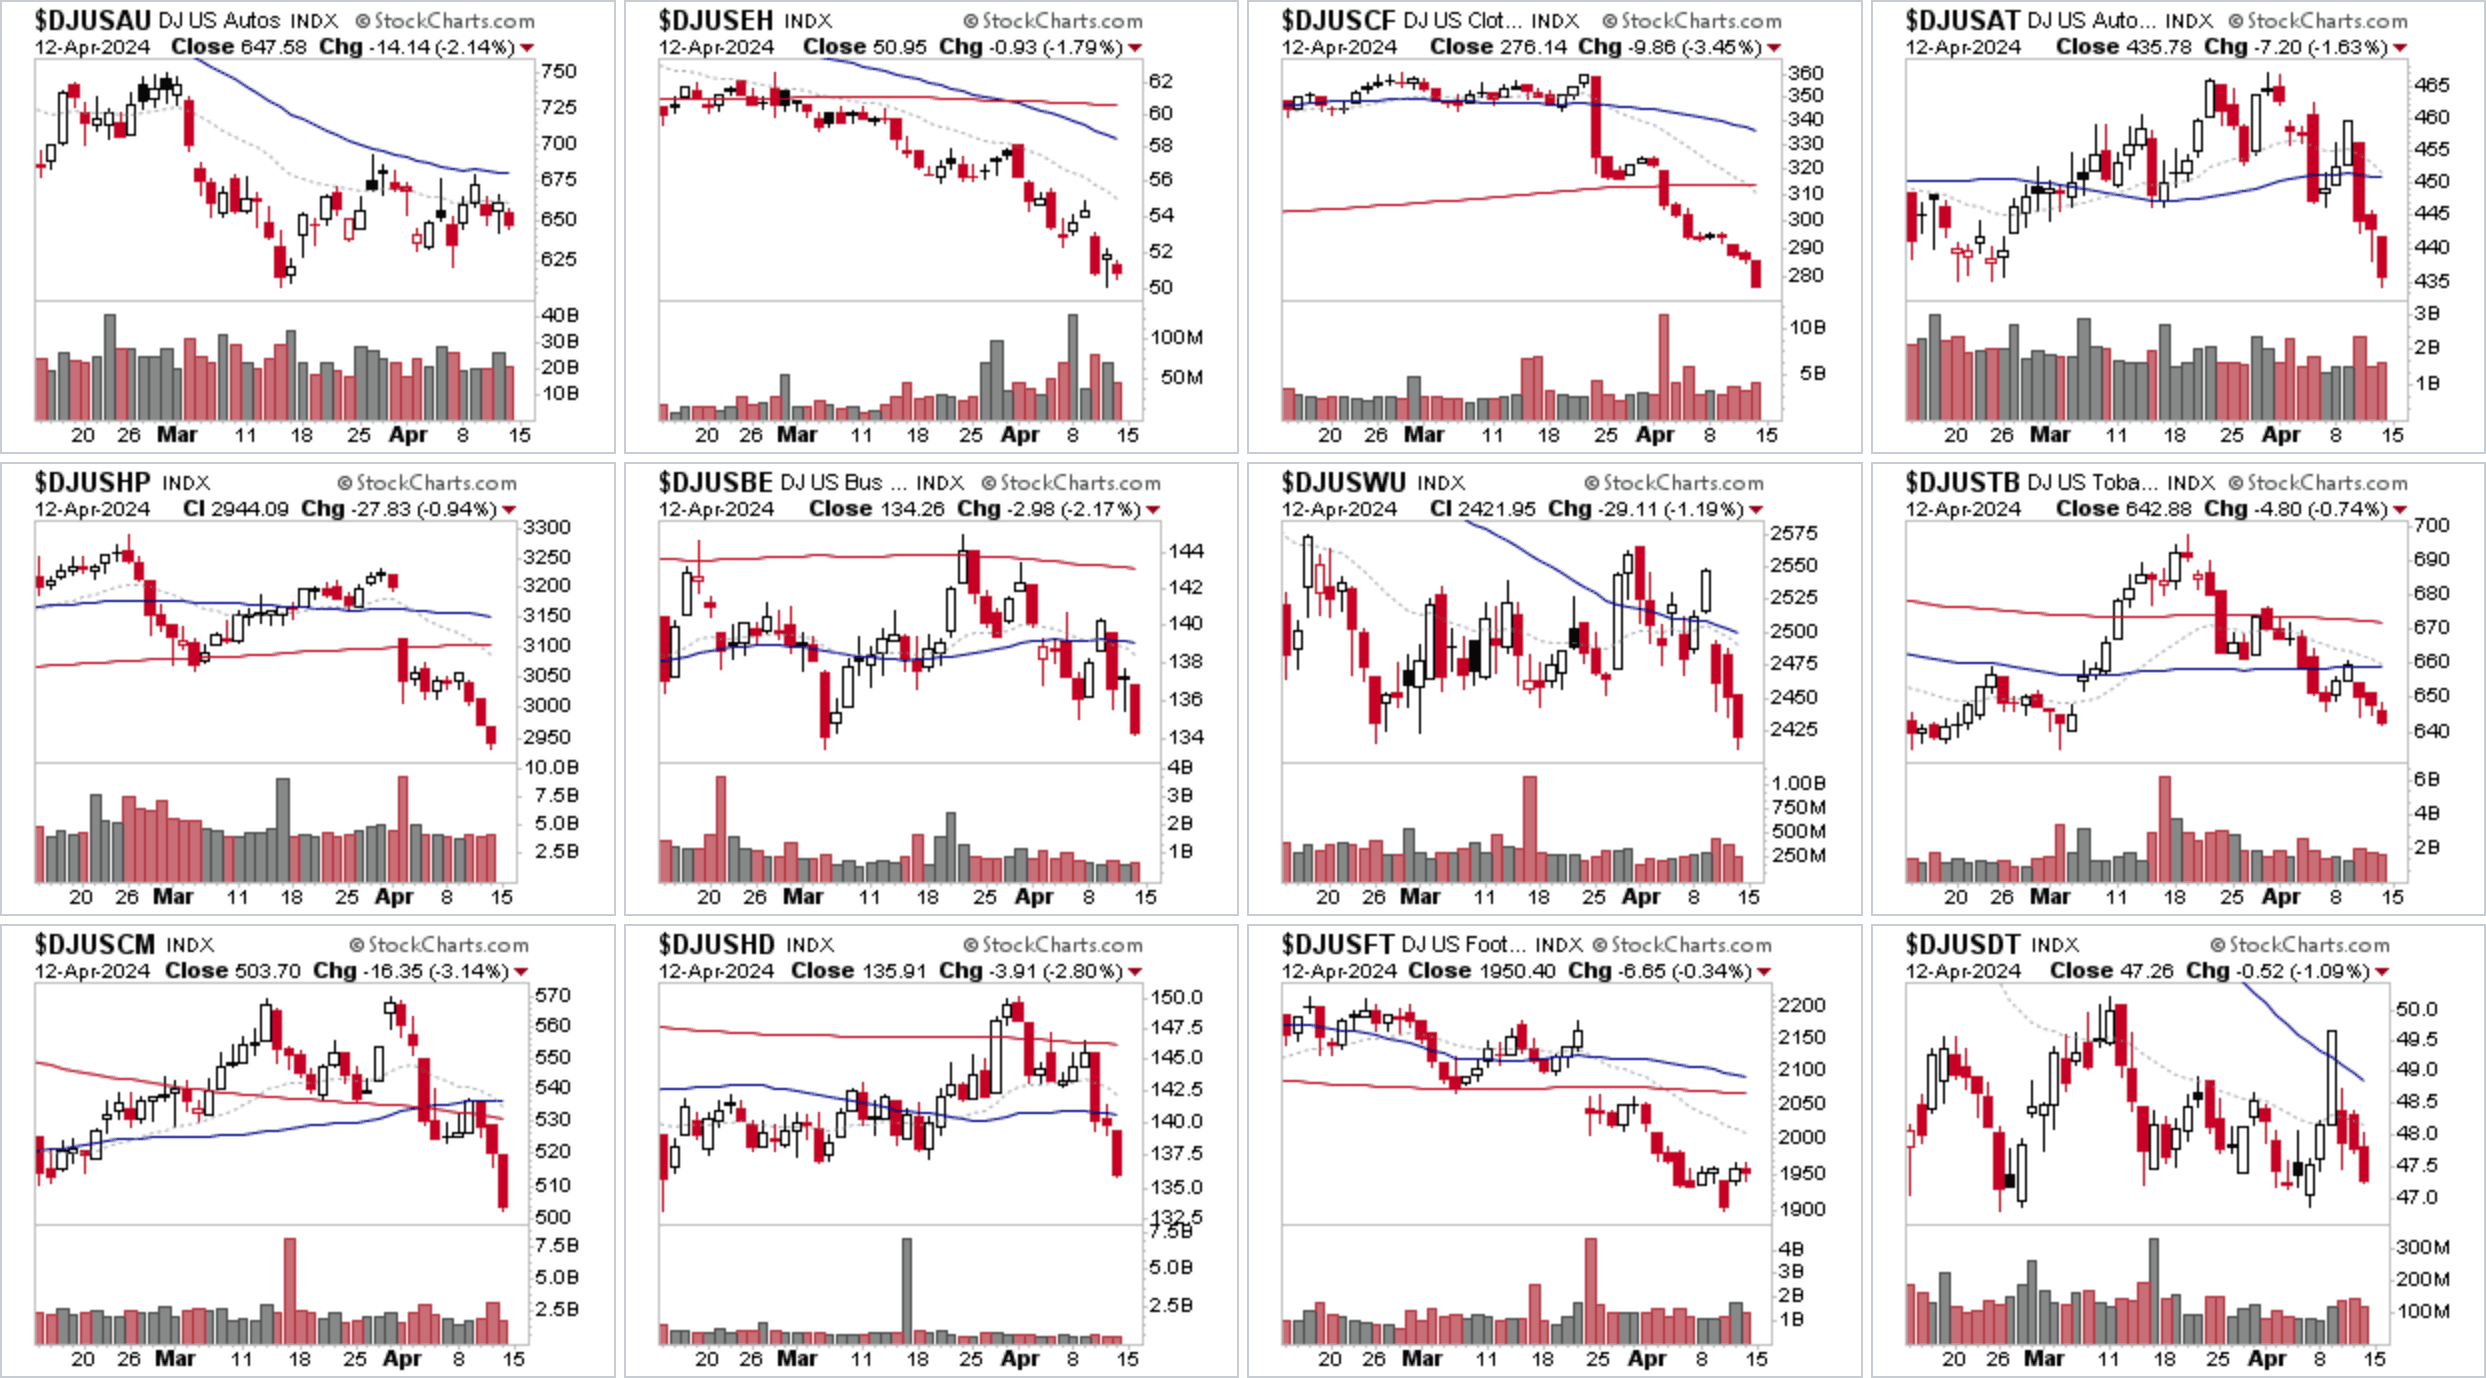
The major theme of the week however, was negative significant bars. As numerous groups moved lower with large negative weekly candles that dwarf a lot of their recent price action. So a notable change of behaviour in many groups at the top of the rankings, and further weakening at the bottom of the rankings.
US Industry Groups sorted by Relative Strength
The purpose of the Relative Strength (RS) tables is to track the short, medium and long-term RS changes of the individual groups to find the new leadership earlier than the crowd.
RS Score of 100 is the strongest, and 0 is the weakest.
In the Stage Analysis method we are looking to focus on the strongest groups, as what is strong, tends to stay strong for a long time. But we also want to find the improving / up and coming groups that are starting to rise up strongly through the RS table from the lower zone, in order to find the future leading stocks before they break out from a Stage 1 base and move into a Stage 2 advancing phase.
Each week I go through the most interesting groups on the move in more detail during the Stage Analysis Members weekend video – as Industry Group analysis is a key part of Stan Weinstein's Stage Analysis method.
Become a Stage Analysis Member:
To see more like this – US Stocks watchlist posts, detailed videos each weekend, use our unique Stage Analysis tools, such as the US Stocks & ETFs Screener, Charts, Market Breadth, Group Relative Strength and more...
Join Today
Disclaimer: For educational purpose only. Not investment advice. Seek professional advice from a financial advisor before making any investing decisions.