
IBD Industry Groups Bell Curve – Bullish Percent
The full post is available to view by members only. For immediate access:
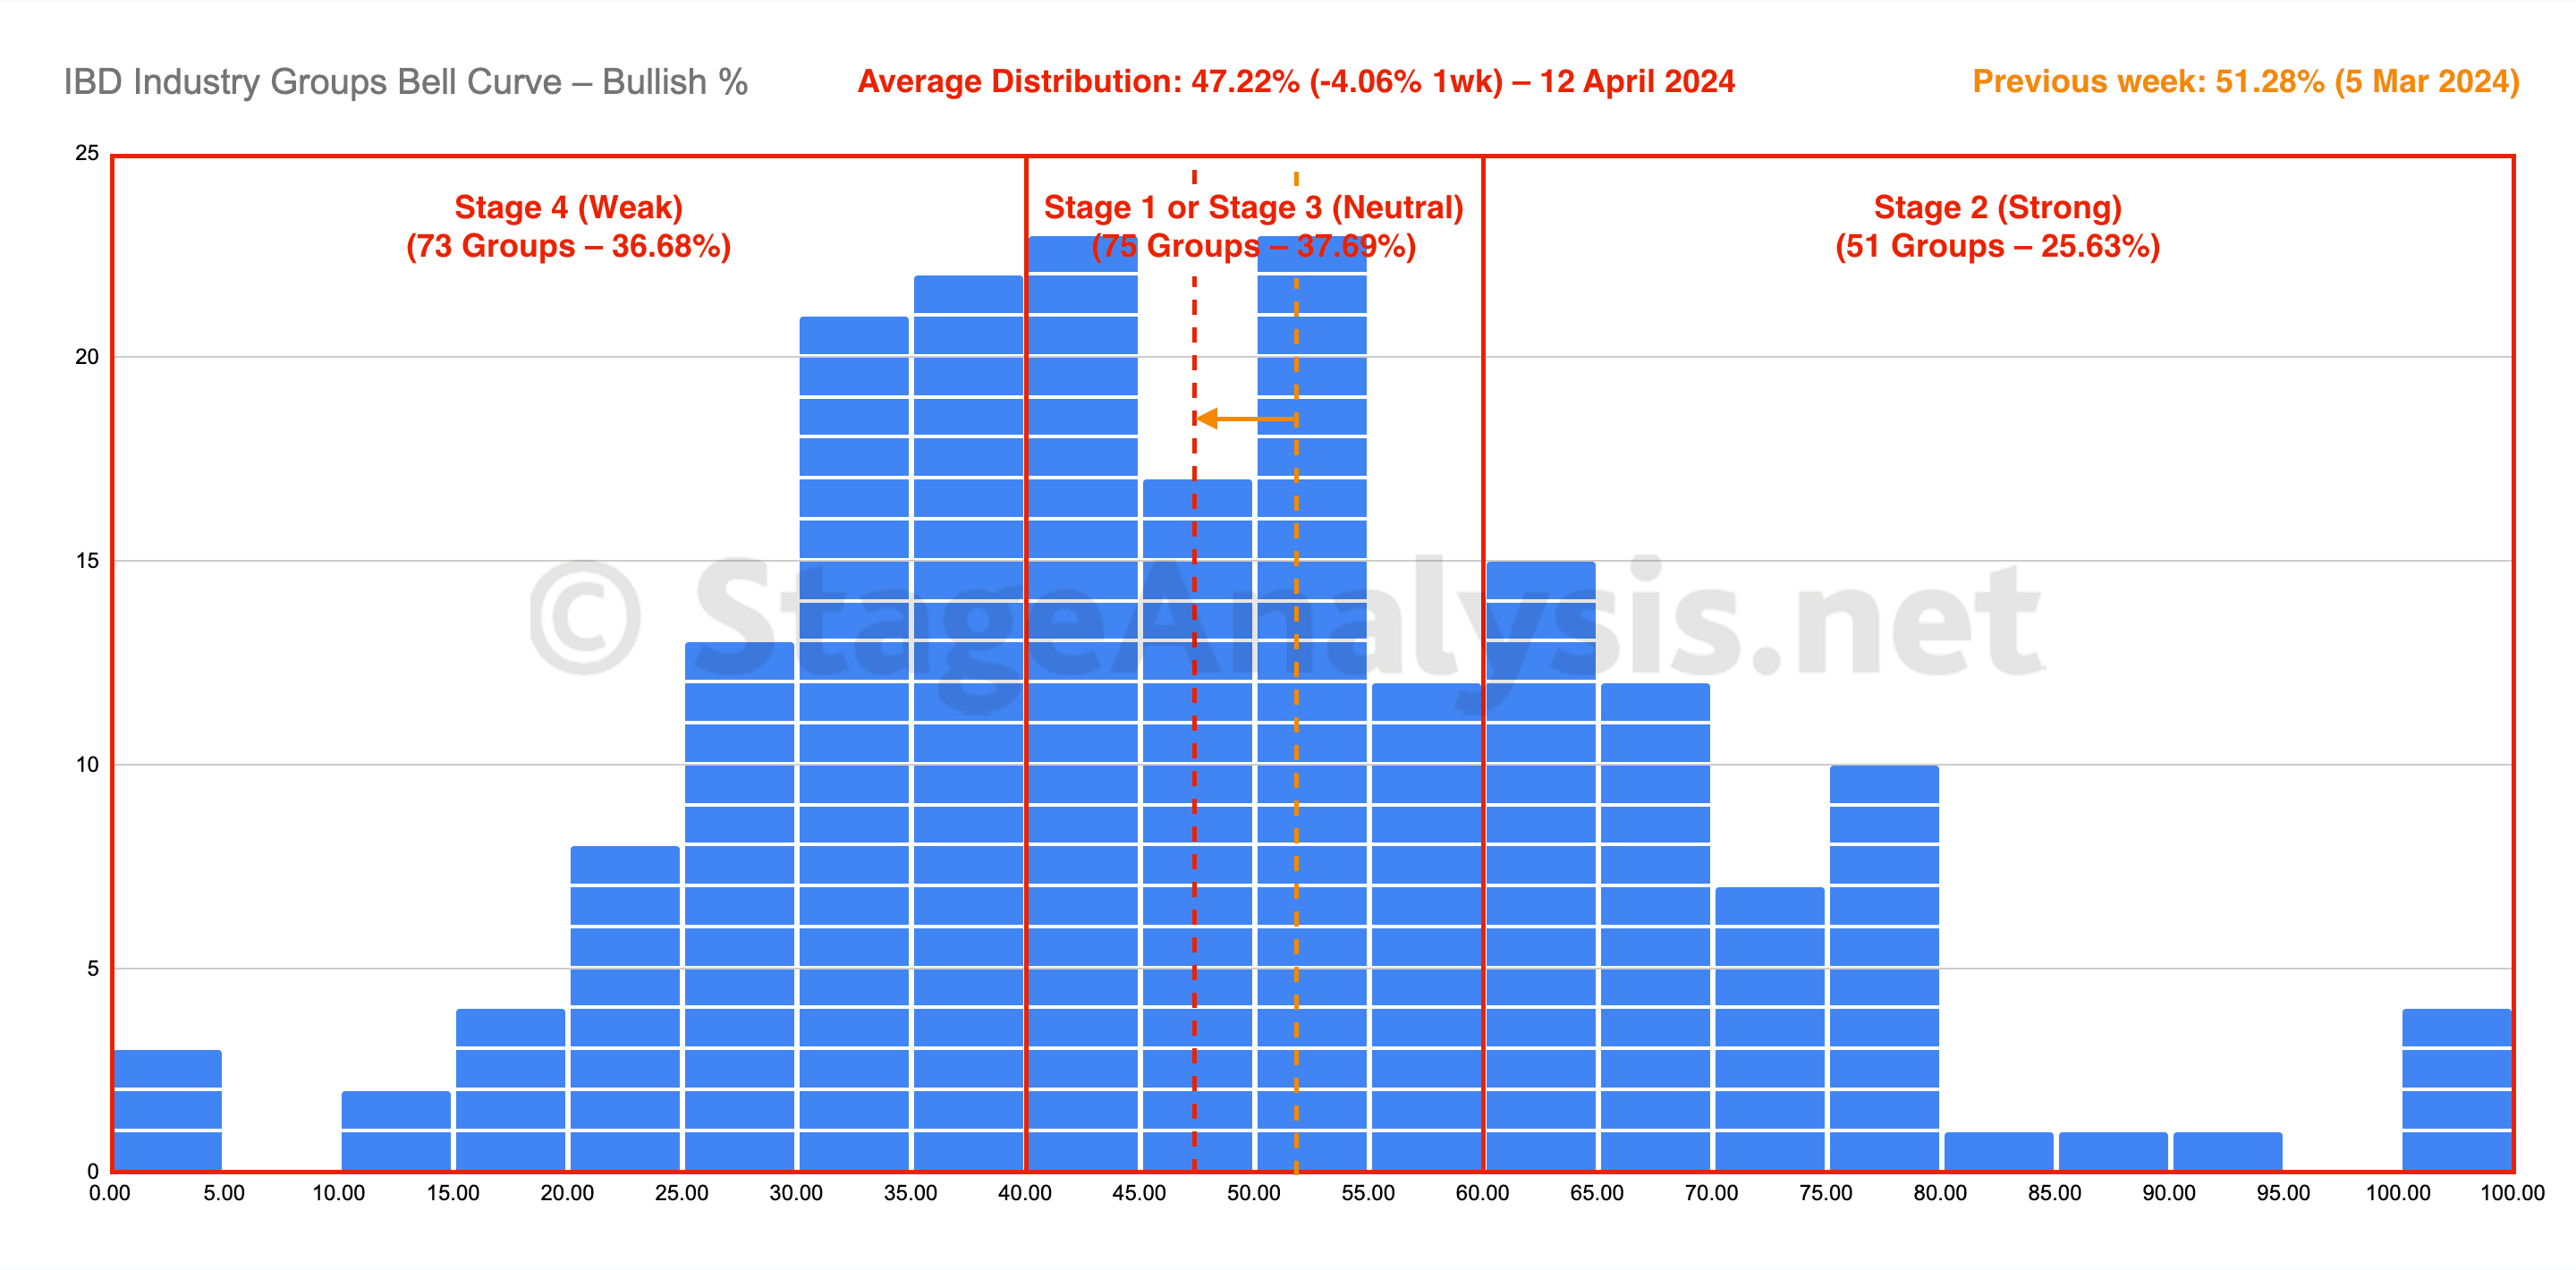
Average Distribution: 47.22% (-4.06% 1wk)
- 73 Groups (36.68%) are in the Stage 4 zone (Weak)
- 75 Groups (37.69%) are in the Stage 1 or Stage 3 zone (Neutral)
- 51 Groups (25.63%) are in the Stage 2 zone (Strong)
The IBD Industry Groups Bell Curve decreased by -4.06% this week to finish at 47.22% overall.
The amount of groups in Stage 4 (Weak) increased by 15 (+7.5%), and the amount of groups in Stage 2 (Strong) decreased by 18 (-9%), while the amount groups in Stage 1 or Stage 3 (Neutral) increased by 3 (+1.5%).
The ratio of the amount of groups increasing in the Strong (Stage 2) zone versus decreasing in the Weak (Stage 4) zone decreased again this week, and has gone negative to 0.69, and so there are now more groups in the Stage 4 zone than are in the Stage 2 zone.
New Feature: GICS Sub-industries Bell Curve
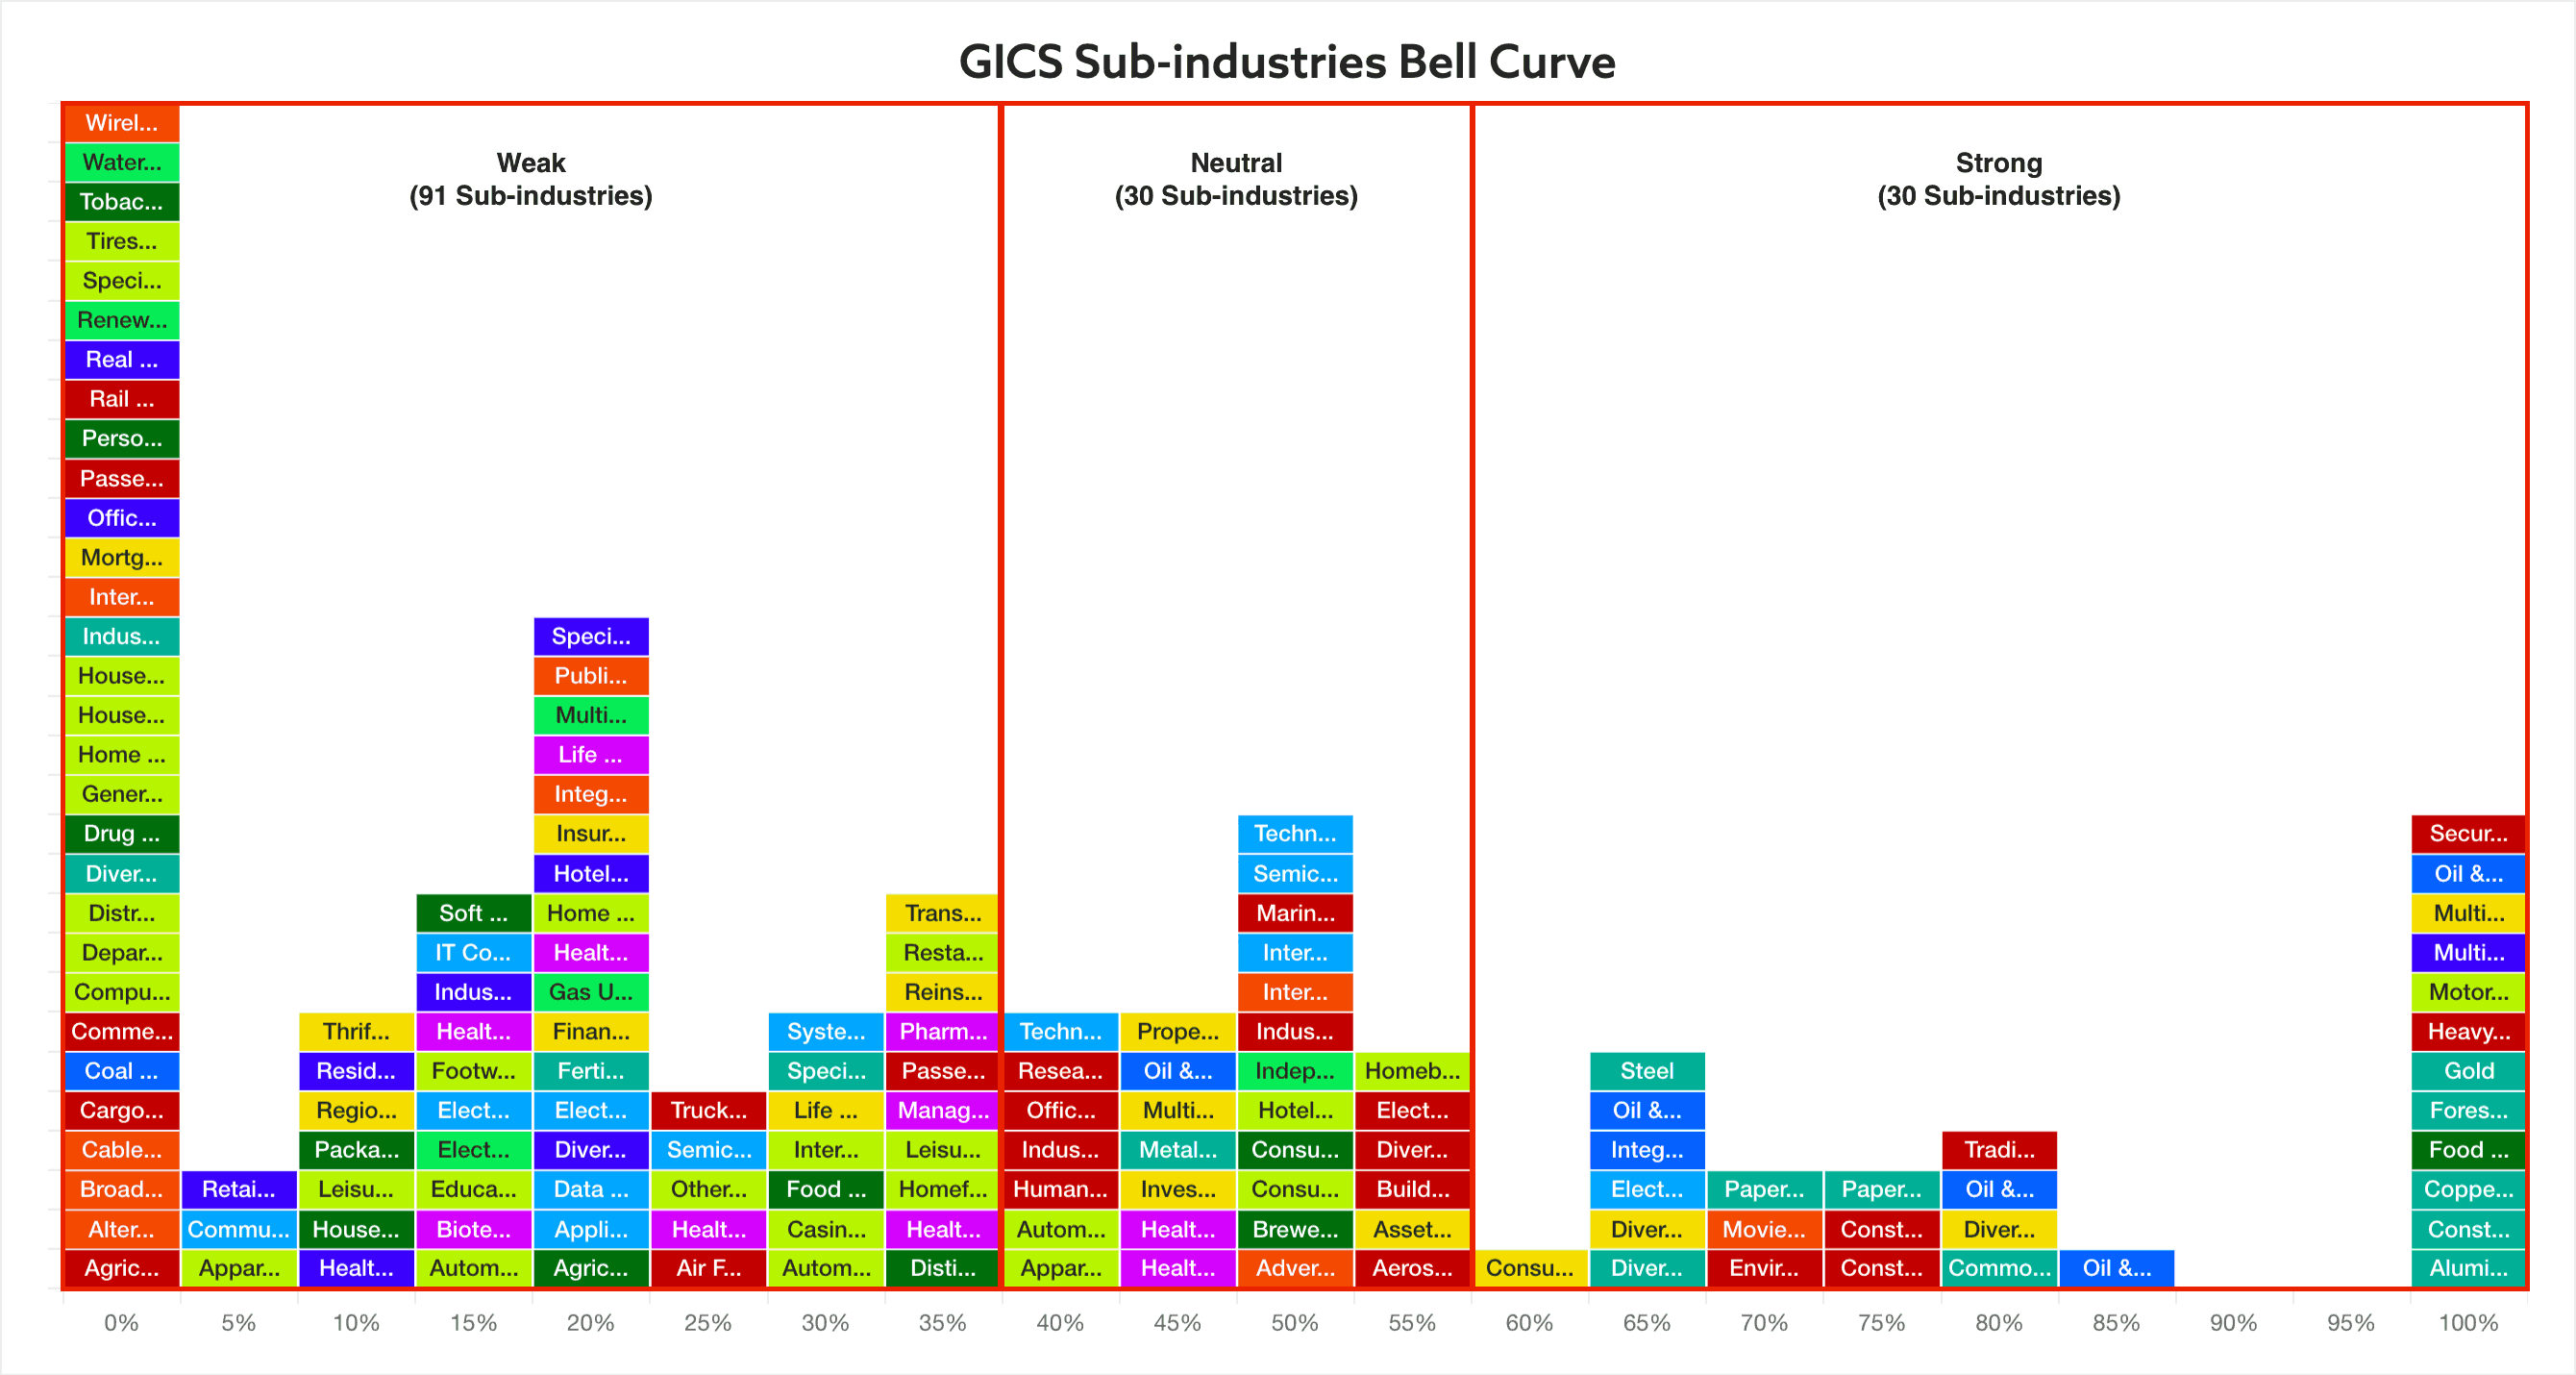
A further reminder, that Members on the site now have access to the new GICS Sub-industries Bell Curve which is automatically updated daily and is also interactive. As you can click into each Sub Industry page and see the individual stocks ordered by their Stage Analysis Technical Attributes (SATA) scores and Mansfield RS (Relative Strength) scores. The data only covers the S&P Composite 1500 currently, so there's a few groups with only a few stocks. But these will broaden out once the full US market data is added later this month.
Hence with this new data for the 163 Sub-industries updated on the site daily, and more to be added with the same features for Sectors (11), Groups (25) and Industries (74) in the coming month. The IBD Industry Groups Bullish Percent post will be retired, and we will instead be using the GICS Bell Curves from the website.
IBD Industry Groups Bell Curve – Line Chart and Group Data
To compare against the previous blog post: IBD Industry Groups Bell Curve – Bullish Percent (5 April 2024).
Below is the Bell Curve line chart and the data tables of the IBD groups bullish percent in order of relative strength and the position changes over the last 1, 2 and 4 weeks. (Members Only)
Become a Stage Analysis Member:
To see more like this – US Stocks watchlist posts, detailed videos each weekend, use our unique Stage Analysis tools, such as the US Stocks & ETFs Screener, Charts, Market Breadth, Group Relative Strength and more...
Join Today
Disclaimer: For educational purpose only. Not investment advice. Seek professional advice from a financial advisor before making any investing decisions.