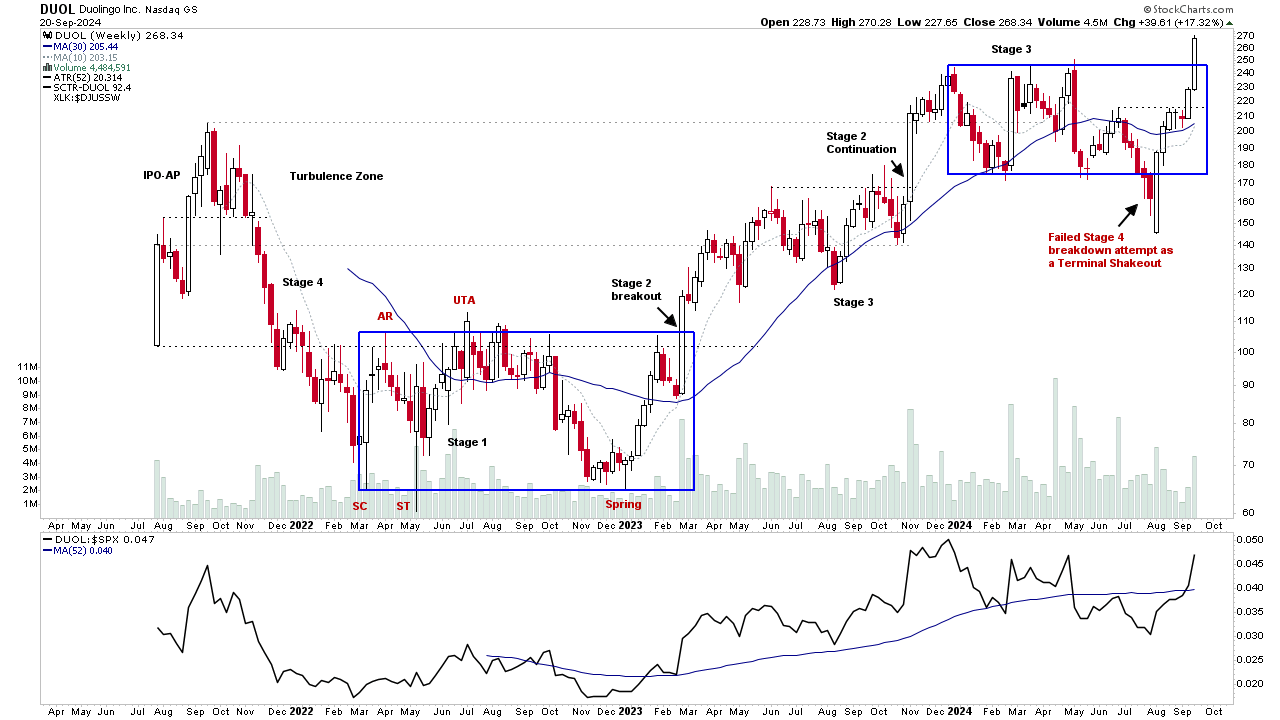
Stage Analysis members weekend video discussing of the US Watchlist Stocks in detail on multiple timeframes, the Significant Weekly Bars, the Sectors and Sub-industries Bell Curves and RS Rankings, the key Market Breadth Charts to determine the Weight of Evidence, and the Major US Stock Market Indexes Update.
Read More

Blog
22 September, 2024
Stage Analysis Members Video – 22 September 2024 (48mins)
21 September, 2024
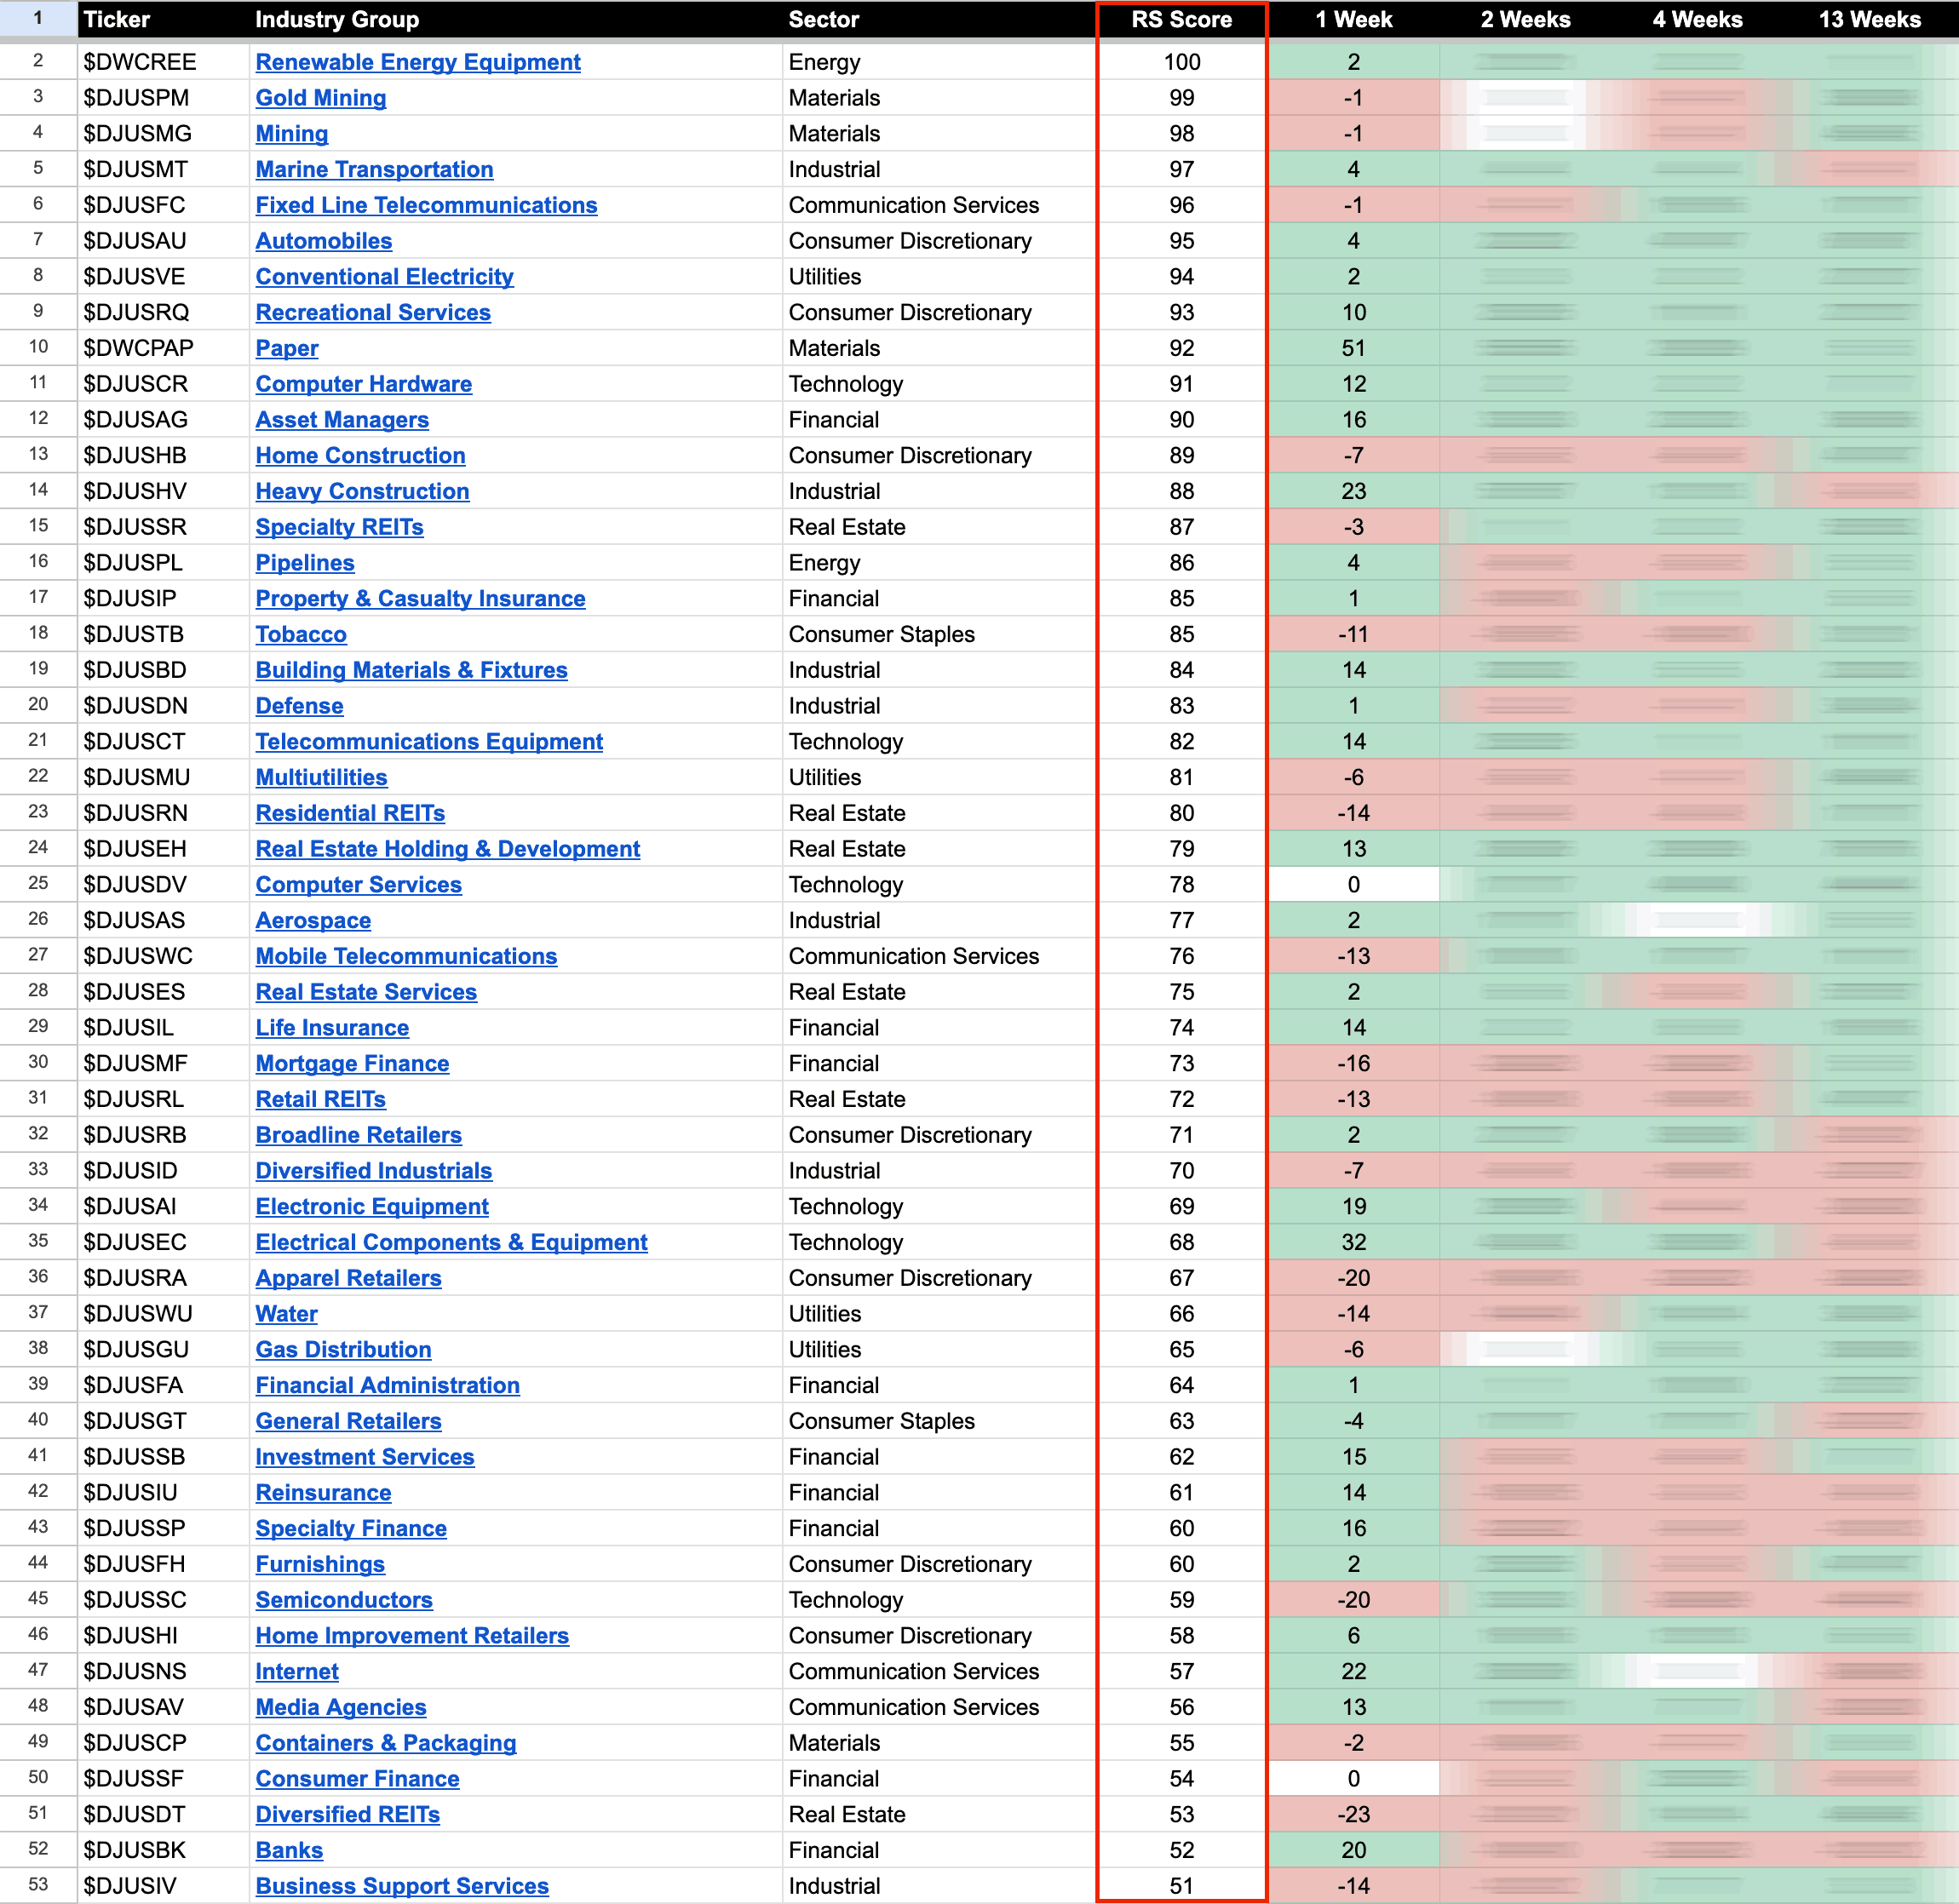
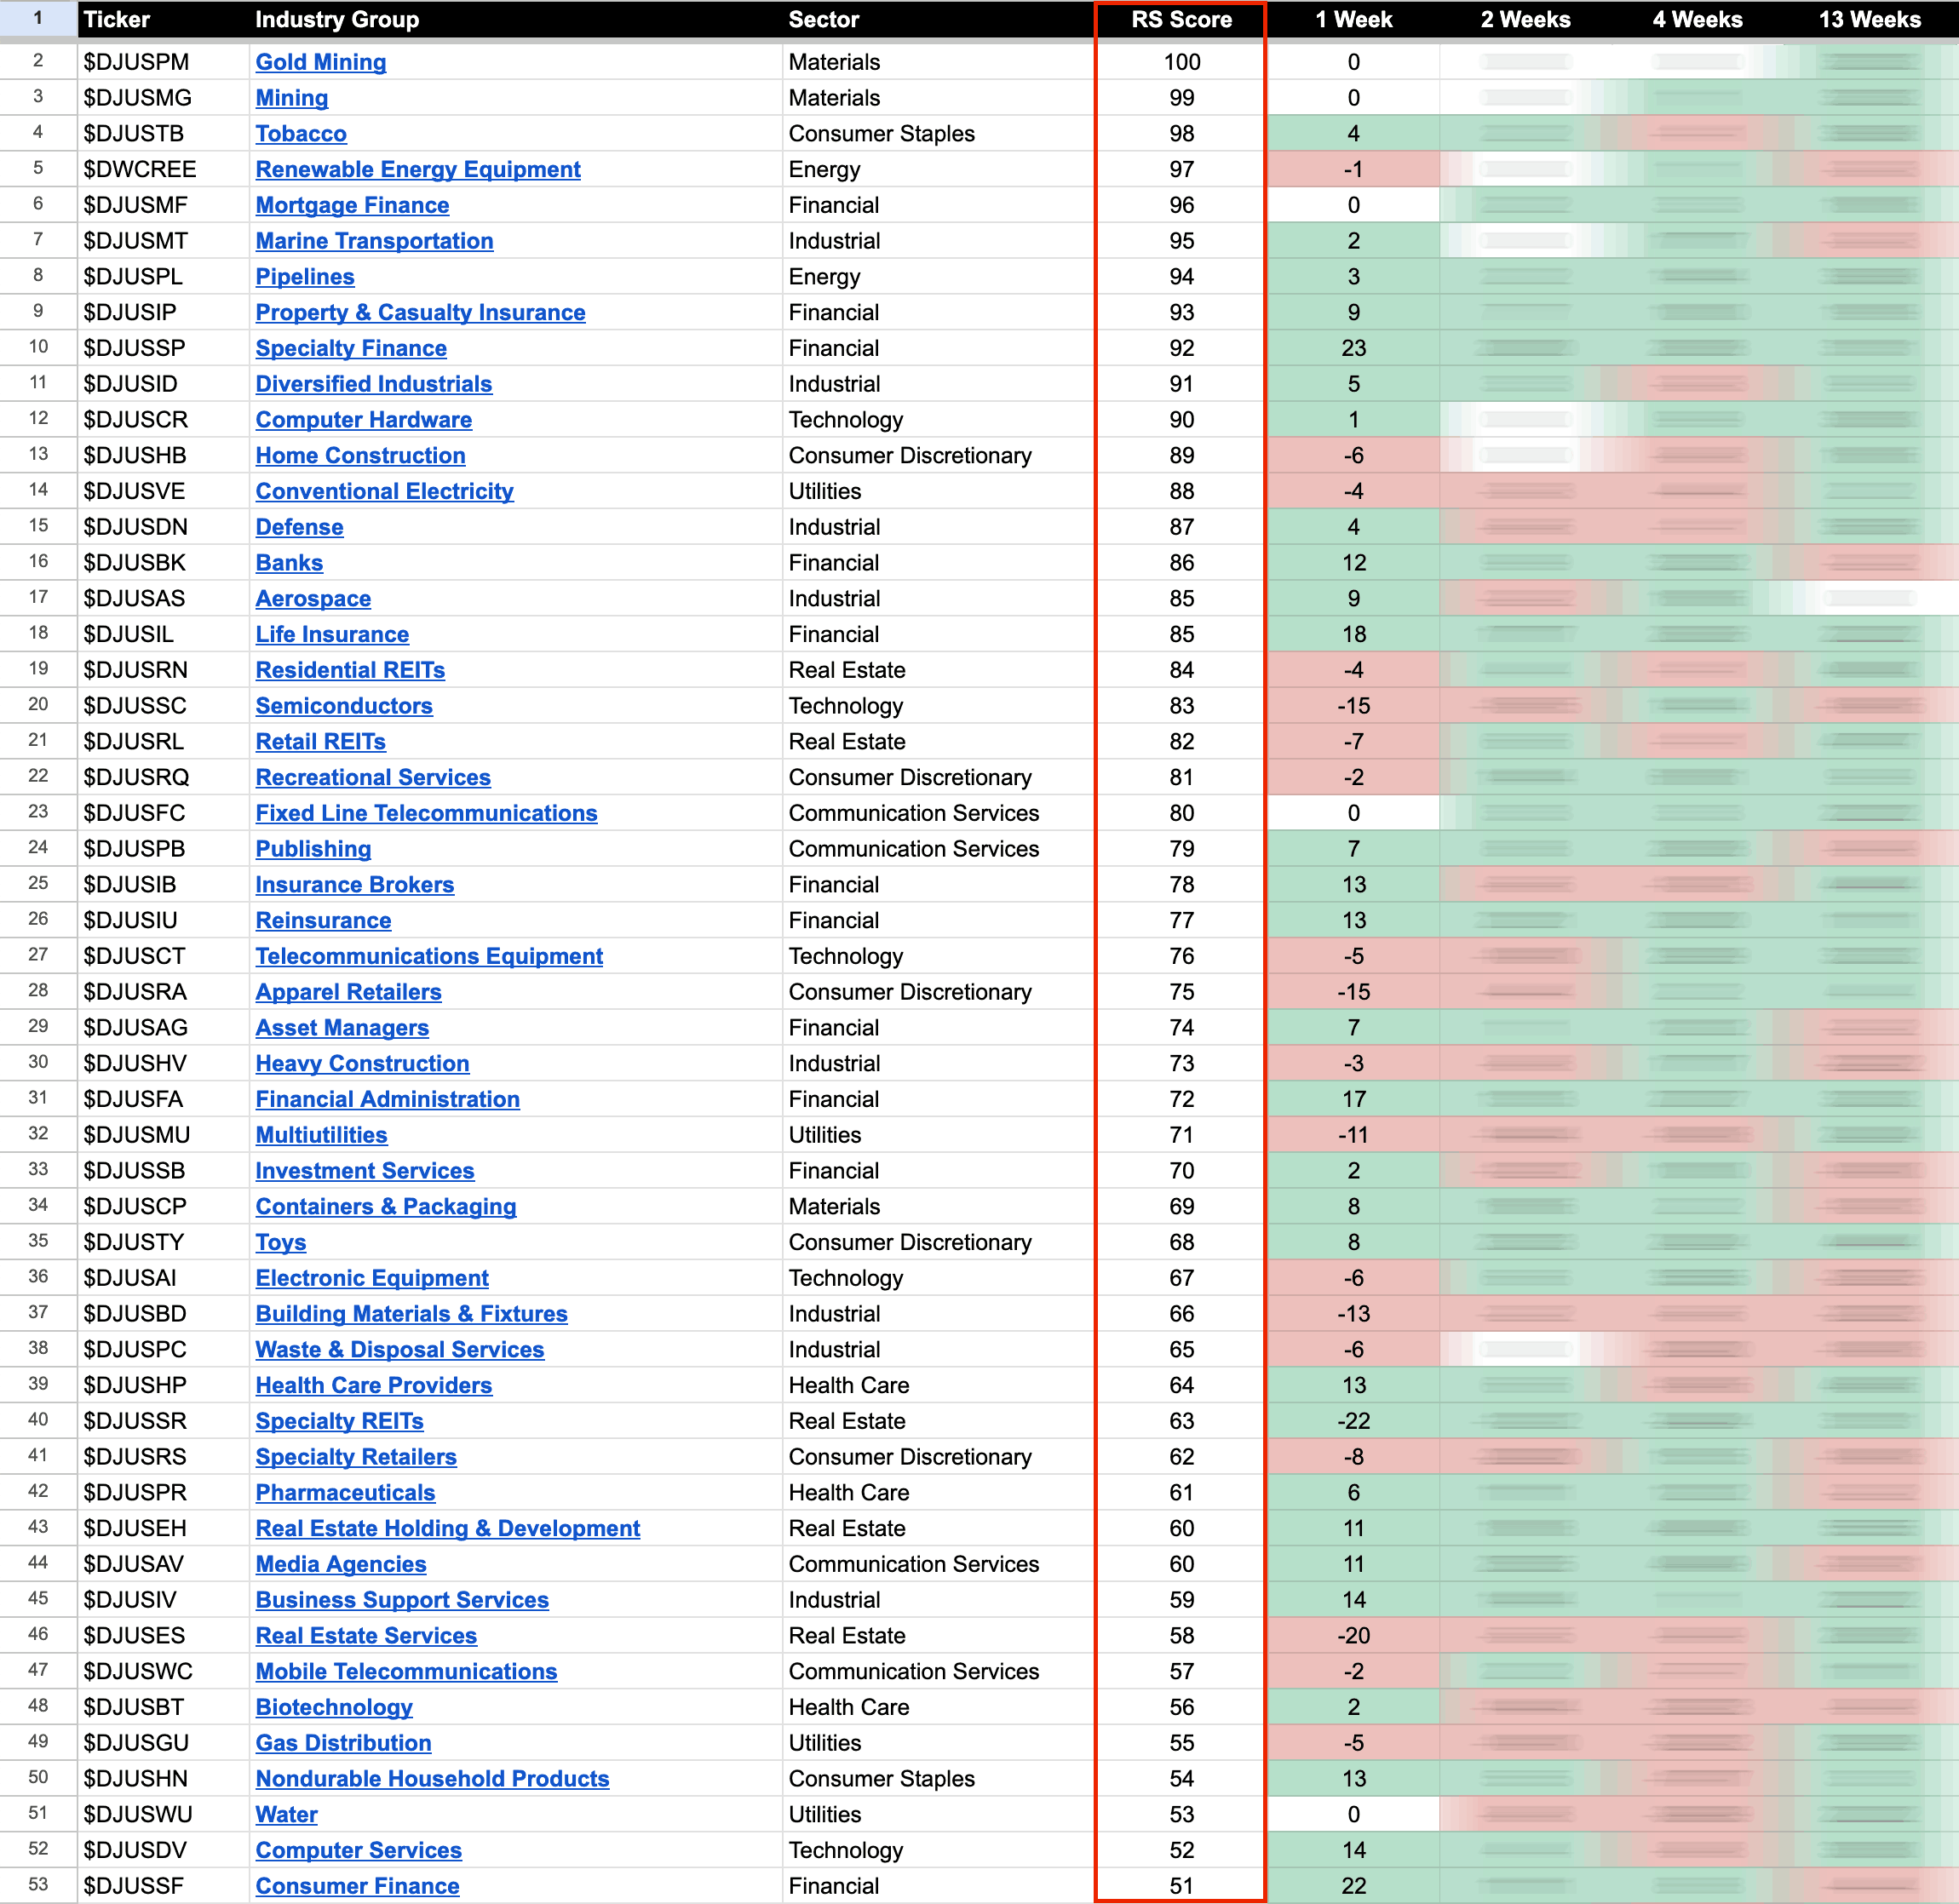
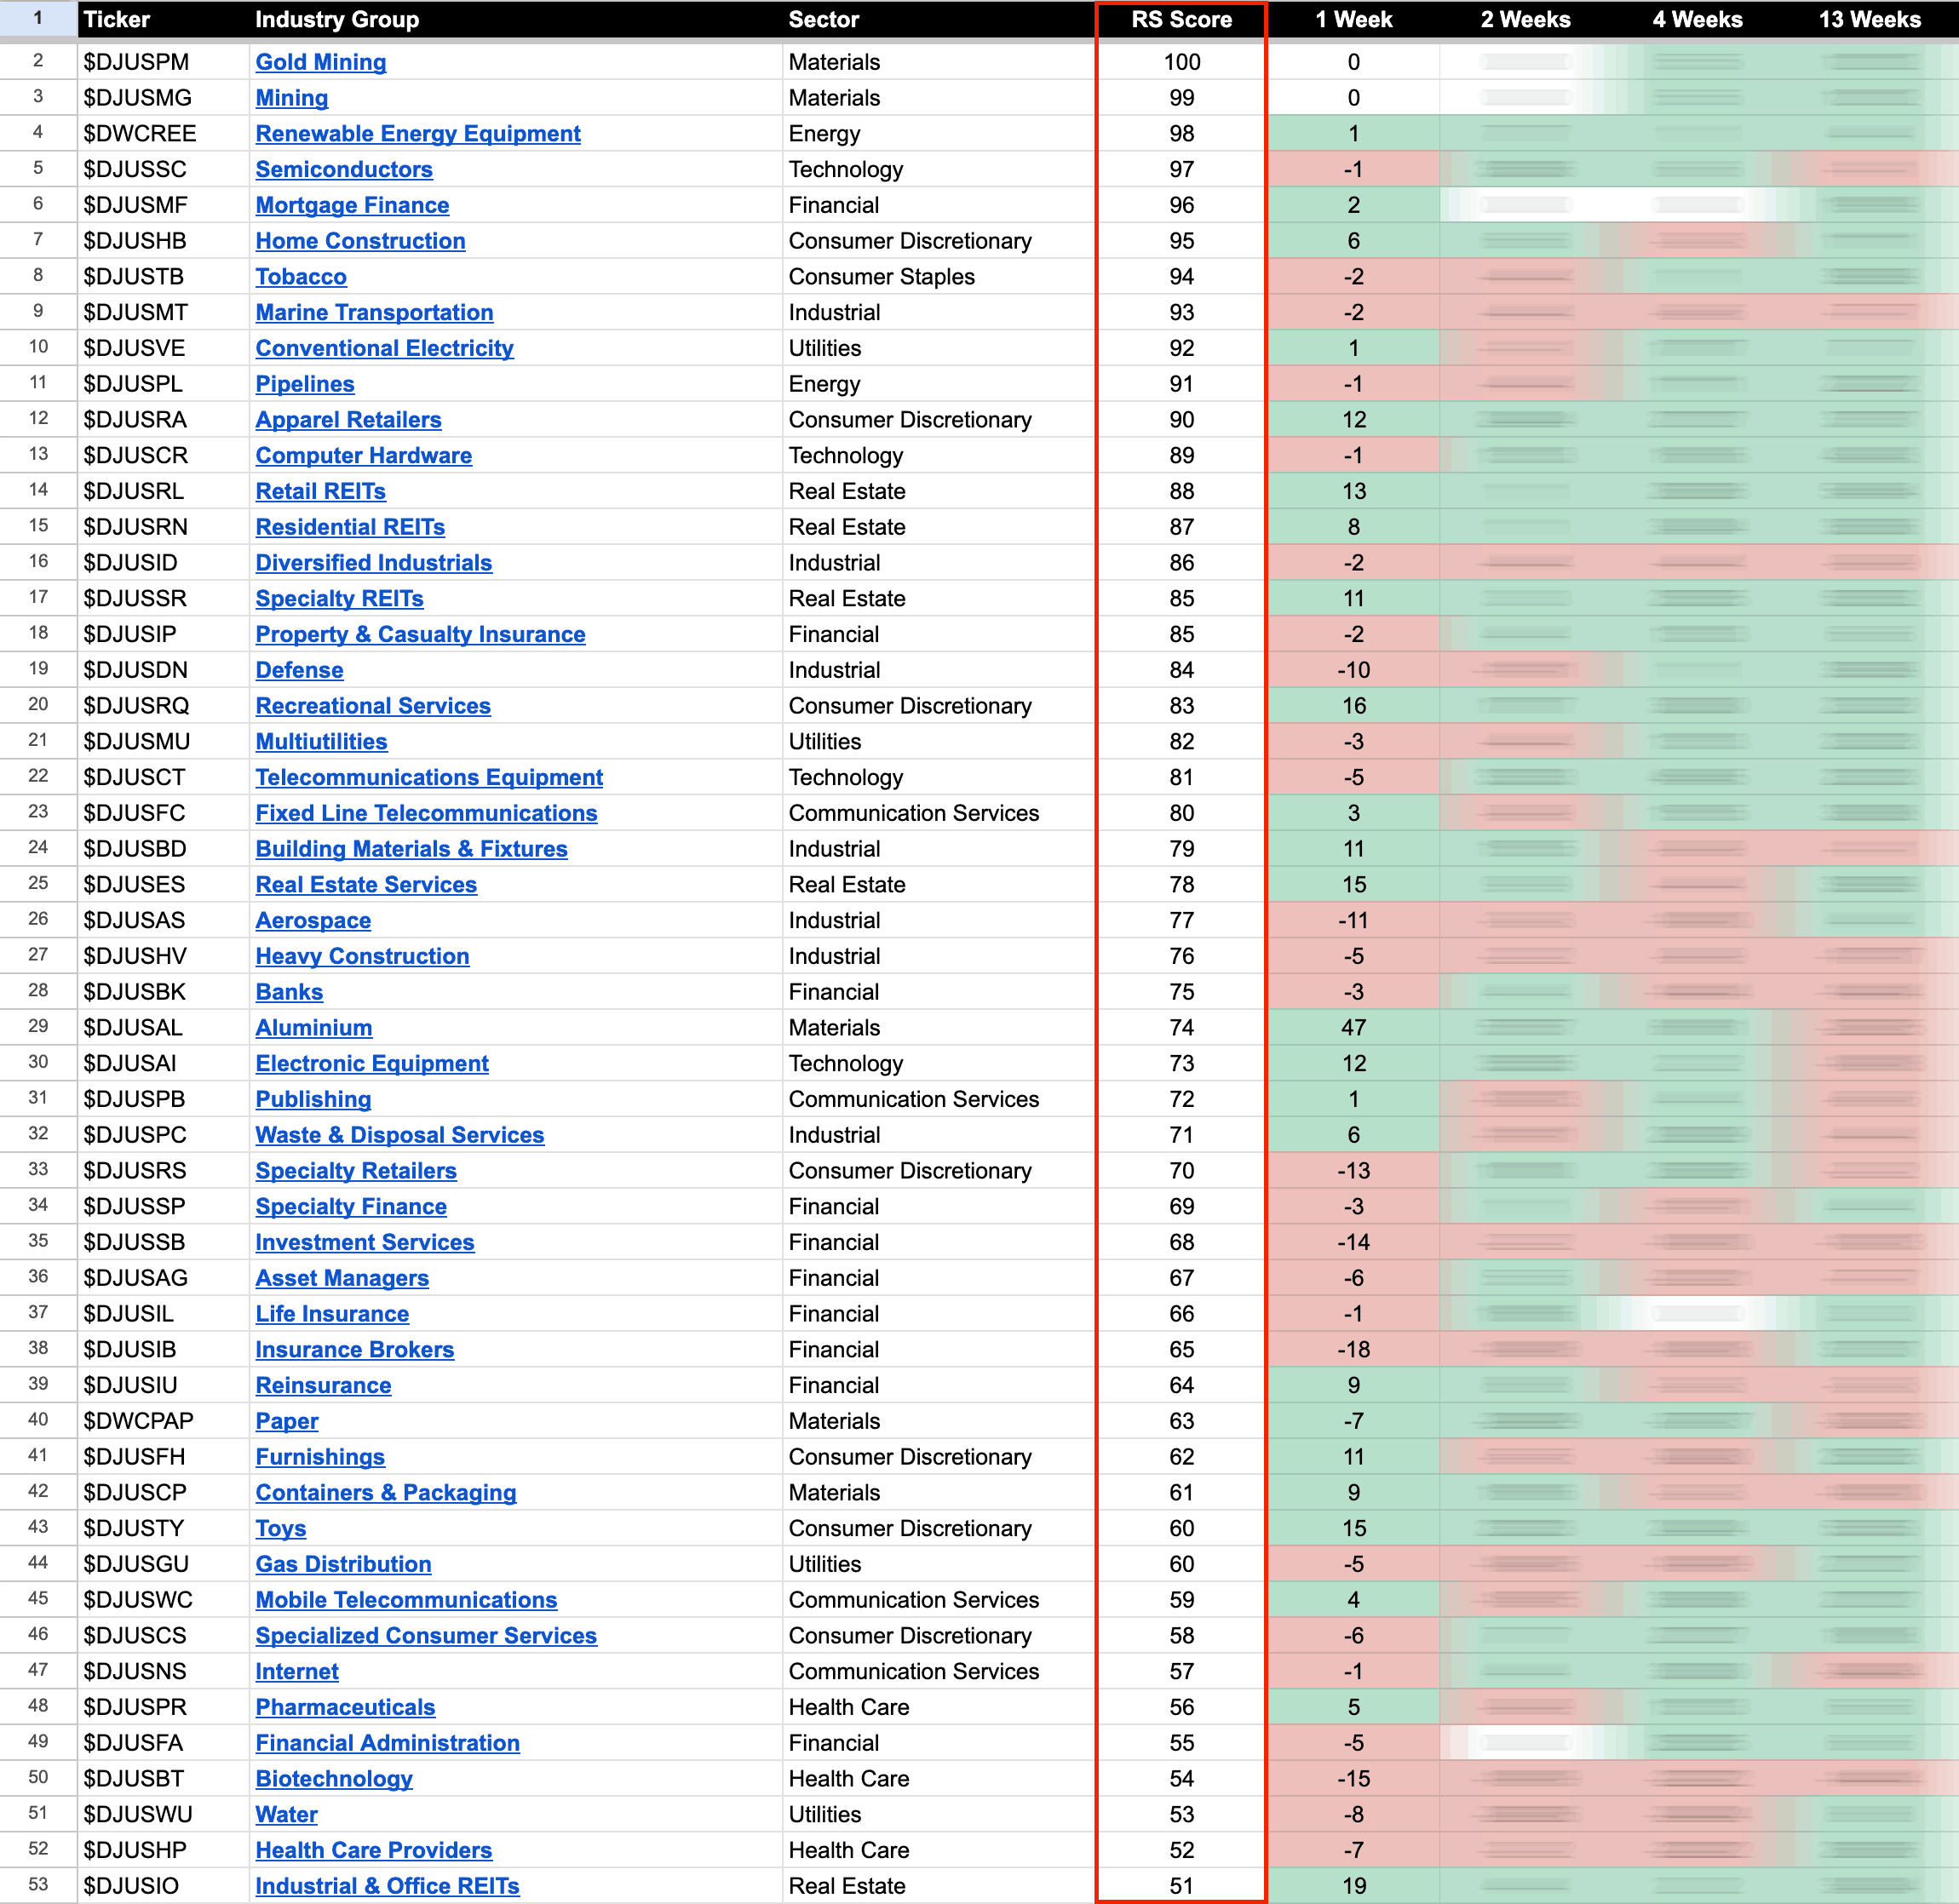
US Stocks Industry Groups Relative Strength Rankings
The purpose of the Relative Strength (RS) tables is to track the short, medium and long term RS changes of the individual groups to find the new leadership earlier than the crowd...
Read More
15 September, 2024
Stage Analysis Members Video – 15 September 2024 (54mins)
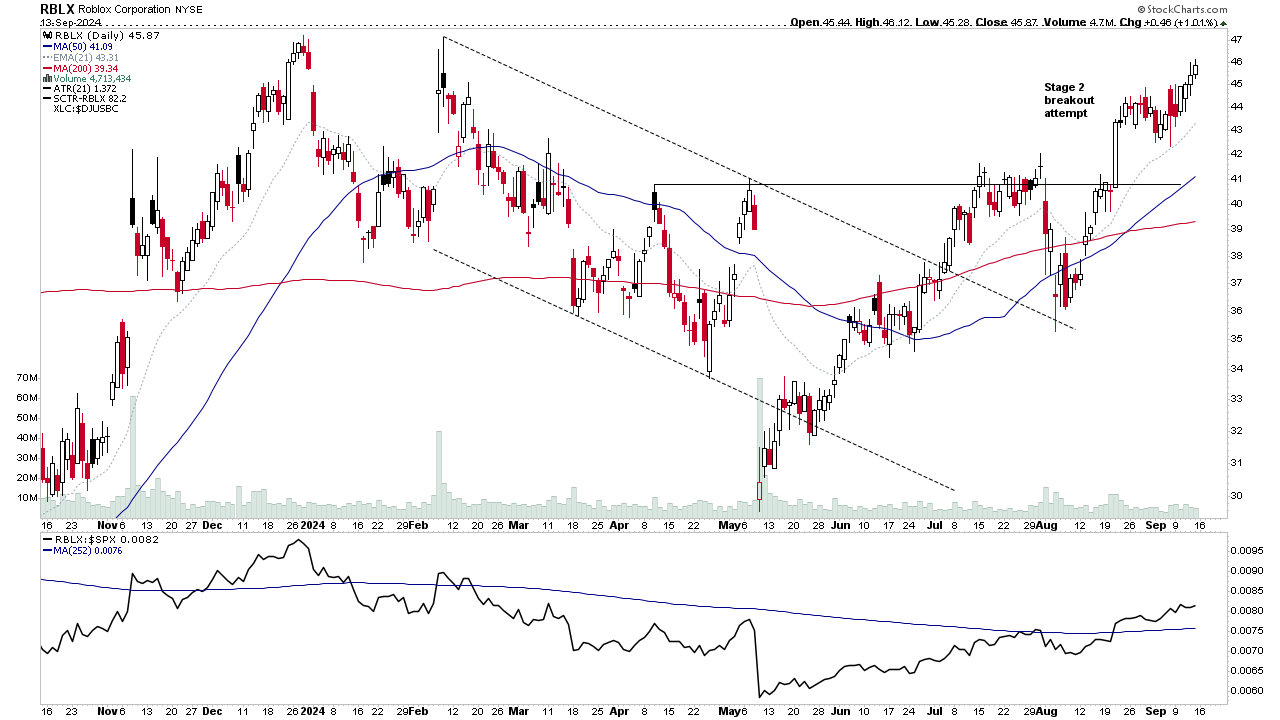
Stage Analysis members weekend video begins this week with a discussion of the US Watchlist Stocks in detail on multiple timeframes, the Significant Weekly Bars, the Sectors and Sub-industries Bell Curves and RS Rankings, the key Market Breadth Charts to determine the Weight of Evidence, and the Major US Stock Market Indexes Update.
Read More
14 September, 2024
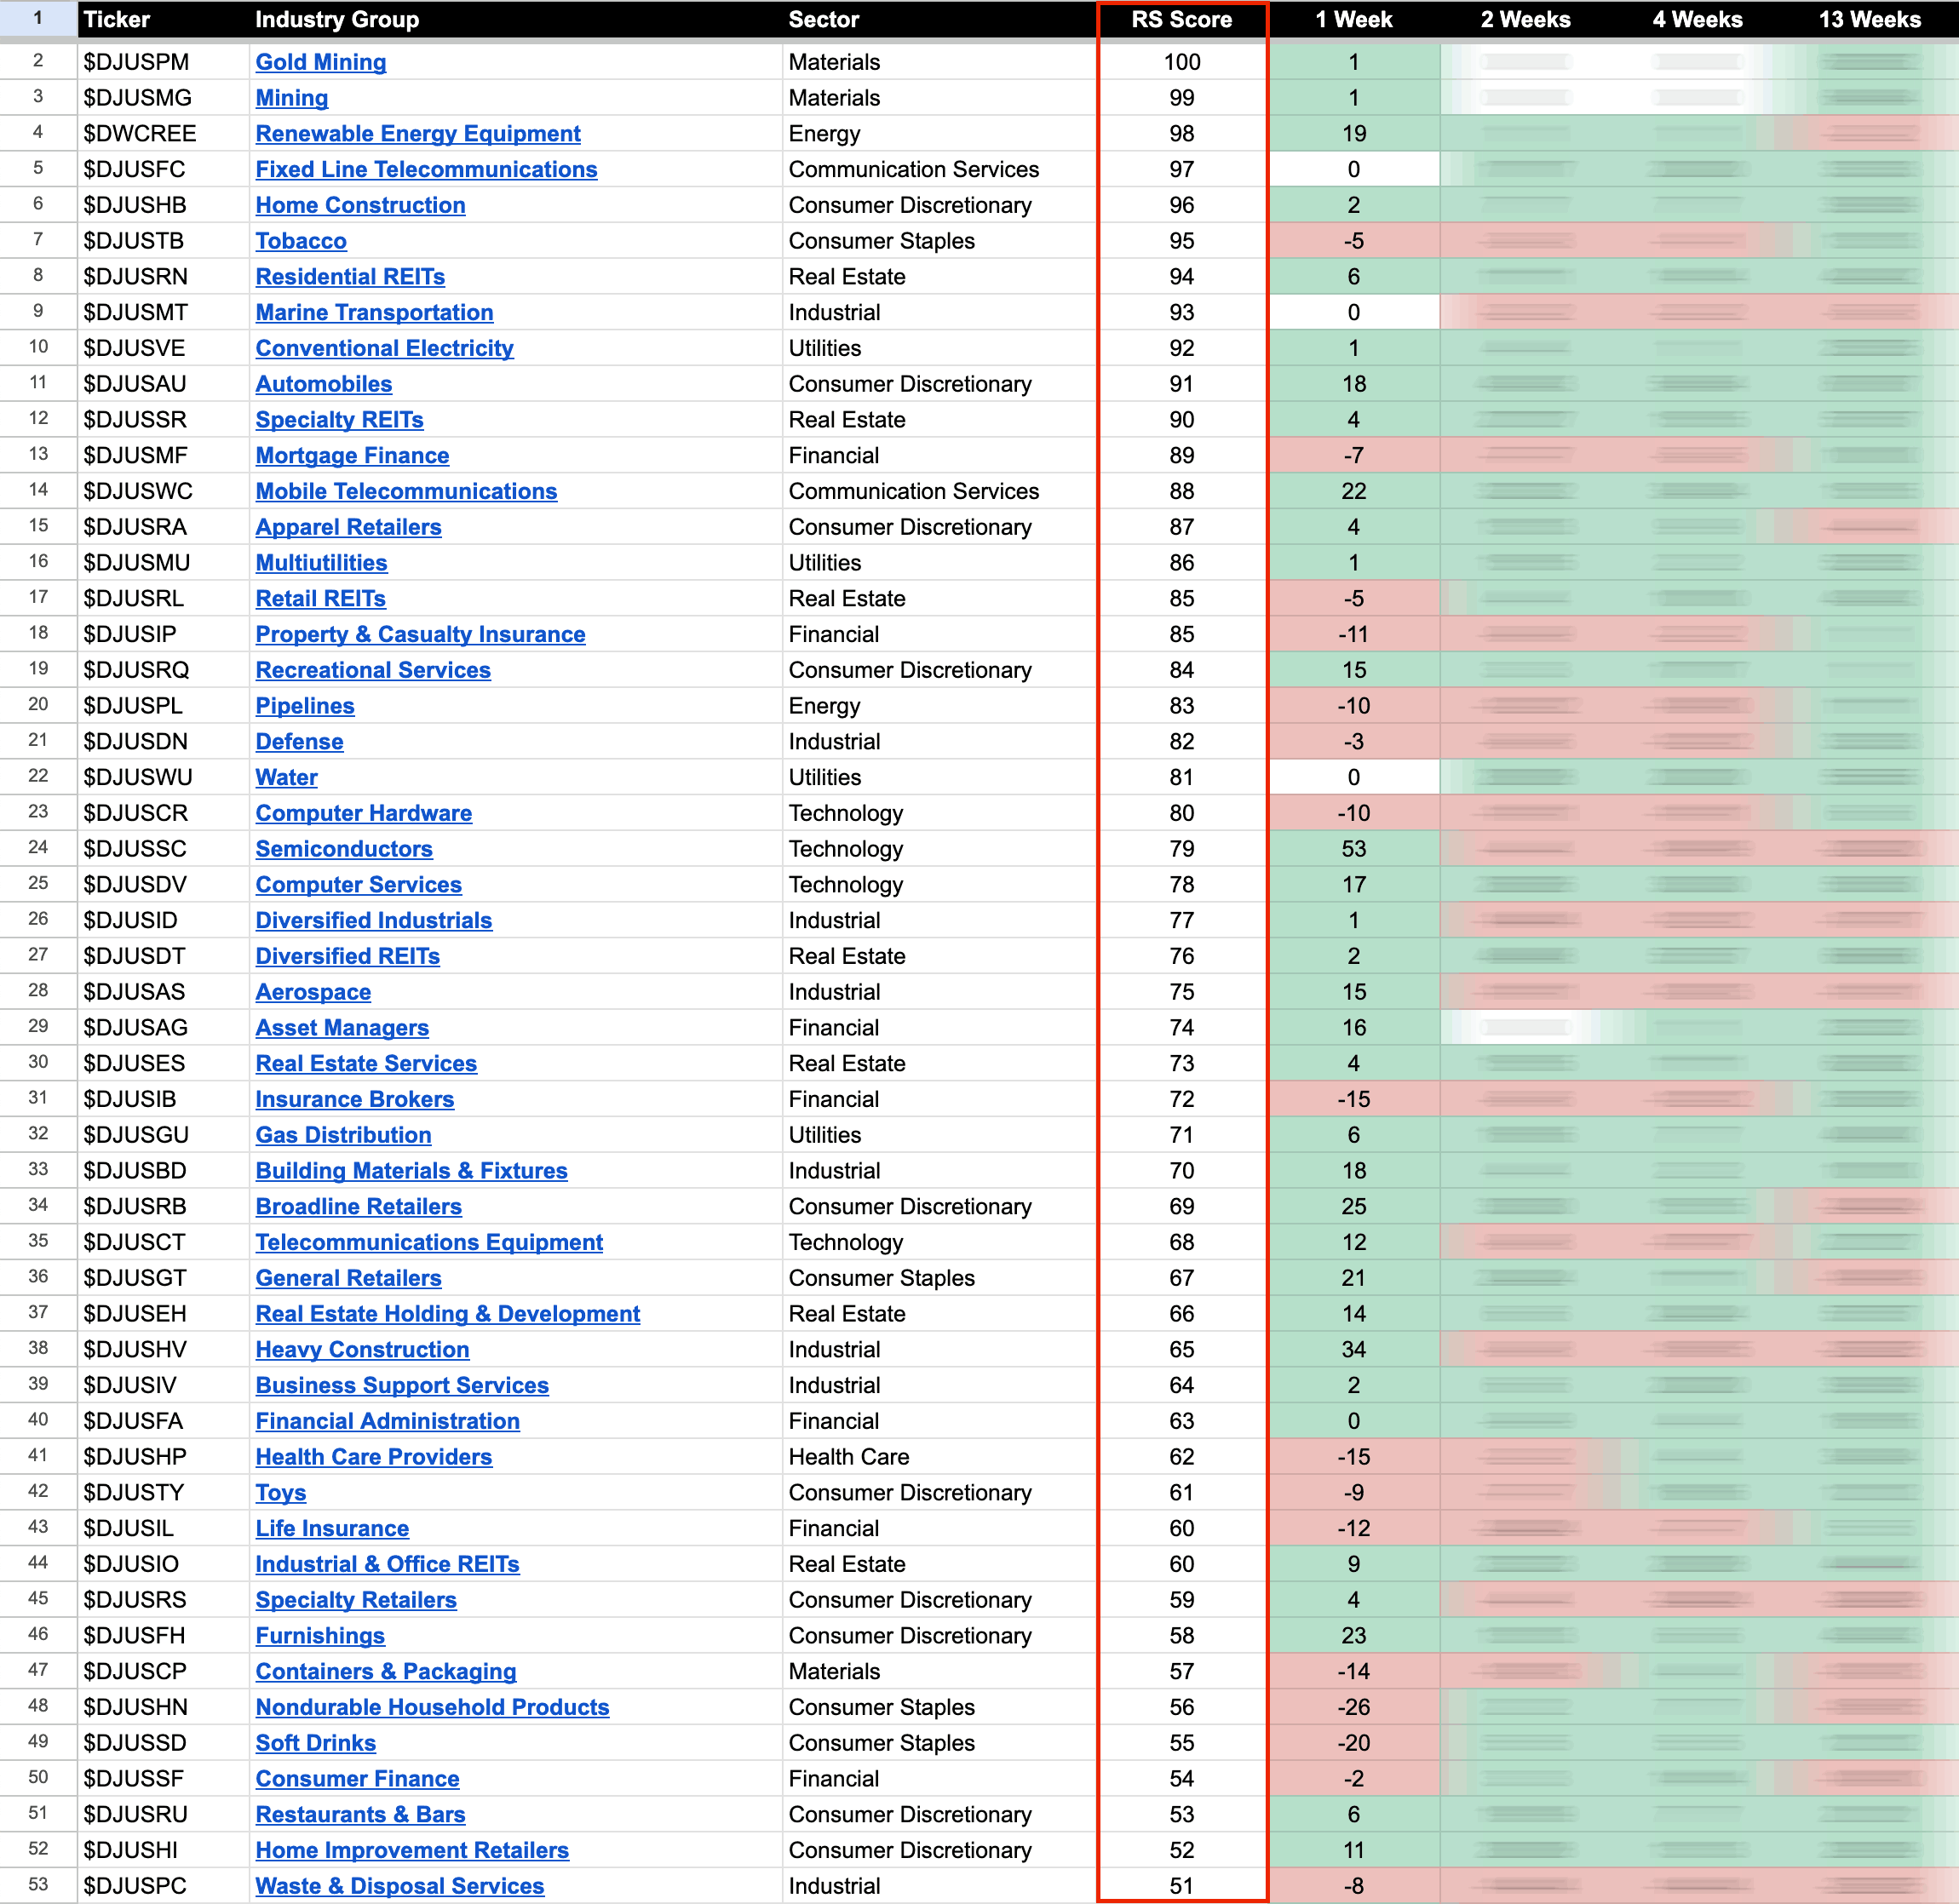
US Stocks Industry Groups Relative Strength Rankings
The purpose of the Relative Strength (RS) tables is to track the short, medium and long term RS changes of the individual groups to find the new leadership earlier than the crowd...
Read More
08 September, 2024
Stage Analysis Members Video – 8 September 2024 (54mins)
Stage Analysis members weekend video discussing the US Watchlist Stocks in detail on multiple timeframes, the Significant Weekly Bars, the Sectors and Sub-industries Bell Curves and RS Rankings, the key Market Breadth Charts to determine the Weight of Evidence, Bitcoin & Ethereum and the Major US Stock Market Indexes Update.
Read More

07 September, 2024
US Stocks Industry Groups Relative Strength Rankings
The purpose of the Relative Strength (RS) tables is to track the short, medium and long term RS changes of the individual groups to find the new leadership earlier than the crowd...
Read More
01 September, 2024
Stage Analysis Members Video – 1 September 2024 (46mins)
Stage Analysis members weekend video starting with a discussion of the new User Chartlists feature and how to use it, followed by the US Watchlist Stocks in detail on multiple timeframes, the Significant Weekly Bars, the Sectors and Sub-industries Bell Curves, the key Market Breadth Charts to determine the Weight of Evidence and the Major US Stock Market Indexes Update.
Read More
31 August, 2024
US Stocks Industry Groups Relative Strength Rankings
The purpose of the Relative Strength (RS) tables is to track the short, medium and long term RS changes of the individual groups to find the new leadership earlier than the crowd...
Read More
25 August, 2024
Stage Analysis Members Video – 25 August 2024 (1hr 3mins)
Stage Analysis members weekend video with a discussion of the Significant Weekly Bars, new features discussion, the Sectors and Sub-industries Bell Curves, the US Watchlist Stocks in detail on multiple timeframes, the key Market Breadth Charts to determine the Weight of Evidence and the Major US Stock Market Indexes Update.
Read More
24 August, 2024
US Stocks Industry Groups Relative Strength Rankings
The purpose of the Relative Strength (RS) tables is to track the short, medium and long term RS changes of the individual groups to find the new leadership earlier than the crowd...
Read More