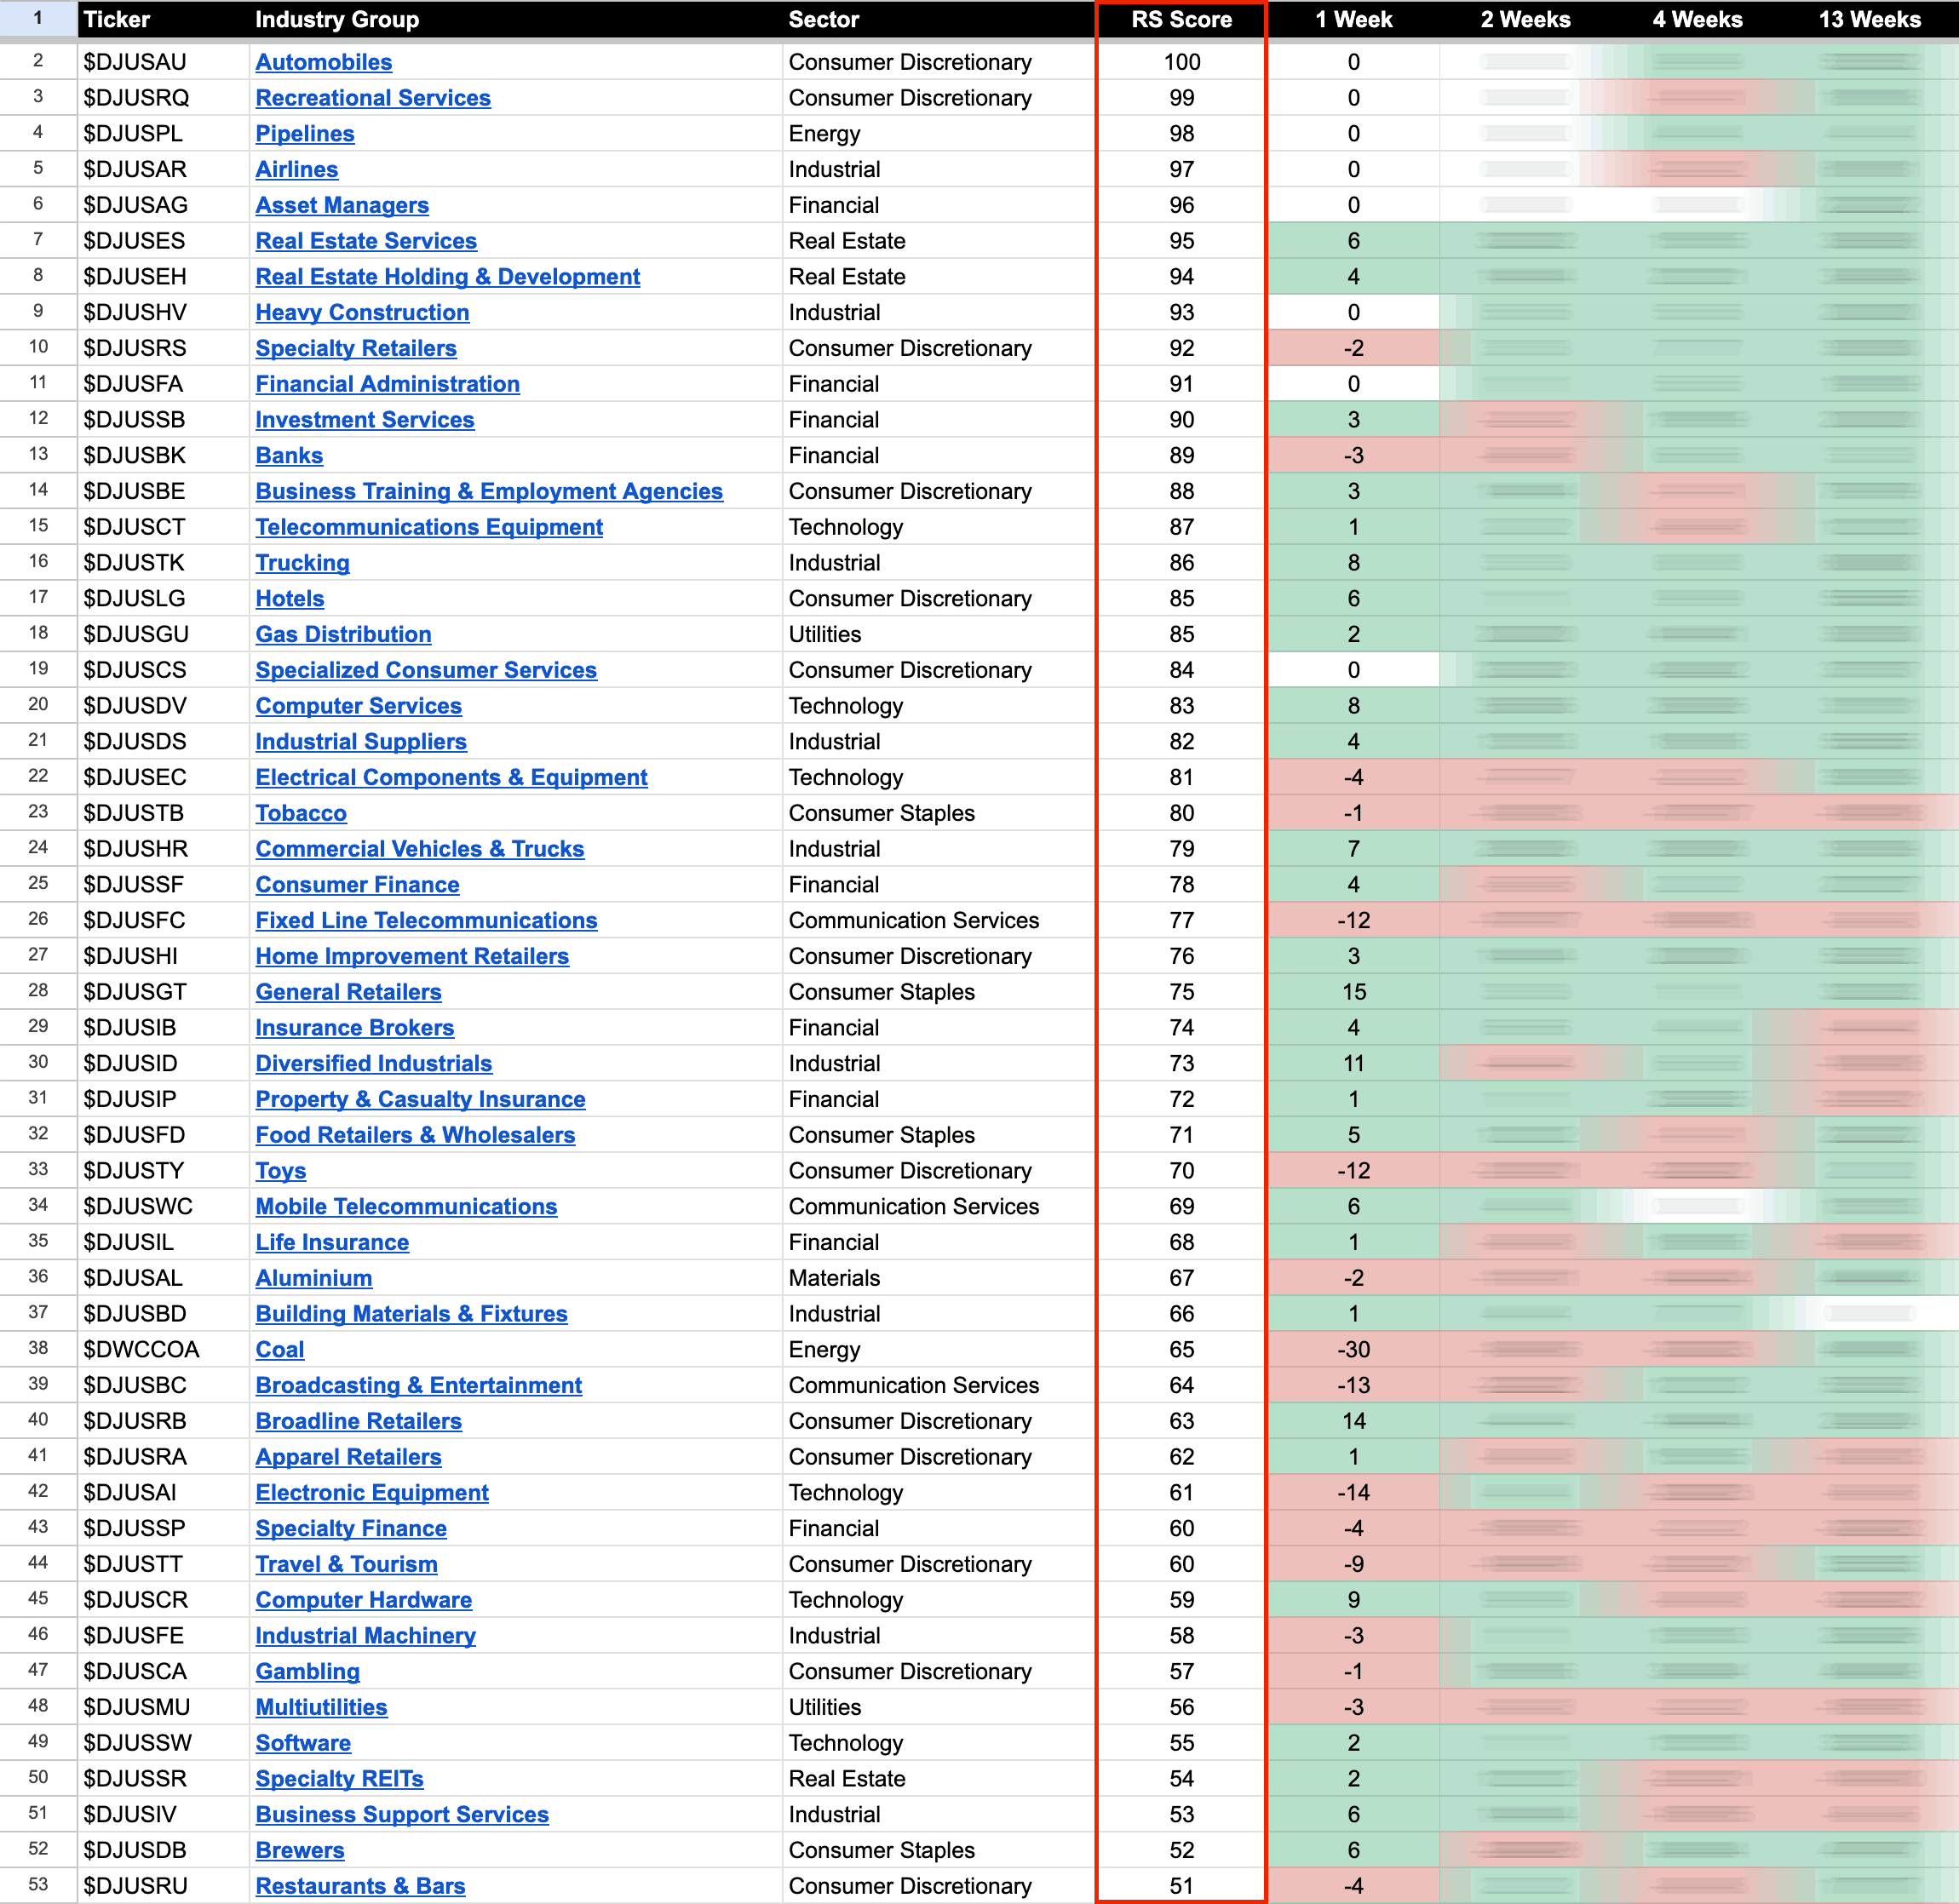
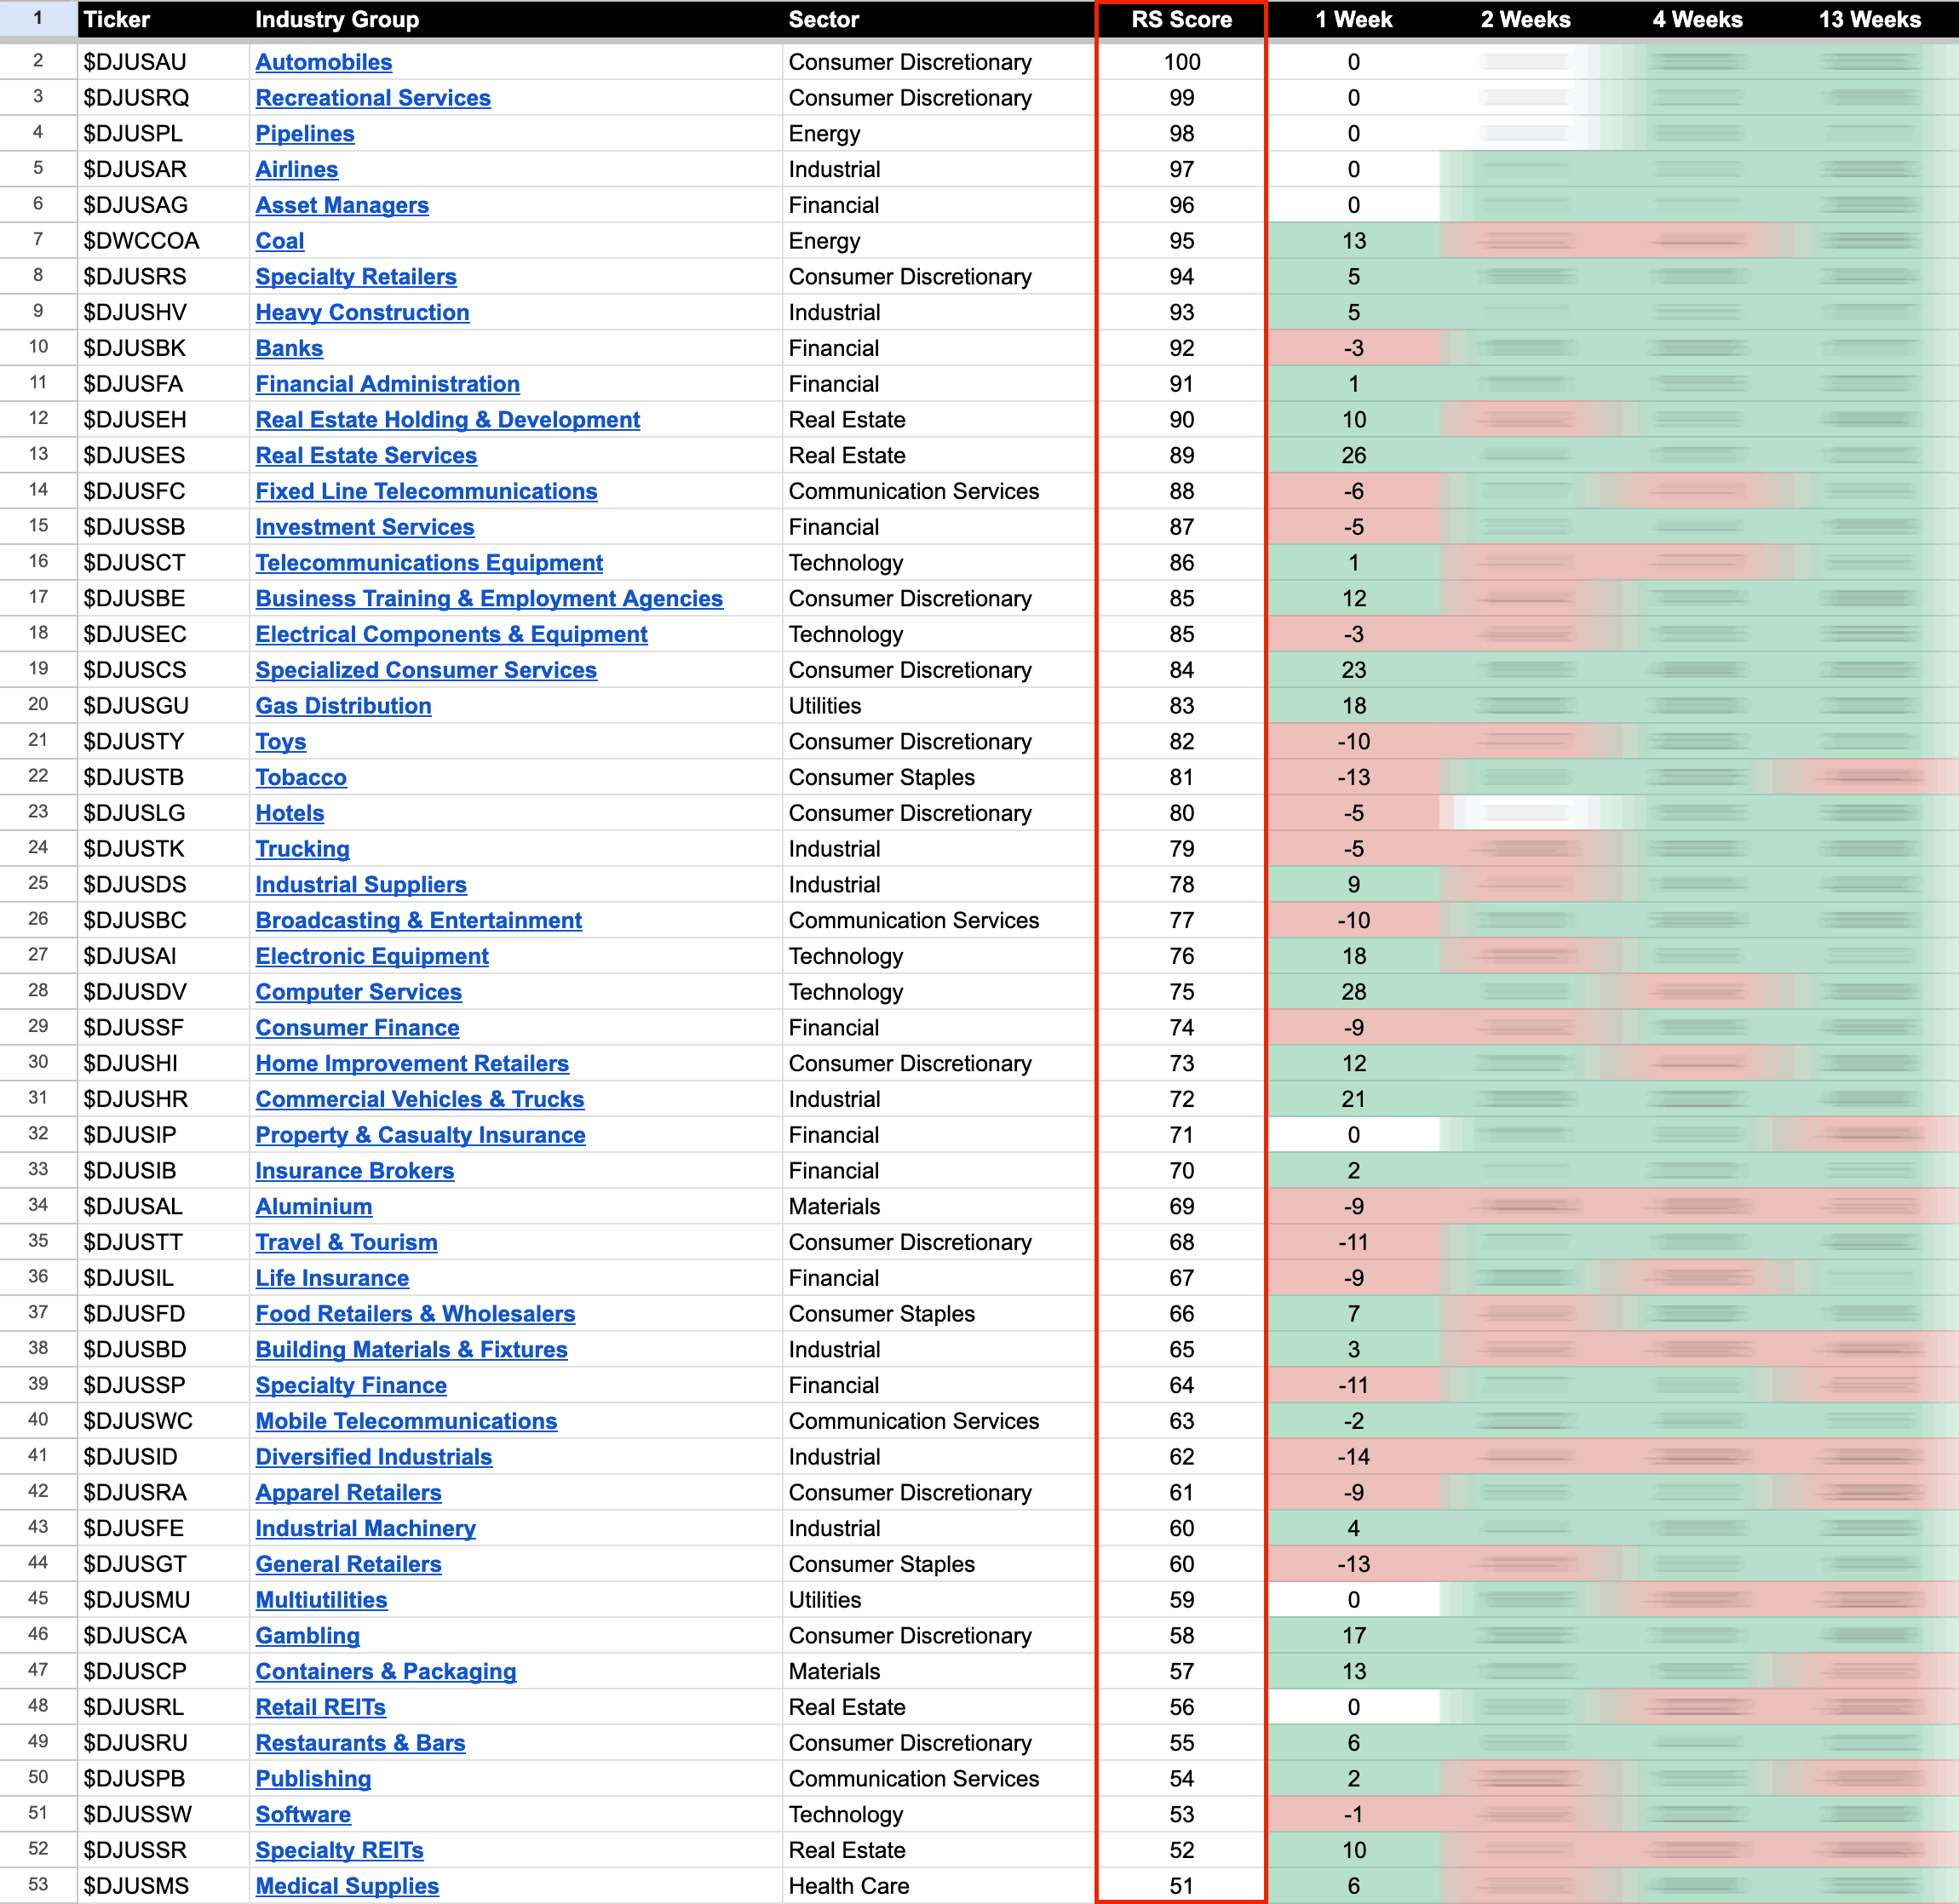
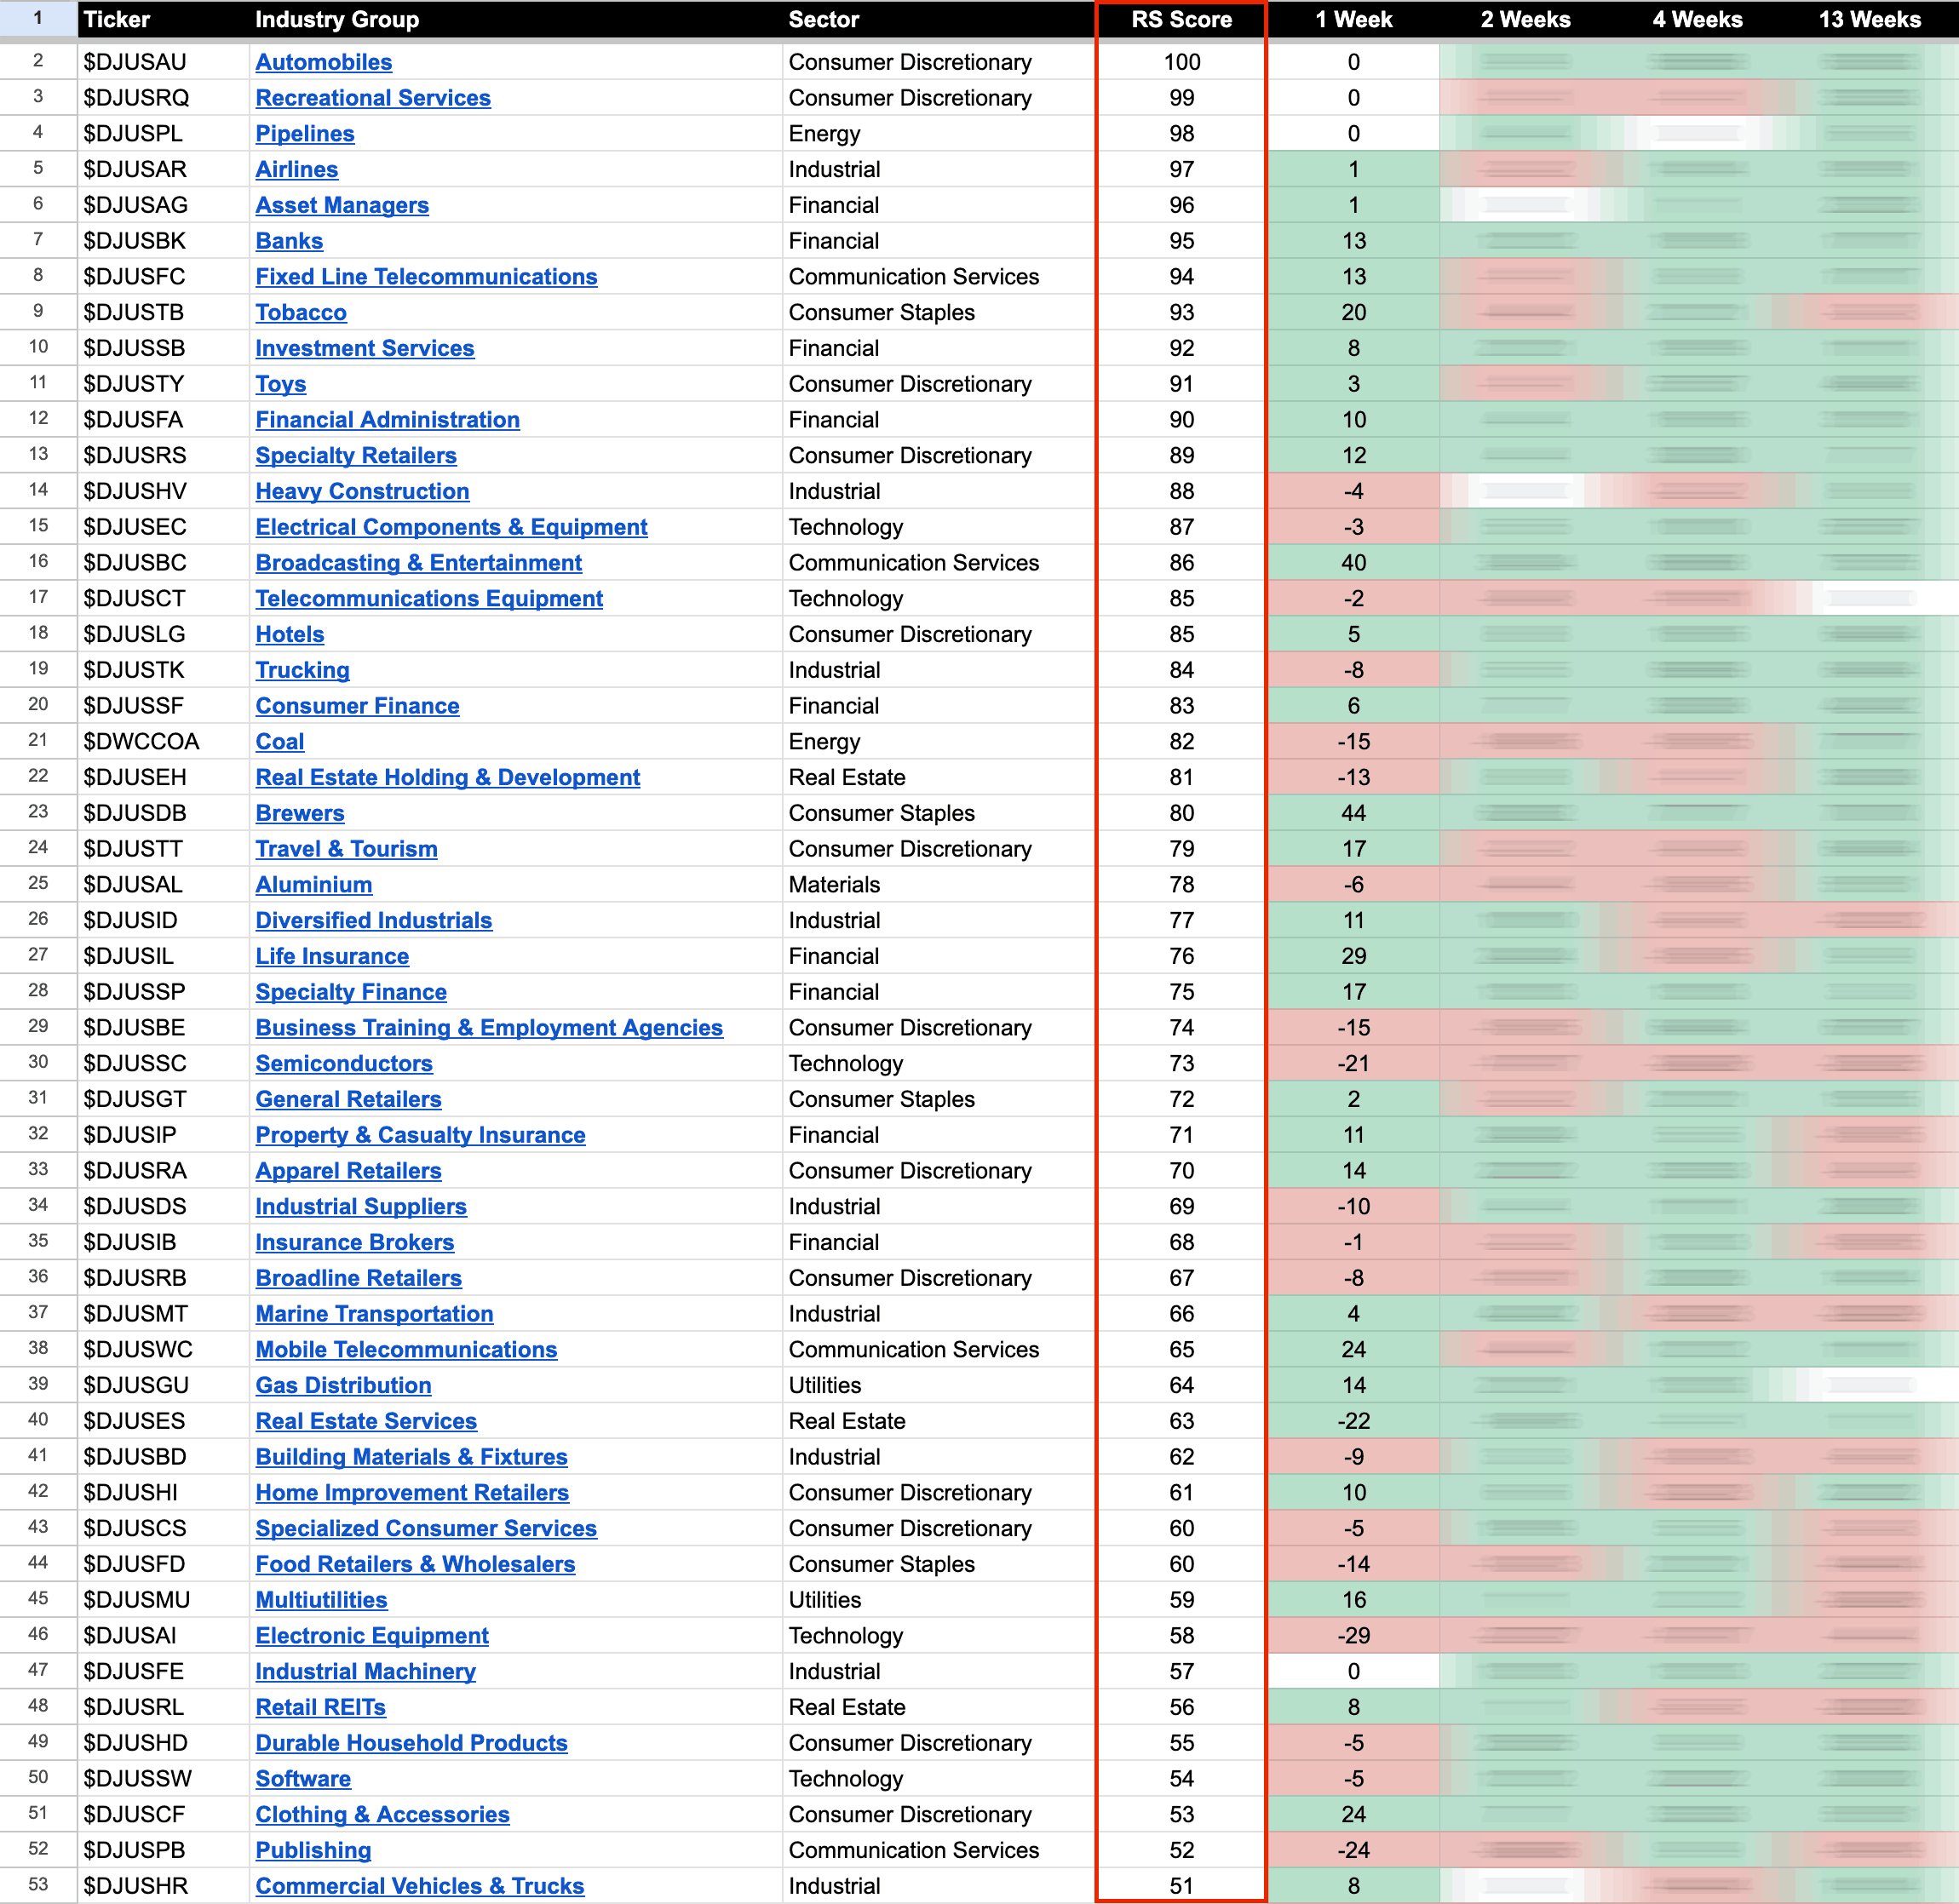
The purpose of the Relative Strength (RS) tables is to track the short, medium and long term RS changes of the individual groups to find the new leadership earlier than the crowd...
Read More

Blog
13 December, 2024
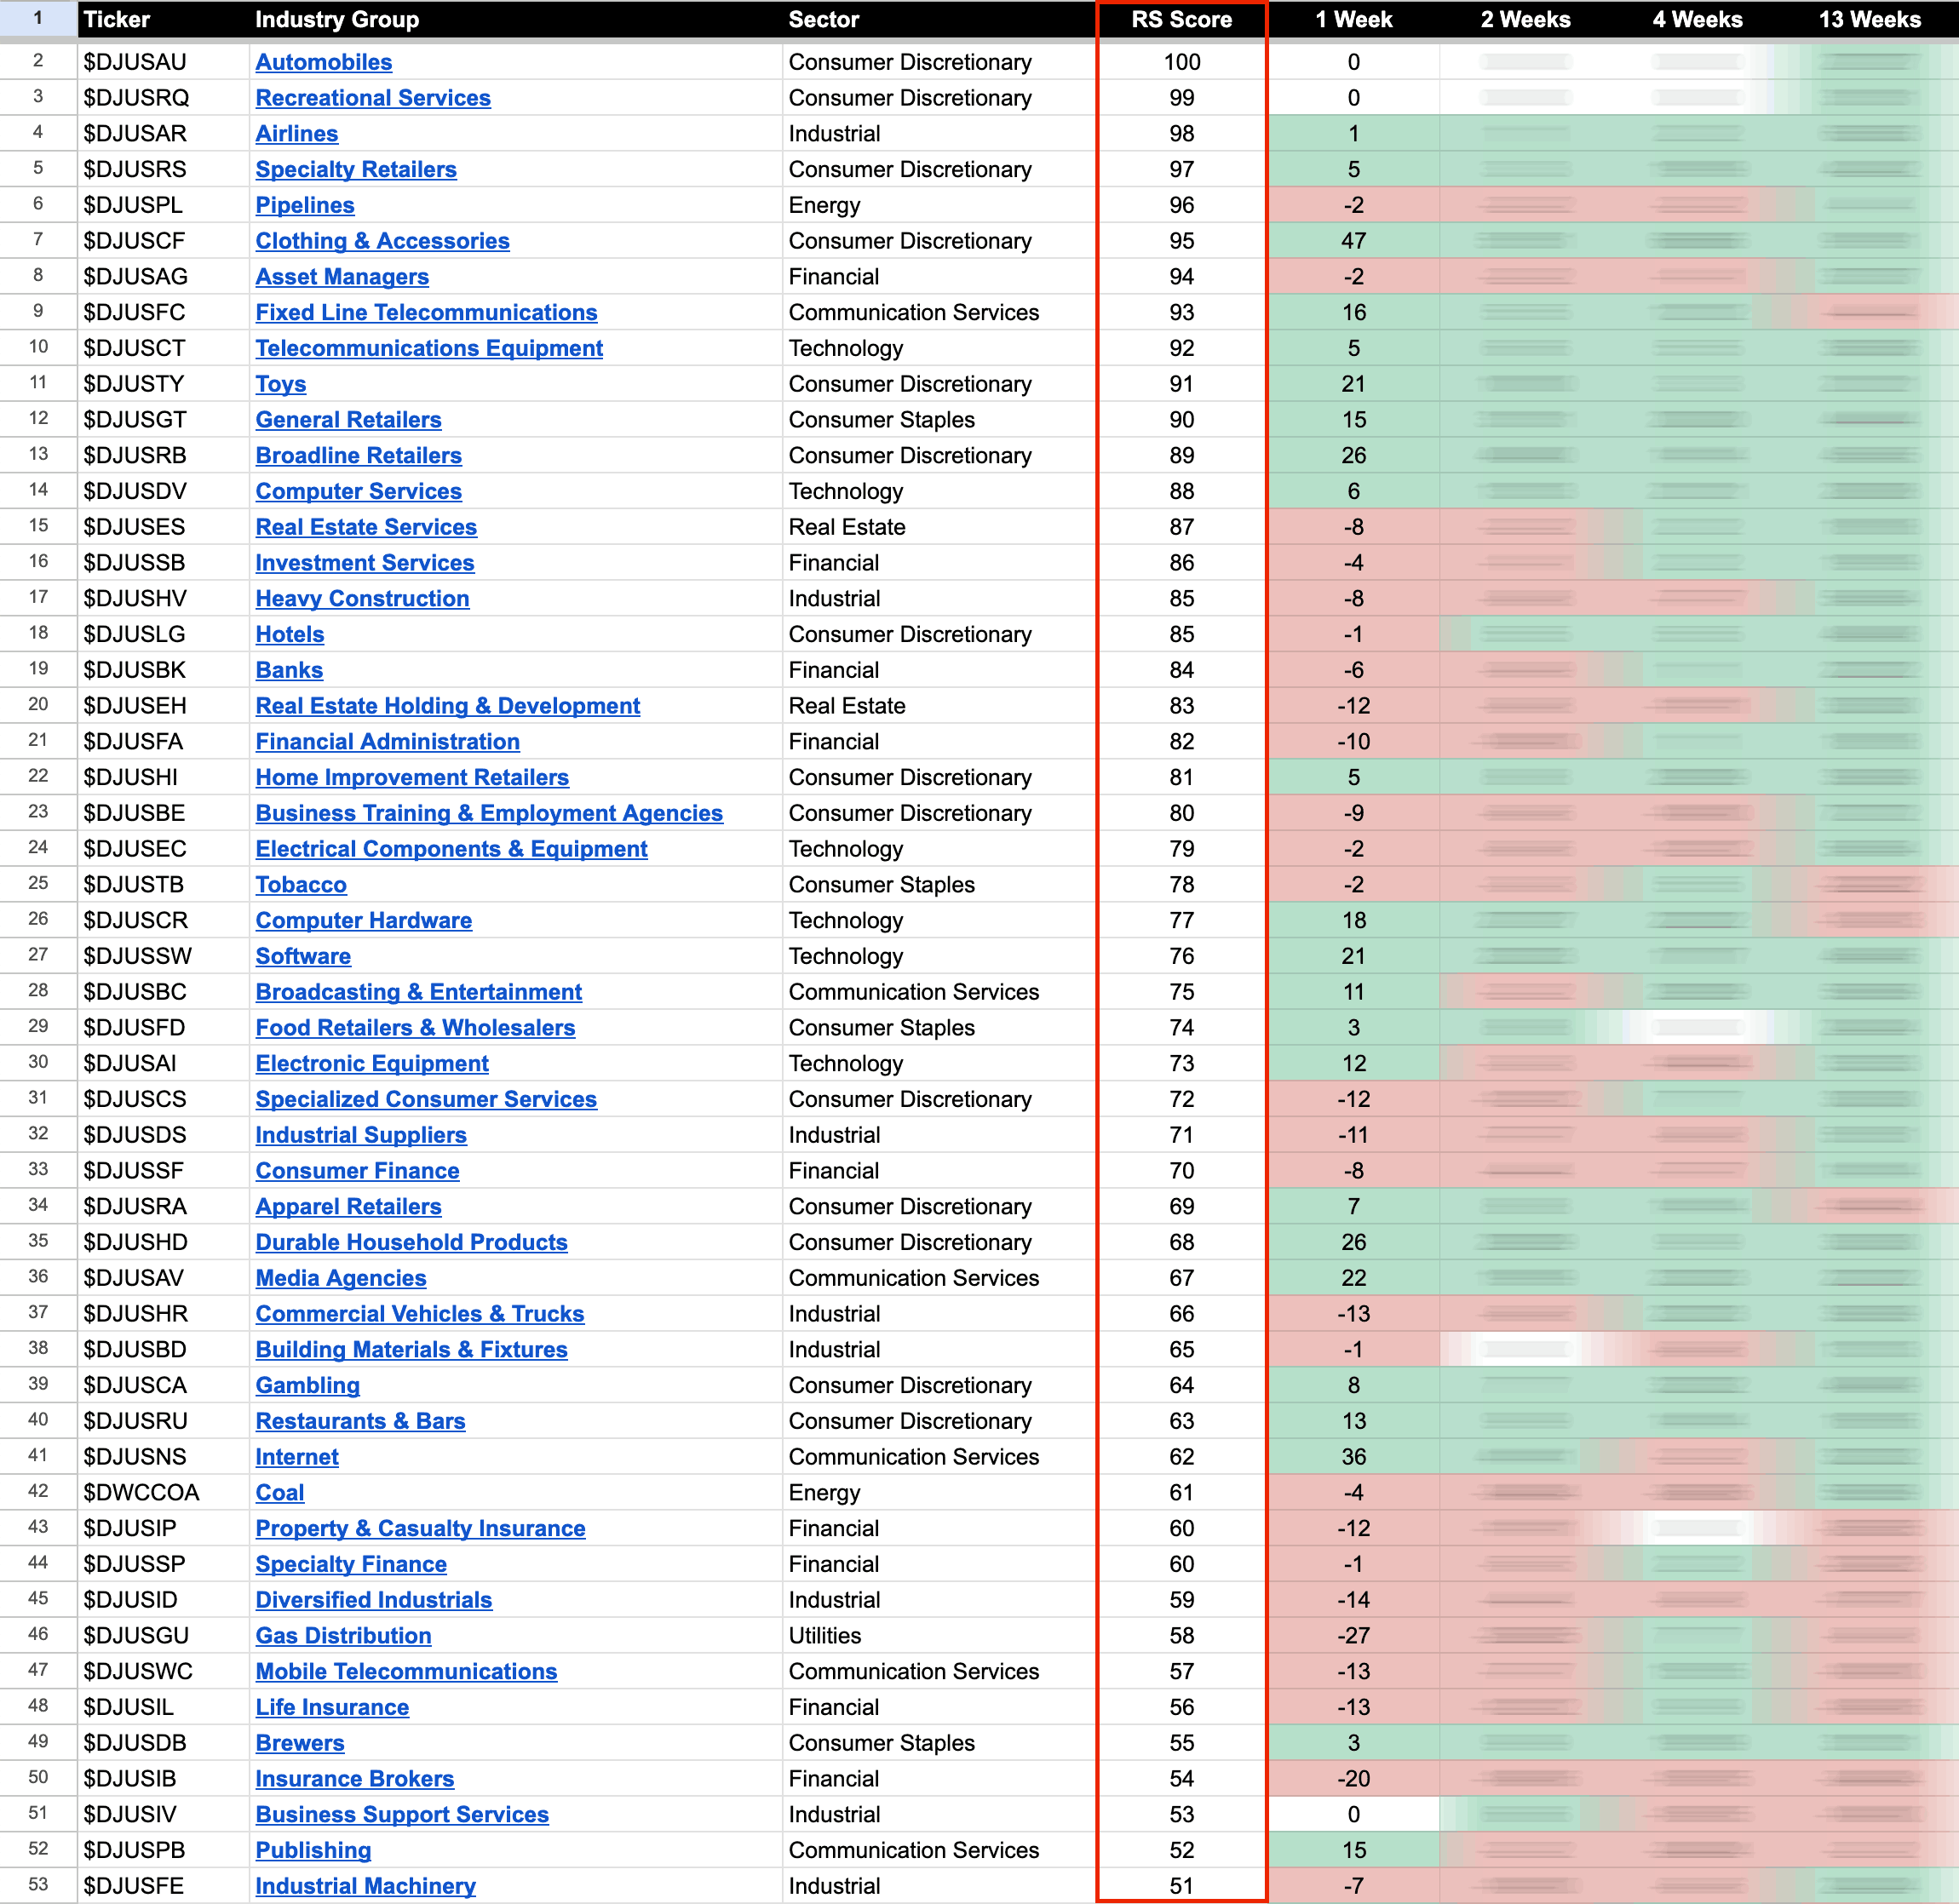
US Stocks Industry Groups Relative Strength Rankings
08 December, 2024
Stage Analysis Members Video – 8 December 2024 (1hr 3mins)
Stage Analysis members video discussing the US Watchlist Stocks in detail on multiple timeframes, the Sector breadth and Sub-industries Bell Curves, the key Market Breadth Charts to determine the Weight of Evidence, the Significant Bars, Bitcoin & Ethereum and the Major US Stock Market Indexes Update.
Read More
07 December, 2024
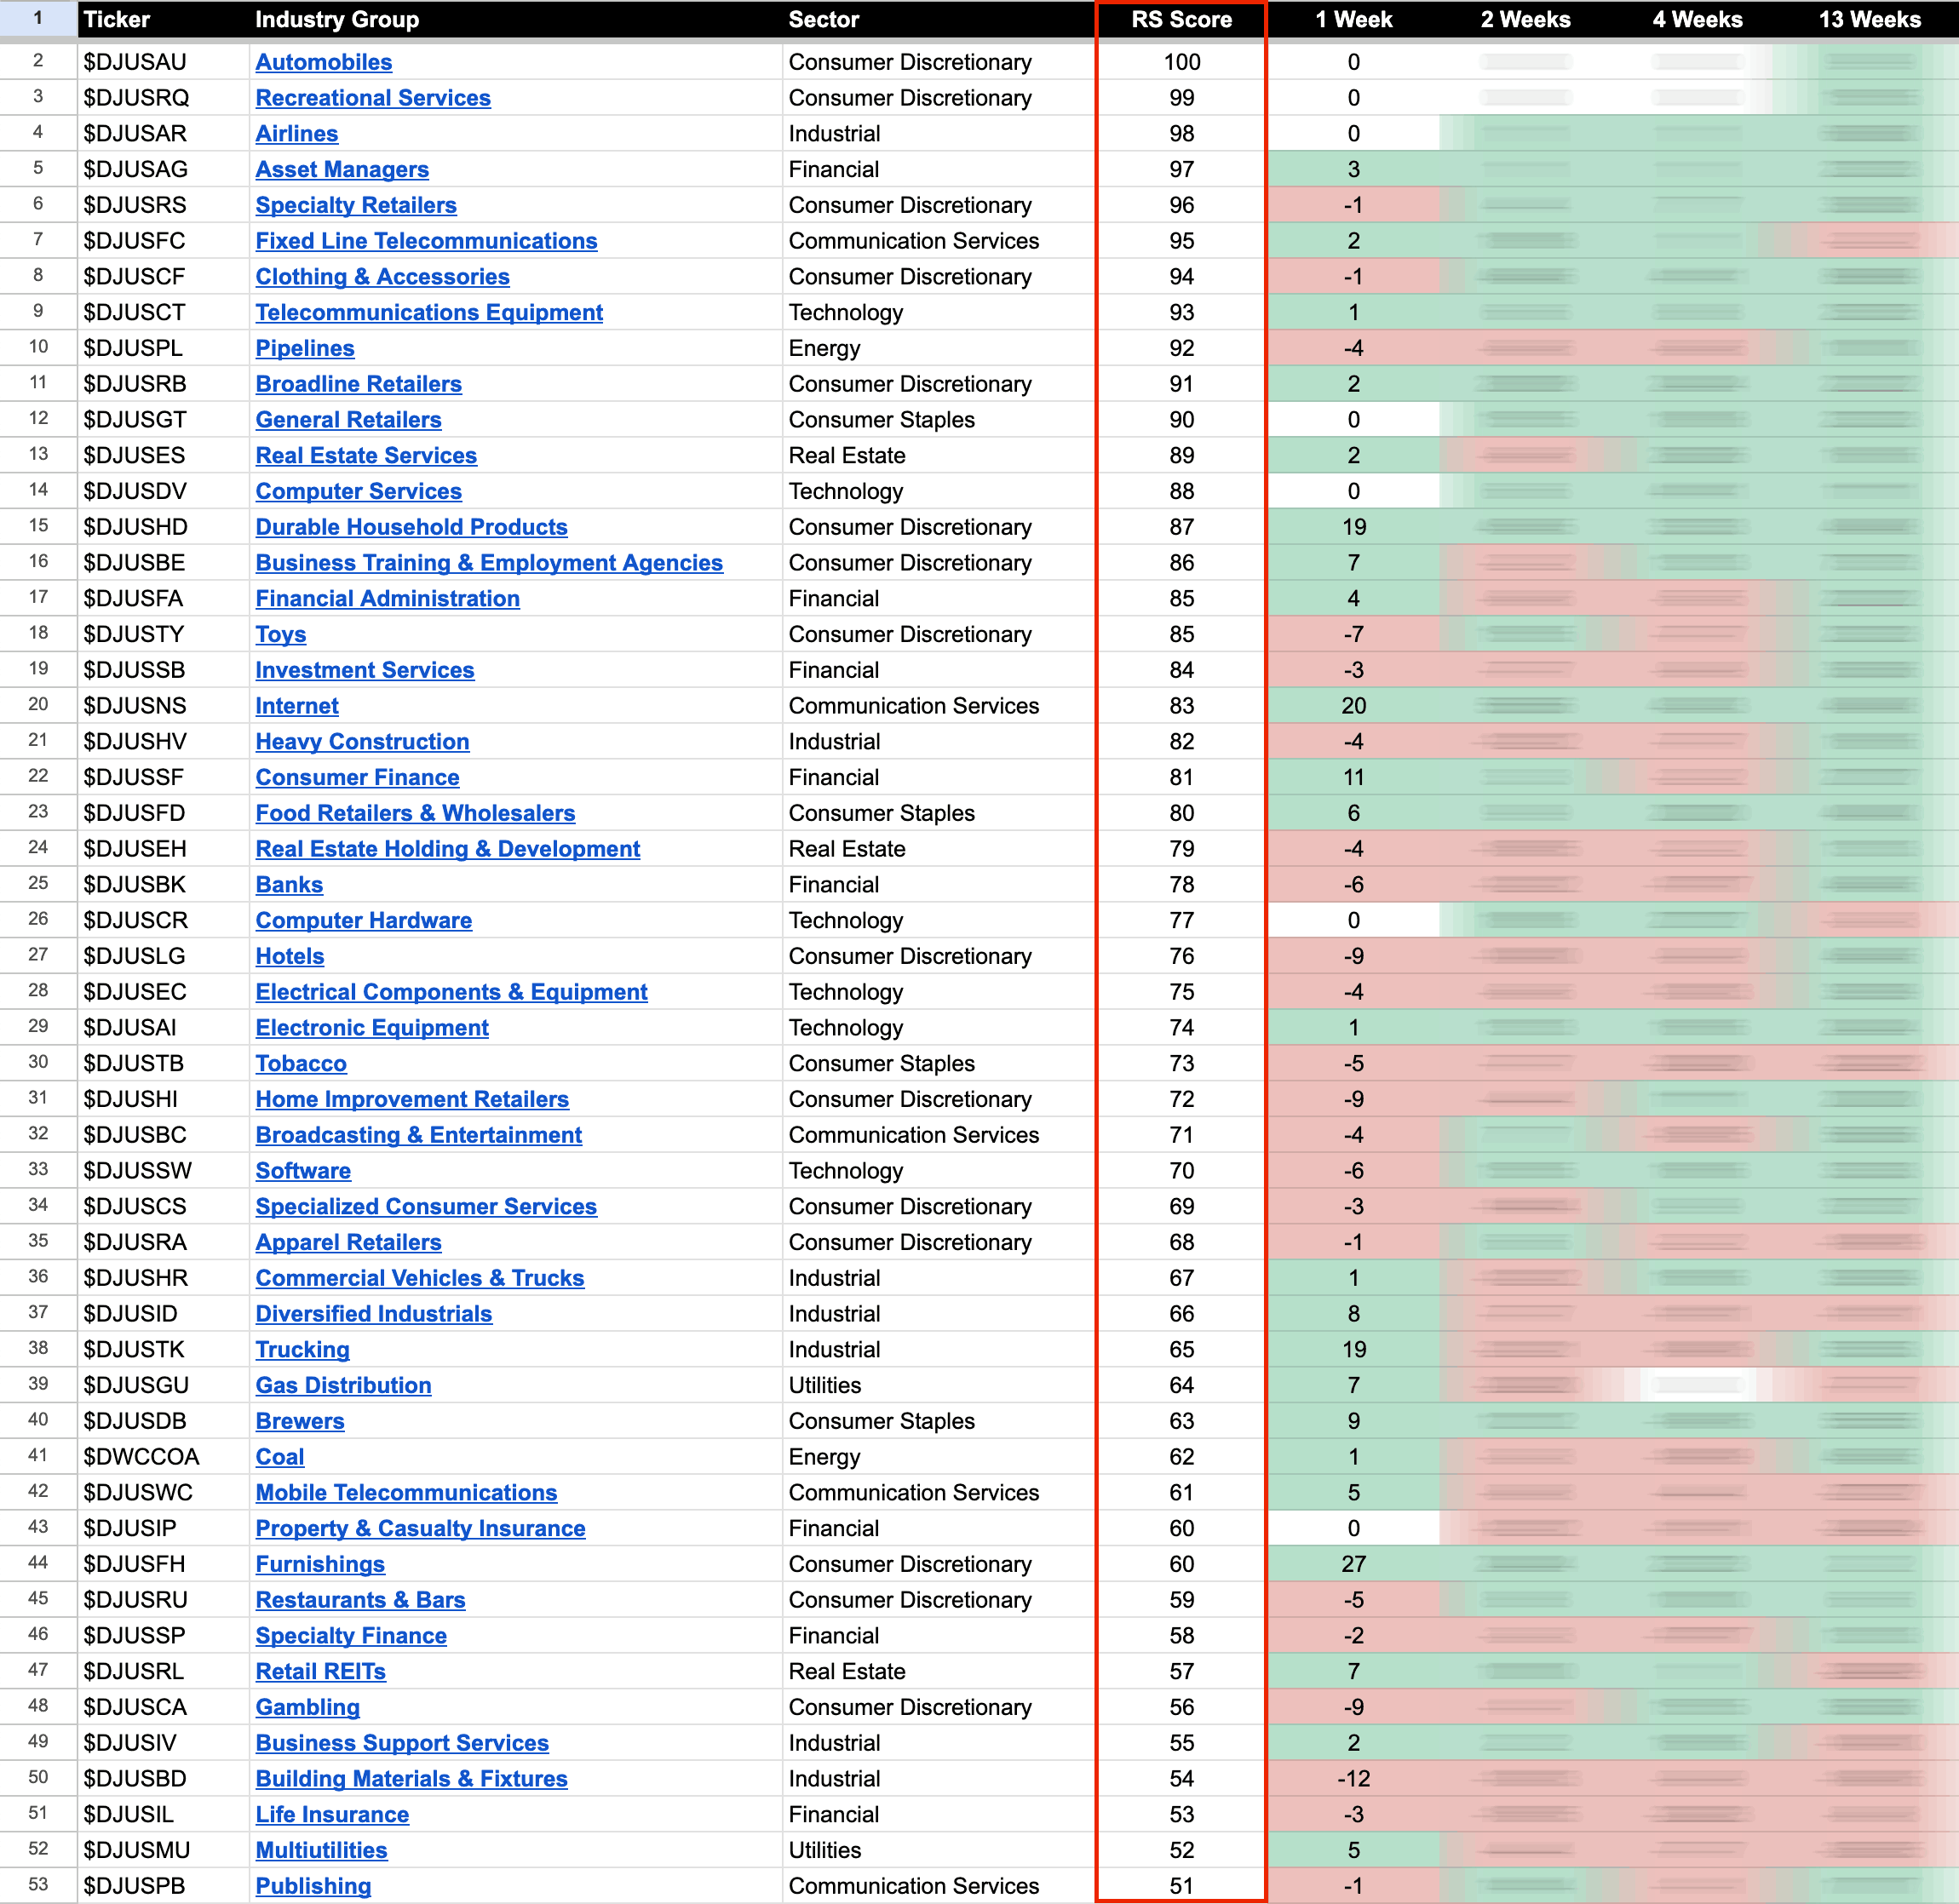
US Stocks Industry Groups Relative Strength Rankings
The purpose of the Relative Strength (RS) tables is to track the short, medium and long term RS changes of the individual groups to find the new leadership earlier than the crowd...
Read More
01 December, 2024
Stage Analysis Members Video – 1 December 2024 (49mins)
Stage Analysis members video discussing the US Watchlist Stocks in detail on multiple timeframes, the Sector breadth and Sub-industries Bell Curves, the key Market Breadth Charts to determine the Weight of Evidence, the Significant Bars and the Major US Stock Market Indexes Update.
Read More
30 November, 2024
US Stocks Industry Groups Relative Strength Rankings
The purpose of the Relative Strength (RS) tables is to track the short, medium and long term RS changes of the individual groups to find the new leadership earlier than the crowd...
Read More
24 November, 2024
Stage Analysis Members Video – 24 November 2024 (58mins)
Stage Analysis members video beginning with a discussion of the weeks Significant Bars, the US Watchlist Stocks in detail on multiple timeframes, the Sector breadth and Sub-industries Bell Curves, the key Market Breadth Charts to determine the Weight of Evidence, the major Crypto Coins and the Major US Stock Market Indexes Update.
Read More
23 November, 2024
US Stocks Industry Groups Relative Strength Rankings
The purpose of the Relative Strength (RS) tables is to track the short, medium and long term RS changes of the individual groups to find the new leadership earlier than the crowd...
Read More
17 November, 2024
Stage Analysis Members Video – 17 November 2024 (1hr 1min)
Stage Analysis members video discussing the weeks Significant Bars, the US Watchlist Stocks in detail on multiple timeframes, the Sector breadth and Sub-industries Bell Curves, the key Market Breadth Charts to determine the Weight of Evidence, and the Major US Stock Market Indexes Update.
Read More
16 November, 2024
US Stocks Industry Groups Relative Strength Rankings
The purpose of the Relative Strength (RS) tables is to track the short, medium and long term RS changes of the individual groups to find the new leadership earlier than the crowd...
Read More
10 November, 2024
Stage Analysis Members Video – 10 November 2024 (1hr 12mins)
Stage Analysis members video discussing the large amount of Significant Bars this week, plus the US Watchlist Stocks in detail on multiple timeframes, the Sector breadth and Sub-industries Bell Curves, the key Market Breadth Charts to determine the Weight of Evidence, Bitcoin and Ethereum both Stage 2 again, and the Major US Stock Market Indexes Update.
Read More