Stage Analysis Members Video covering the Major Indexes (i.e. S&P 500, Nasdaq Composite, Russell 2000 and the VIX etc), Market Breadth charts to determine the Weight of Evidence, Industry Group Relative Strength Tables and the Groups in focus this week. Plus the US Stocks Watchlist.
Read More

Blog
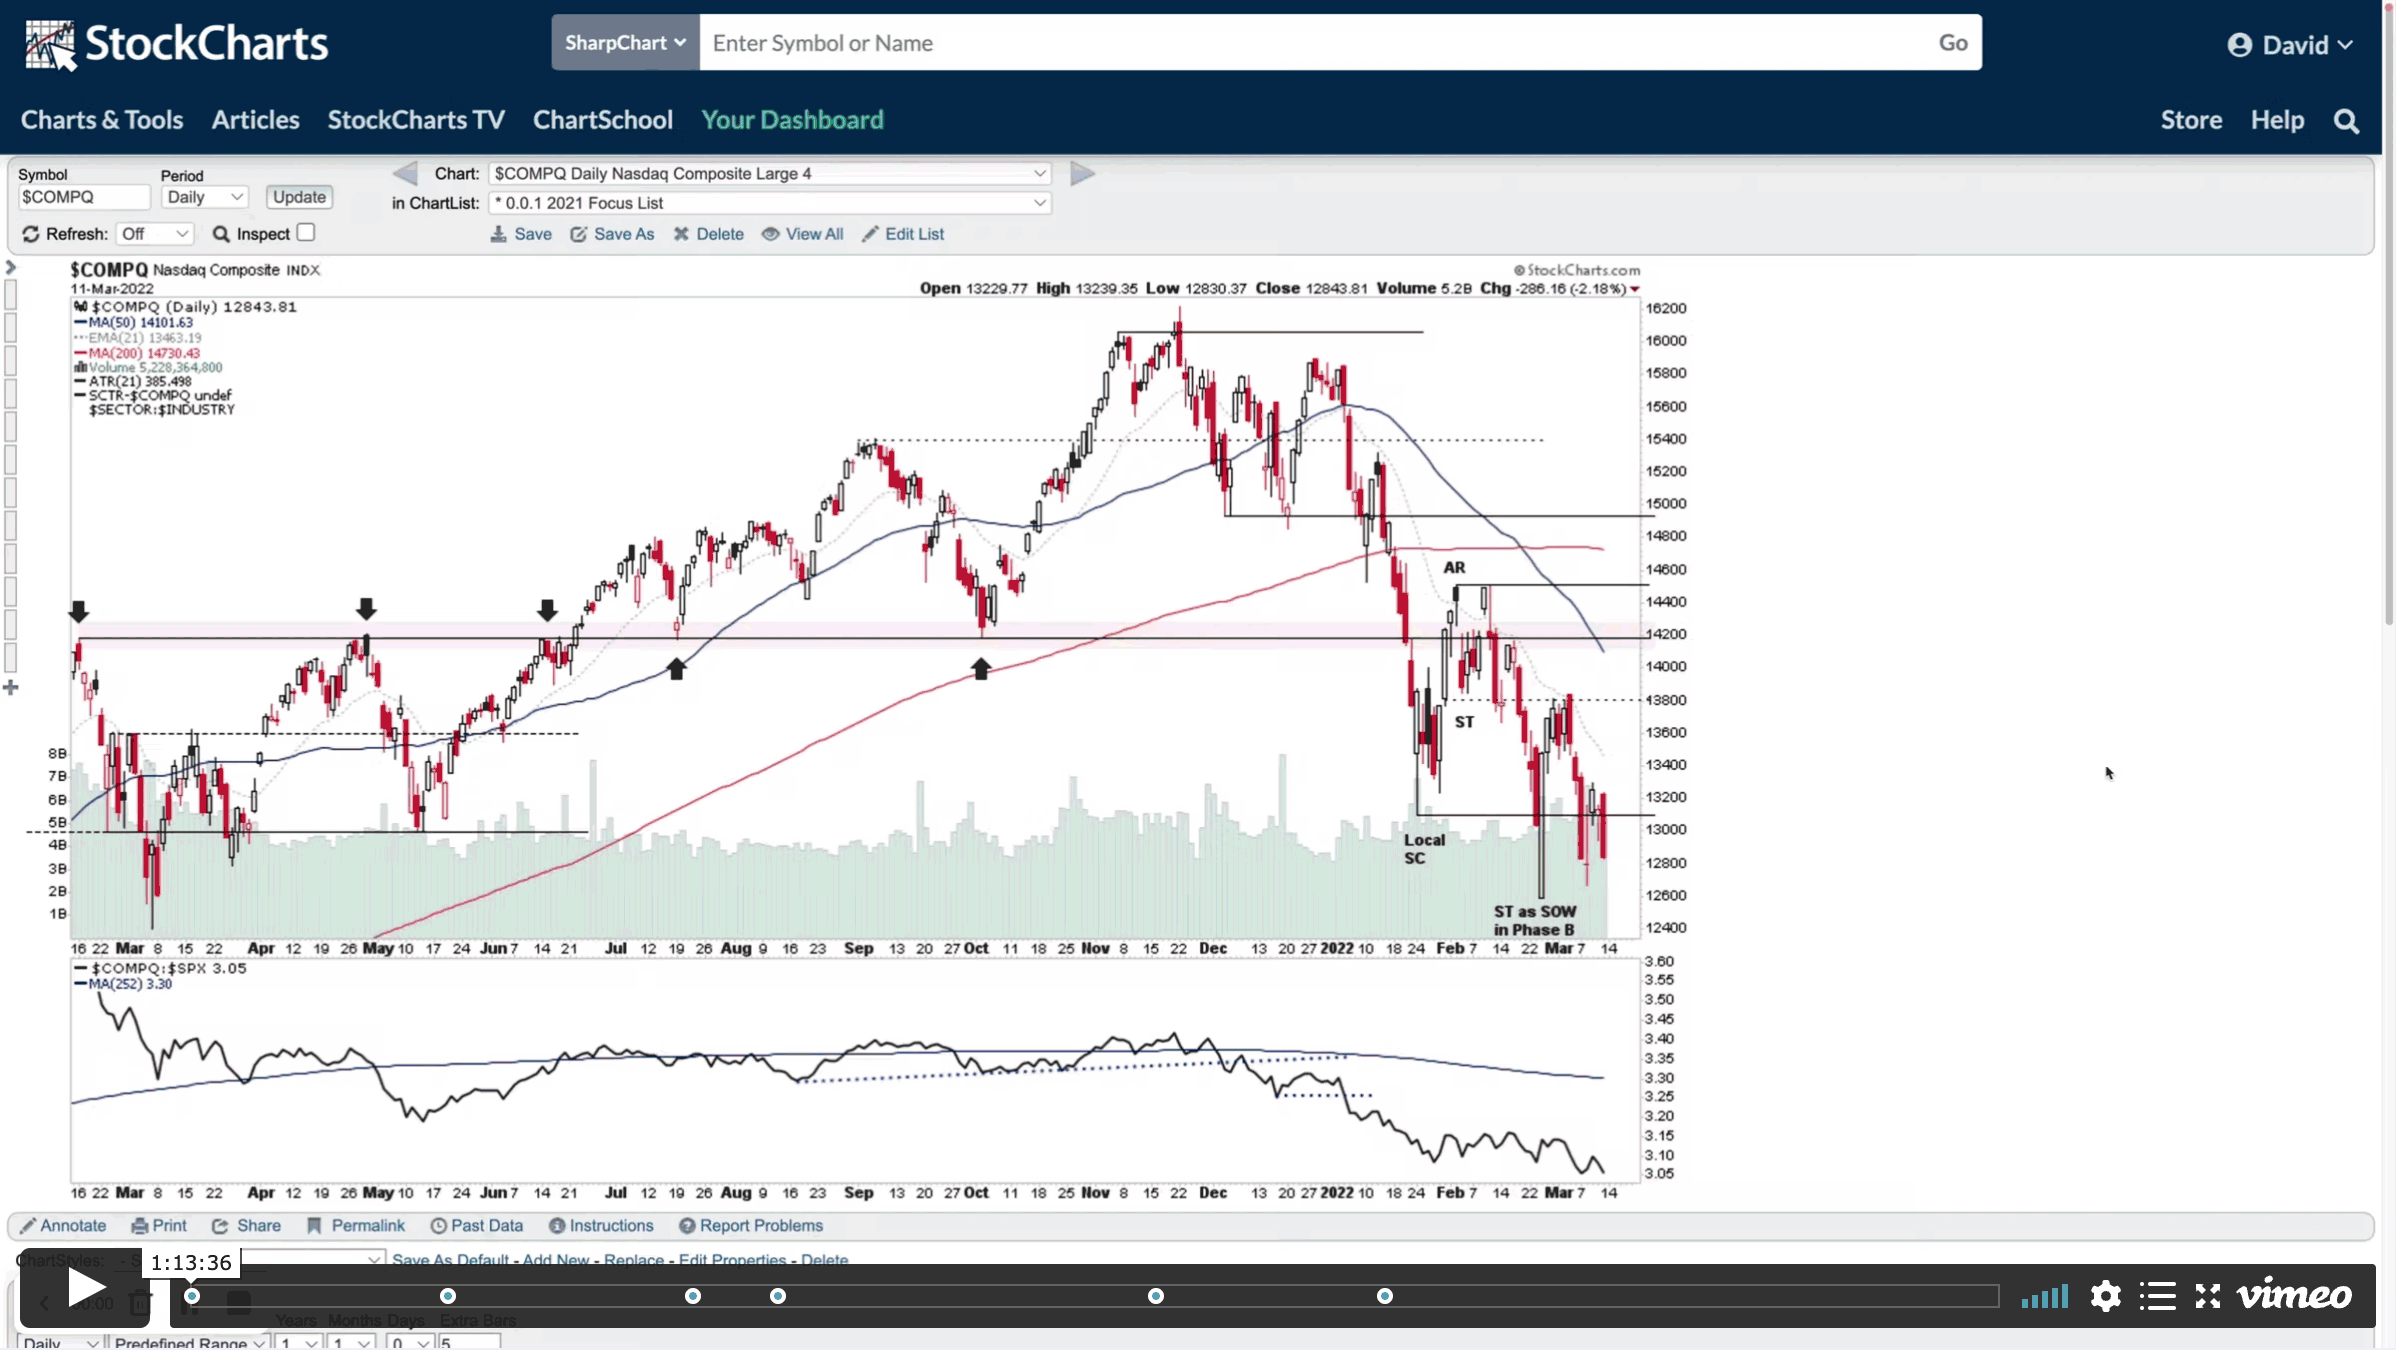
13 March, 2022
Stage Analysis Members Weekend Video - 13 March 2022
Weekend Stage Analysis Members Video covering the Major Indexes, Commodities, ETFs in focus, the Sectors and Industry Group Relative Strength, Market Breadth Update and finally the US Stocks Watchlist in detail where I mark up the price and volume action that I'm looking for in and the developing themes from the watchlist.
Read More
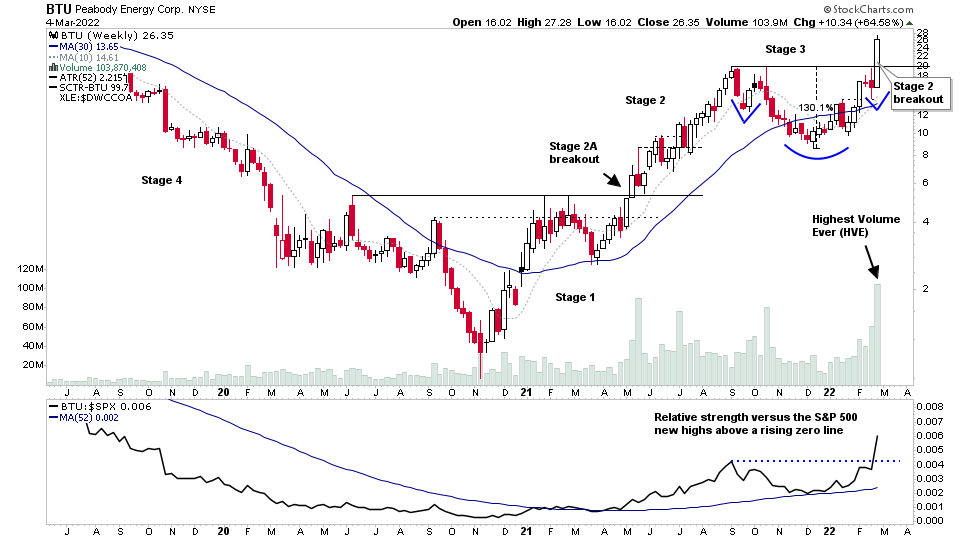
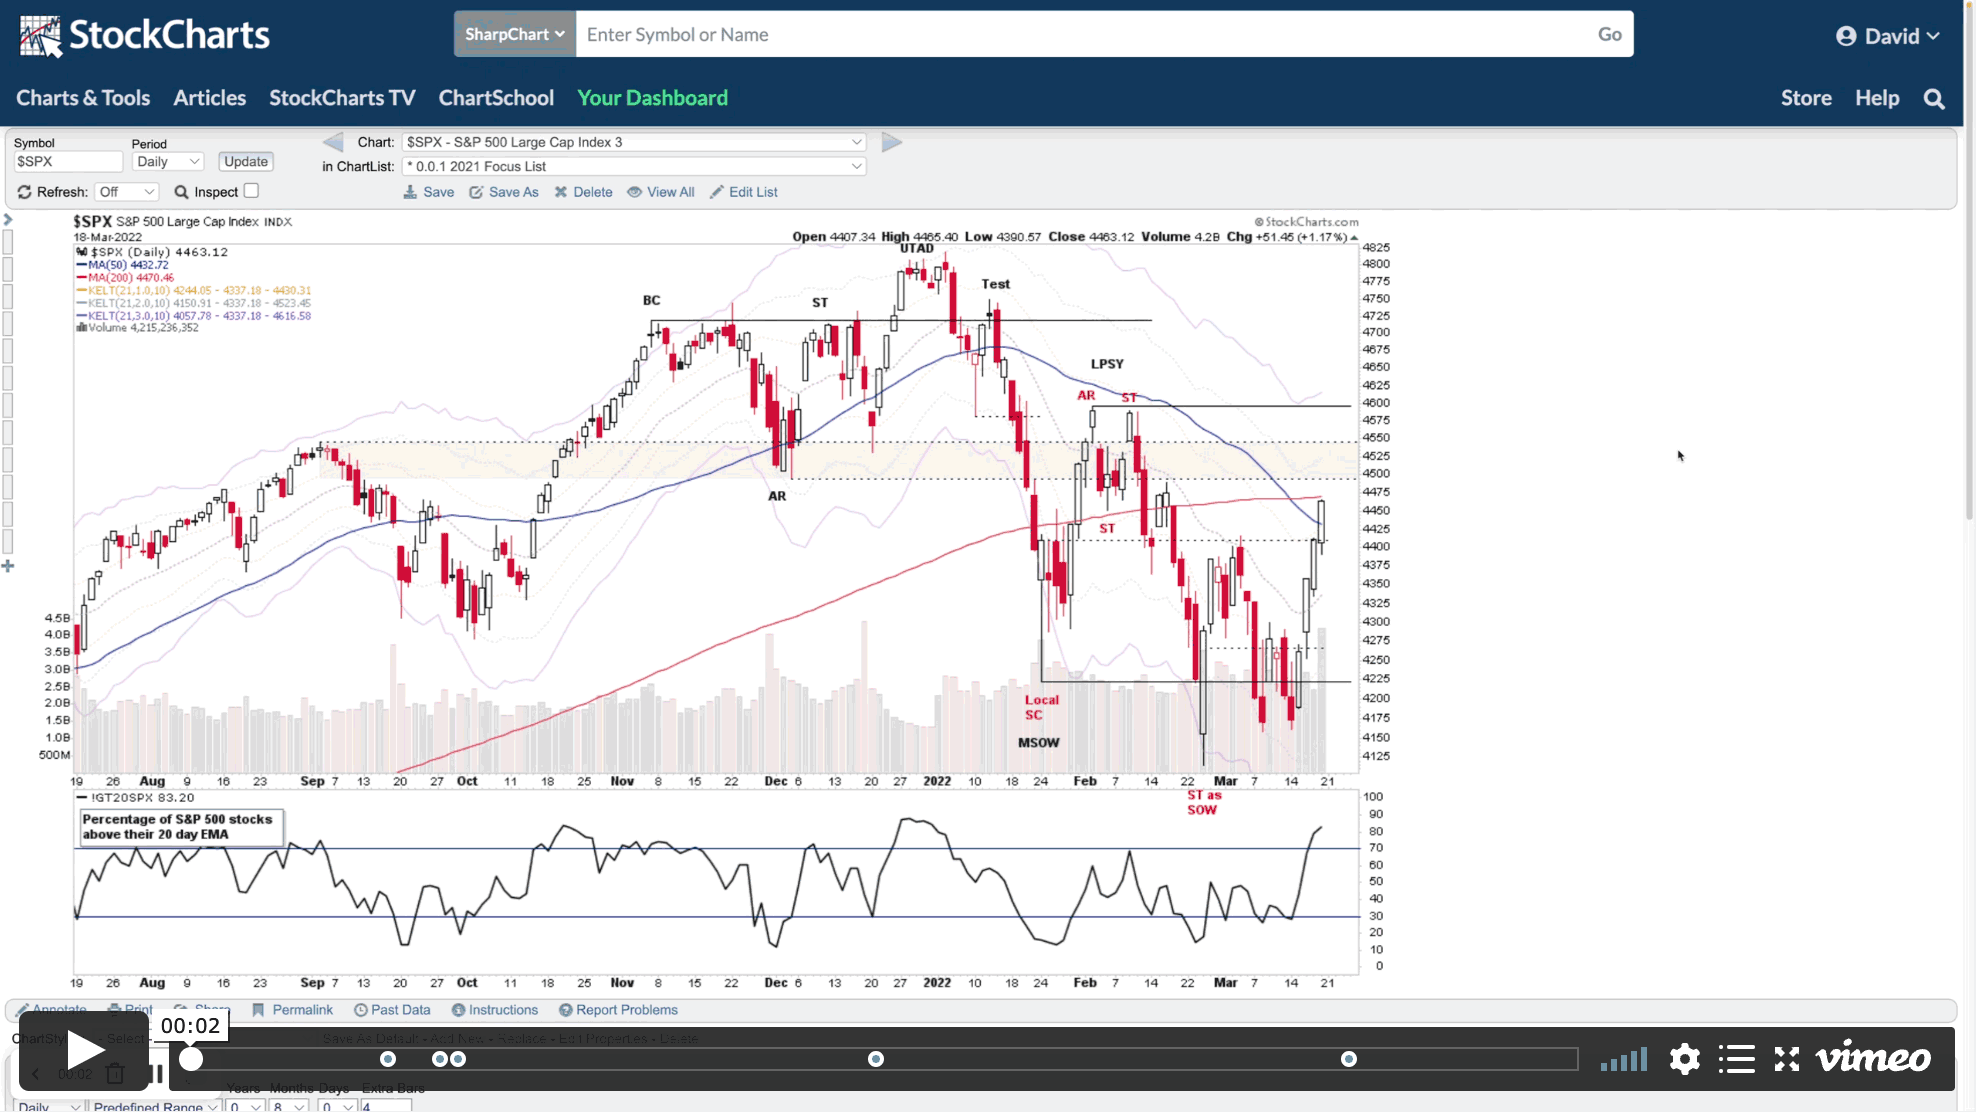
06 March, 2022
Stage Analysis Members Weekend Video - Part 1 - 6 March 2022
Stage Analysis Members Video covering - BTU Stage 2 Breakout Analysis and Targets. Group Focus on Coal, Defense, Cybersecurity. Major Indexes review: i.e. S&P 500, Nasdaq, Russell 2000 and more Market Breadth Update to Determine the Current Weight of Evidence
Read More
27 February, 2022
Stage Analysis Members Weekend Video - 27 February 2022 (1hr 16mins)
Weekend update covering the major indexes, market breadth, industry group relative strength tables and the weekend US stocks watchlist...
Read More
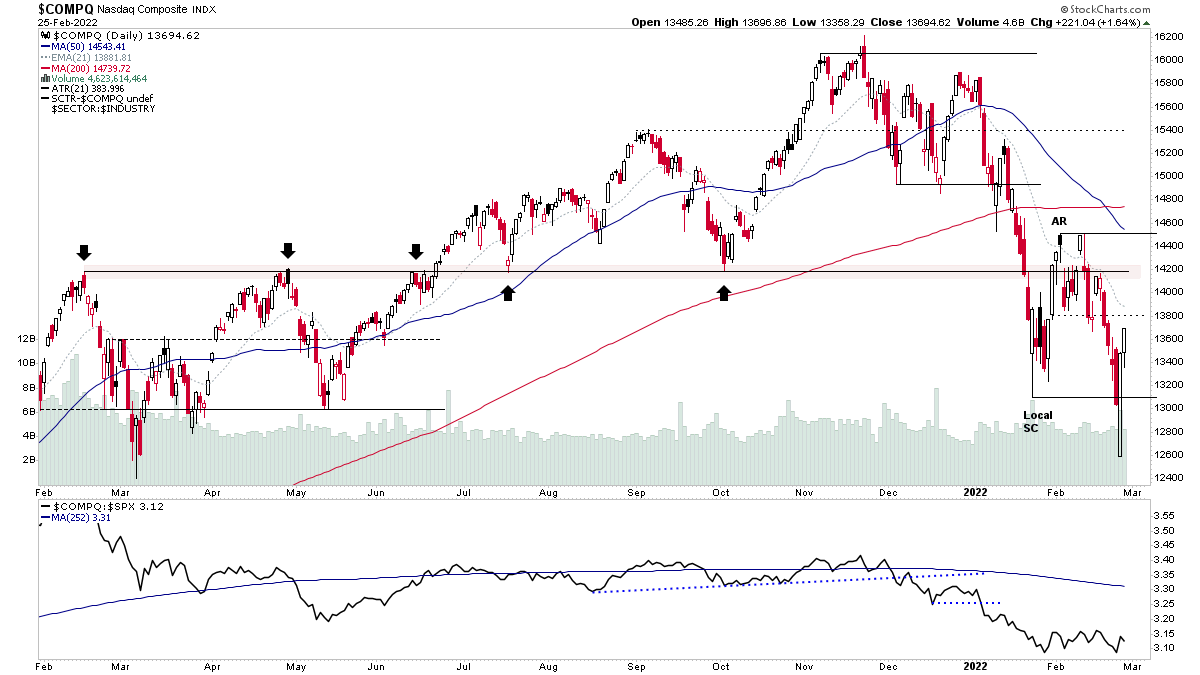
27 February, 2022
Market Breadth Update - 27 February 2022
Overview the key market breadth charts that we follow in order to determine the Weight of Evidence, which guides our strategy and risk management.
Read More
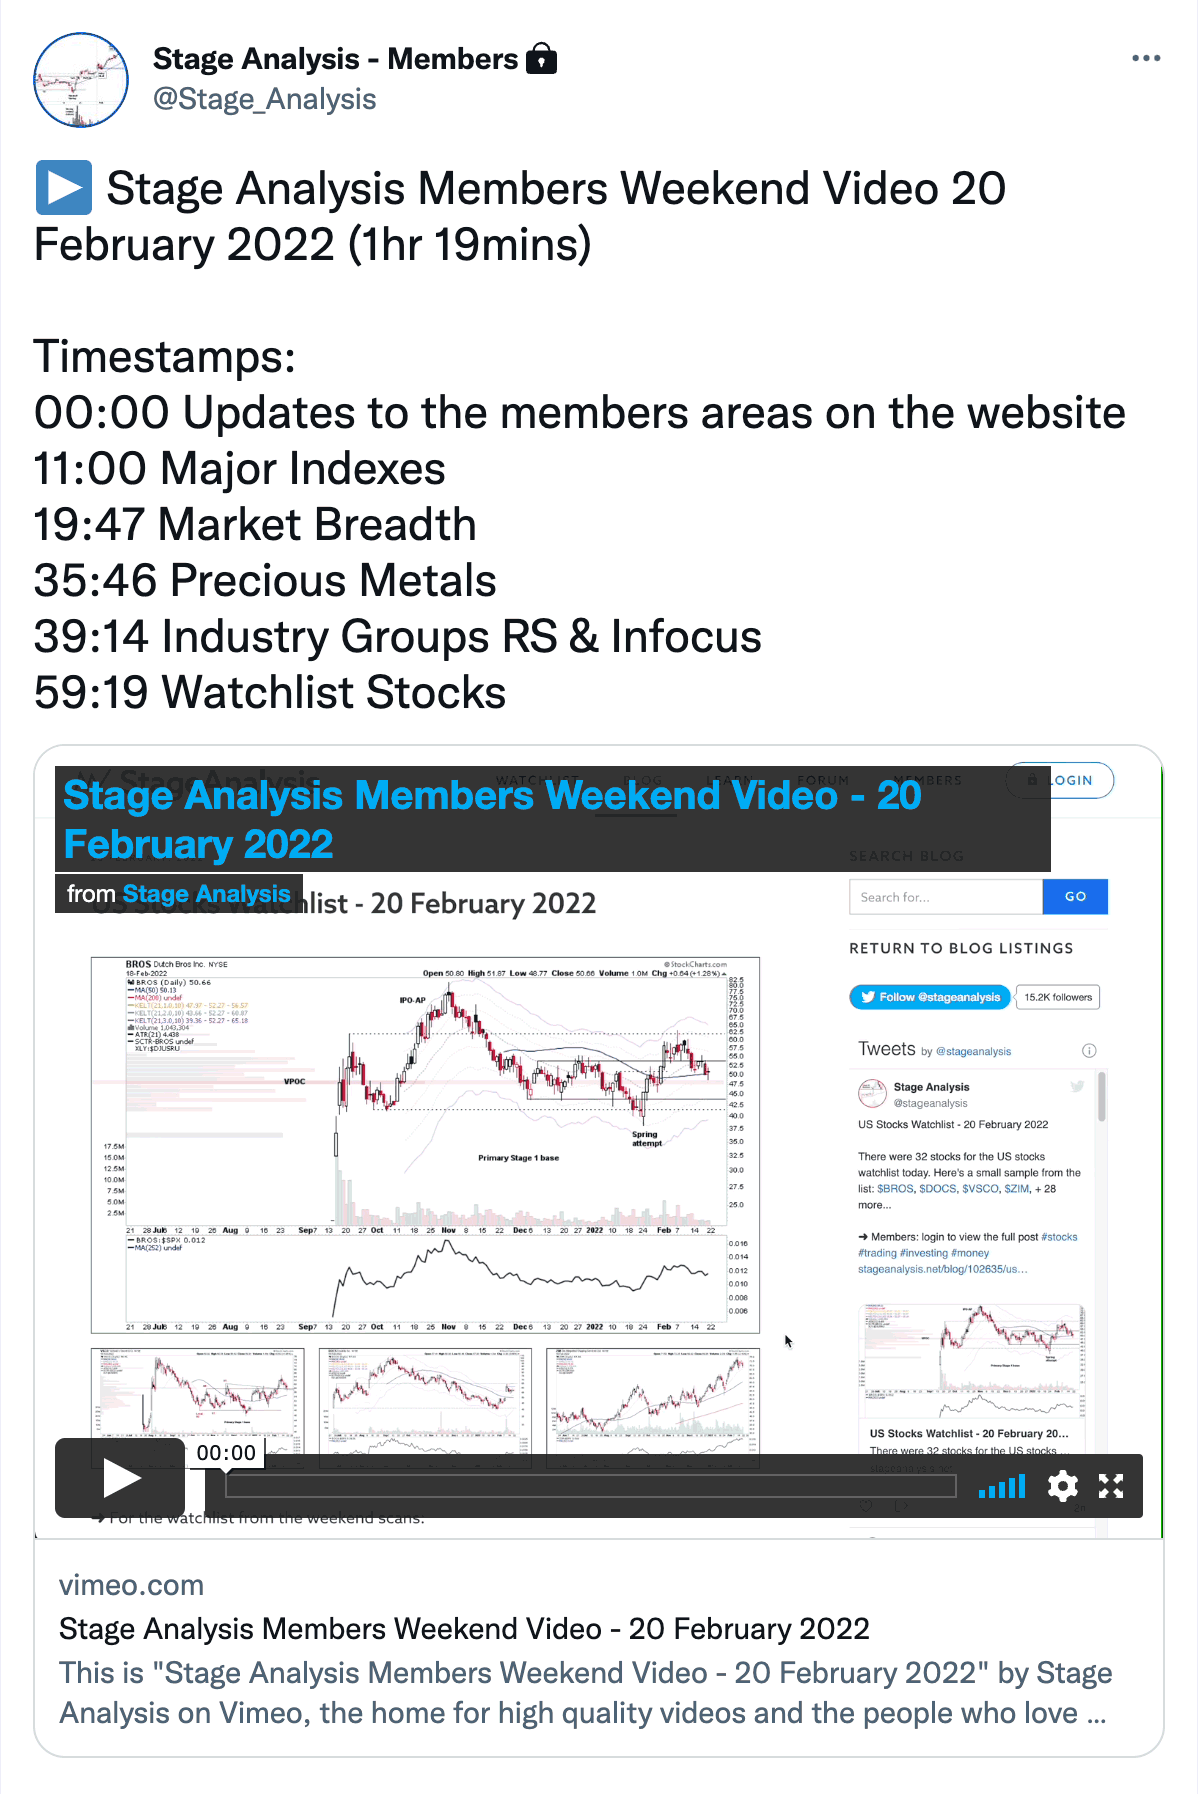
20 February, 2022
Stage Analysis Members Weekend Video - 20 February 2022 (1hr 19mins)
Detailed video of the US stock market indexes, market breadth, industry groups relative strength tables and the stocks from the weekend watchlist.
Read More
13 February, 2022
Stage Analysis Members Weekend Videos and the US Stocks Watchlist - 13 February 2022
This weekends watchlist is dominated by a few group themes with around third of the stocks from the precious metals groups as spot gold is approaching its Stage 2 breakout level once more...
Read More
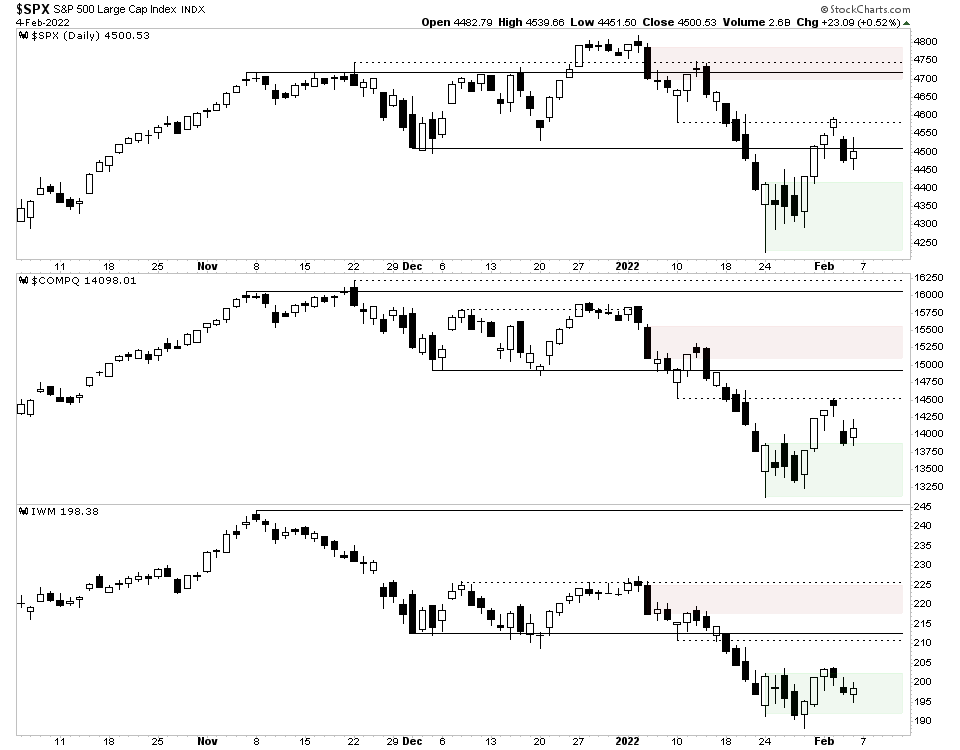
06 February, 2022
US Stockmarket Weekend Update - 6 February 2022
The major indexes had a reasonably strong week with outperformance in the S&P 500 once more, while the Nasdaq Composite and Russell 2000 lagged. But most ended with squat candles. So there was some signs of weakness in the final hour on Fridays session.
Read More
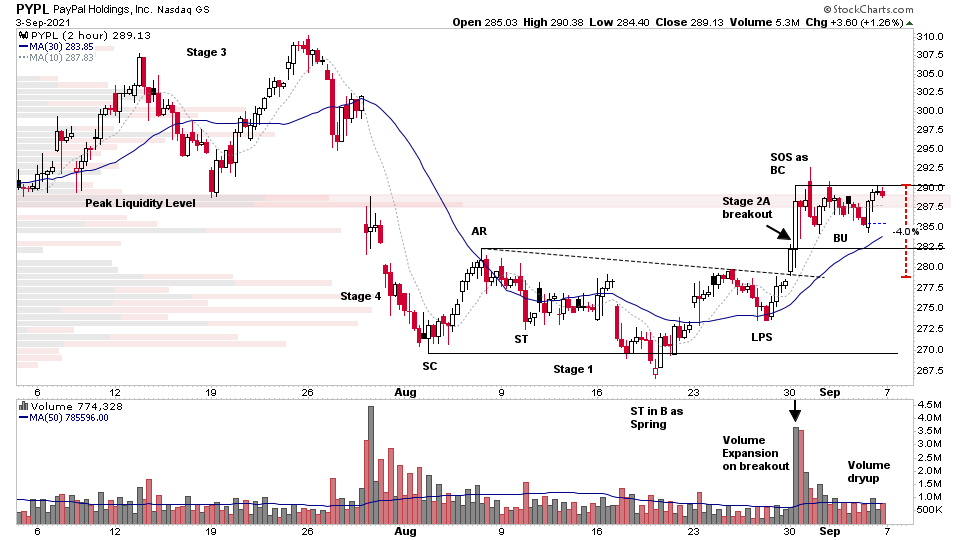
05 September, 2021
Stage Analysis - Members Weekend Video - 5th September 2021
Introduction to Stage Analysis - Members service, Stock Market Overview, Major Indexes & Sectors, Industry Group Relative Strength, Market Breadth Charts (Percentage of stocks above their key MAs, Bullish Percent Indexes, Advance Decline Lines, New High New Lows, Cumulative P&F Breakouts - Breakdowns, Stage Analysis Technical Attributes (SATA) scoring system and the US Watchlist Stocks in focus - ASAN, MDB, DOCU, CRWD, PYPL and many more...
Read More
29 November, 2020
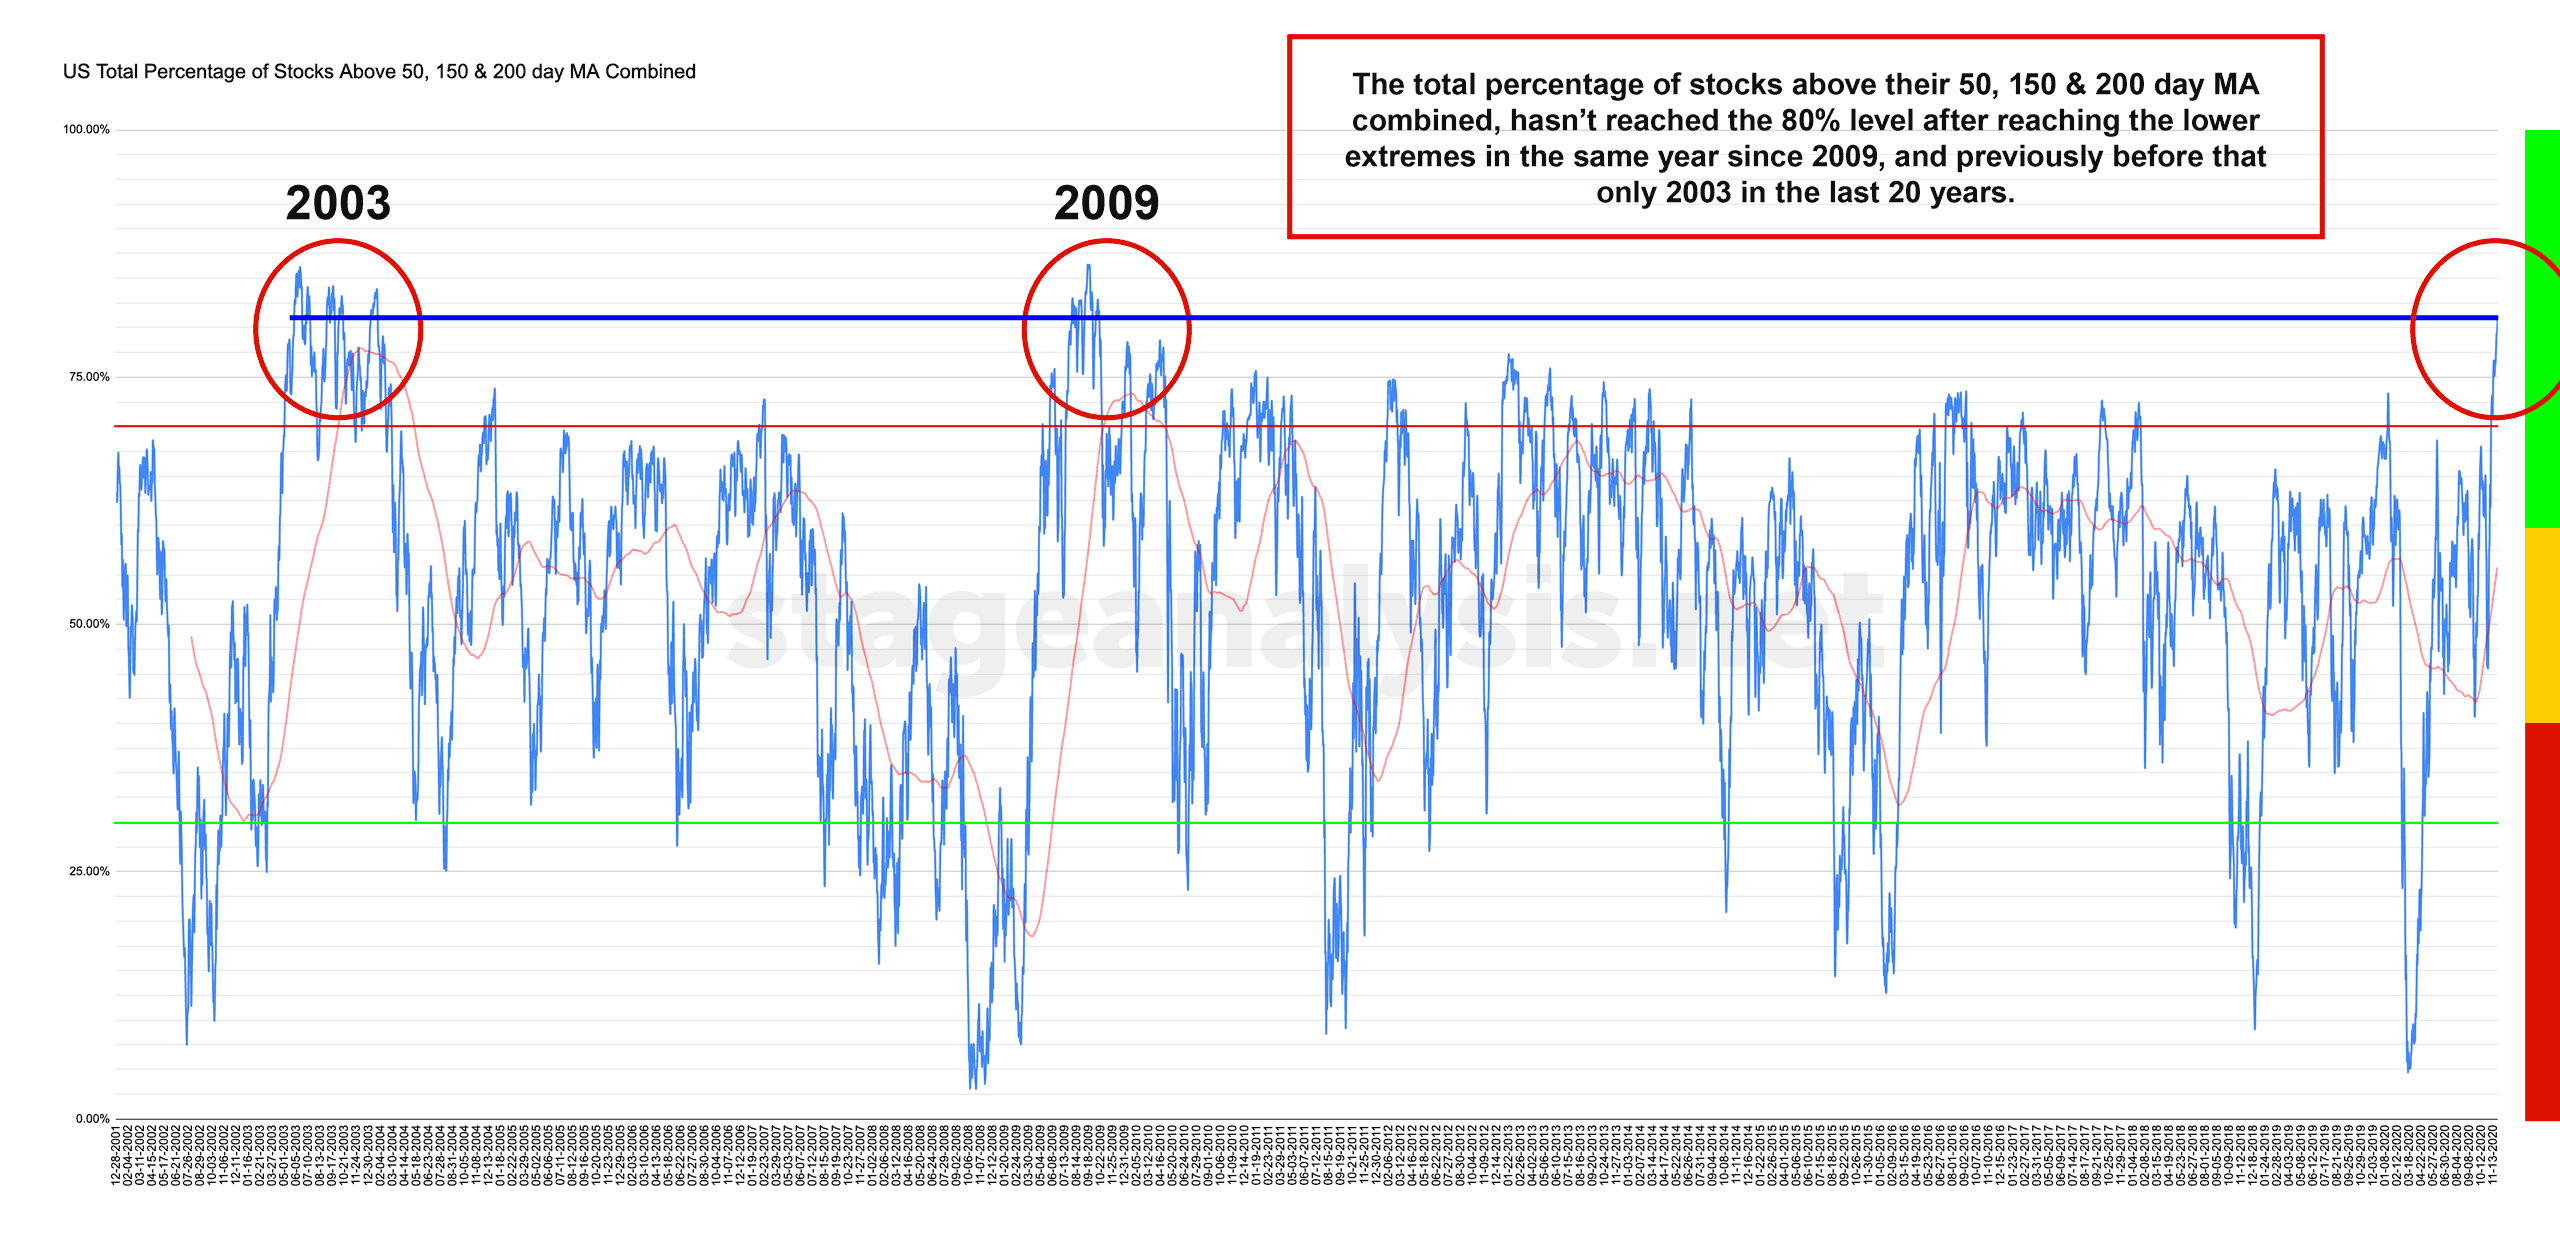
US Stock Market Breadth Update - 29th November 2020
Potential Major Market Breadth signal that the Bull market is still only just beginning. The 80%+ level has only been reached twice before in June 2003 & August 2009 as you can see attached. So although in the upper risk range. A major sign of strength.
Read More