The Stage Analysis members weekend video with the major US Indexes, futures charts, US Industry Groups RS Rankings, the Market Breadth Update to help to determine the Weight of Evidence and discussion of some the recent breakouts and stocks in Stage 2.
Read More

Blog
05 March, 2023
Stage Analysis Members Video – 5 March 2023 (1hr 4mins)
26 February, 2023
Stage Analysis Members Video – 26 February 2023 (1hr 22mins)
The Stage Analysis members weekend video featuring early Stage 2 and developing Stage 1 stocks, watchlist stocks in focus with upcoming earnings in the coming week. Plus the regular content with the major US Indexes, the futures charts, US Industry Groups RS Rankings, IBD Industry Groups Bell Curve - Bullish Percent, the Market Breadth Update to help to determine the Weight of Evidence.
Read More
20 February, 2023
Stage Analysis Members Video – 20 February 2023 (1hr 34mins)
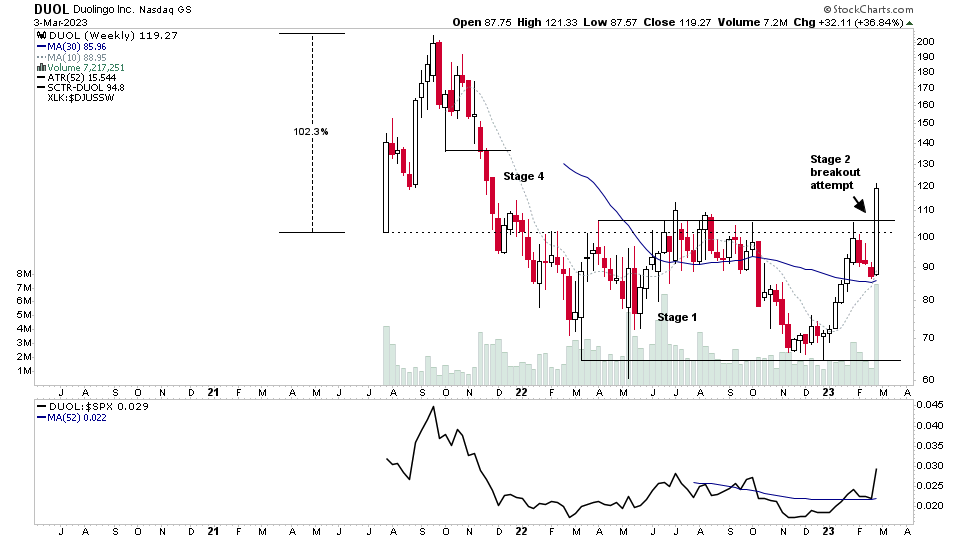
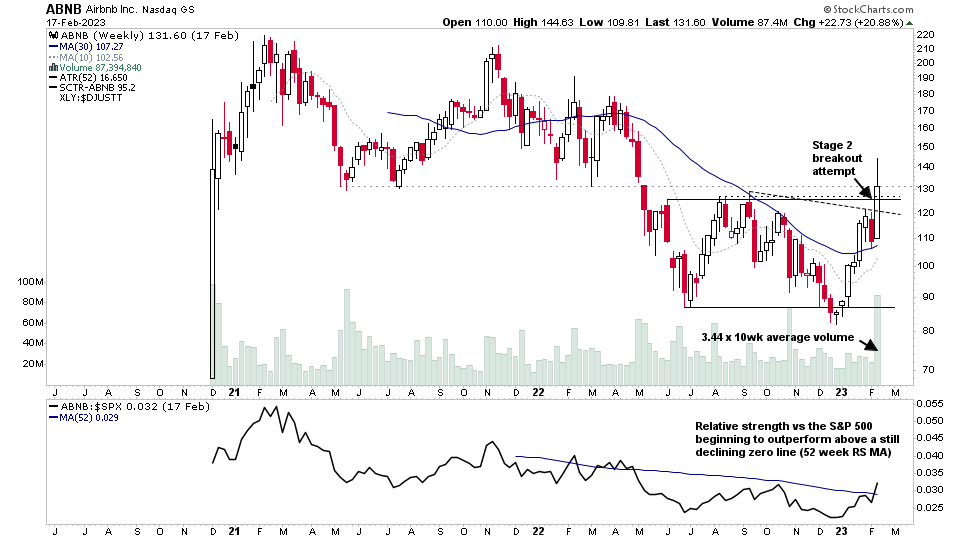
The Stage Analysis members weekend video featuring recent Stage 2 breakout attempts, the major US Indexes, the futures charts, US Industry Groups RS Rankings, IBD Industry Groups Bell Curve - Bullish Percent, the Market Breadth Update to help to determine the Weight of Evidence, the US Stocks Watchlist in detail on multiple timeframes and finishing with a look at the Stage Analysis of some of the major crypto coins, as a few attempt to move into early Stage 2 once more after huge Stage 4 declines in 2022.
Read More
12 February, 2023
Stage Analysis Members Video – 12 February 2023 (1hr)
The Stage Analysis members weekend video featuring the regular content with the major US Indexes, the futures charts, US Industry Groups RS Rankings, IBD Industry Groups Bell Curve - Bullish Percent, the Market Breadth Update to help to determine the Weight of Evidence and finishing with the US Stocks Watchlist in detail on multiple timeframes.
Read More
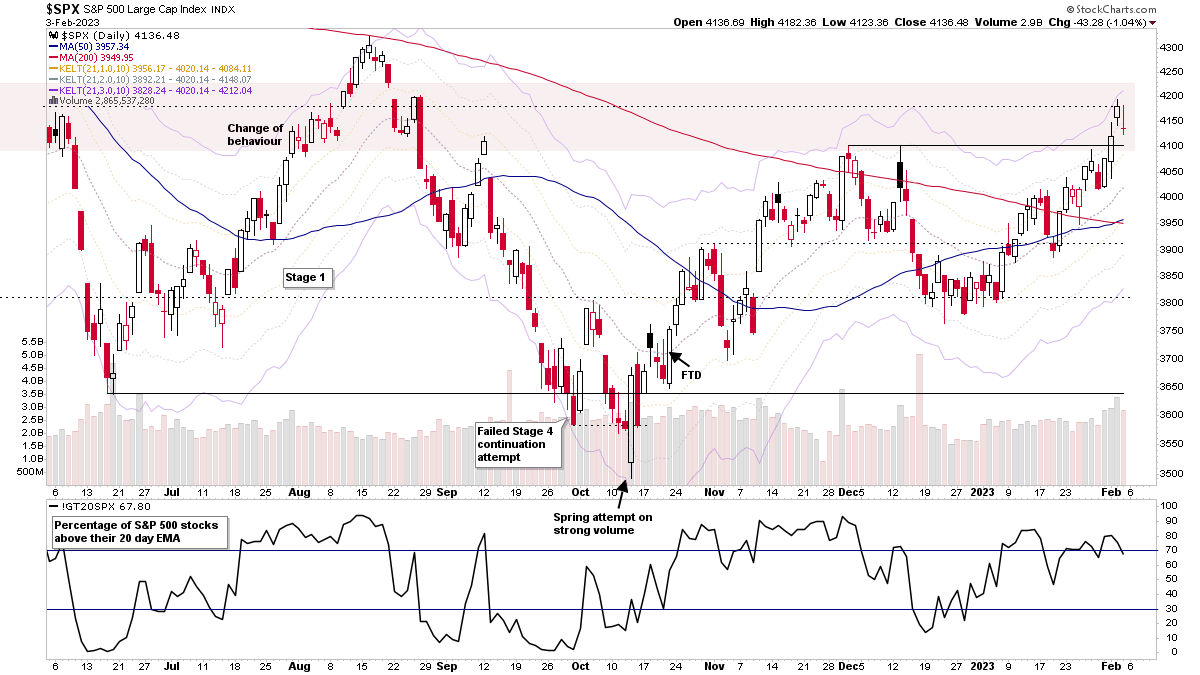
05 February, 2023
Stage Analysis Members Video – 5 February 2023 (1hr 31mins)
The Stage Analysis members weekend video featuring the regular content with the major US Indexes, the futures charts, US Industry Groups RS Rankings, IBD Industry Groups Bell Curve - Bullish Percent, the Market Breadth Update to help to determine the Weight of Evidence and finishing with the US Stocks Watchlist in detail on multiple timeframes.
Read More
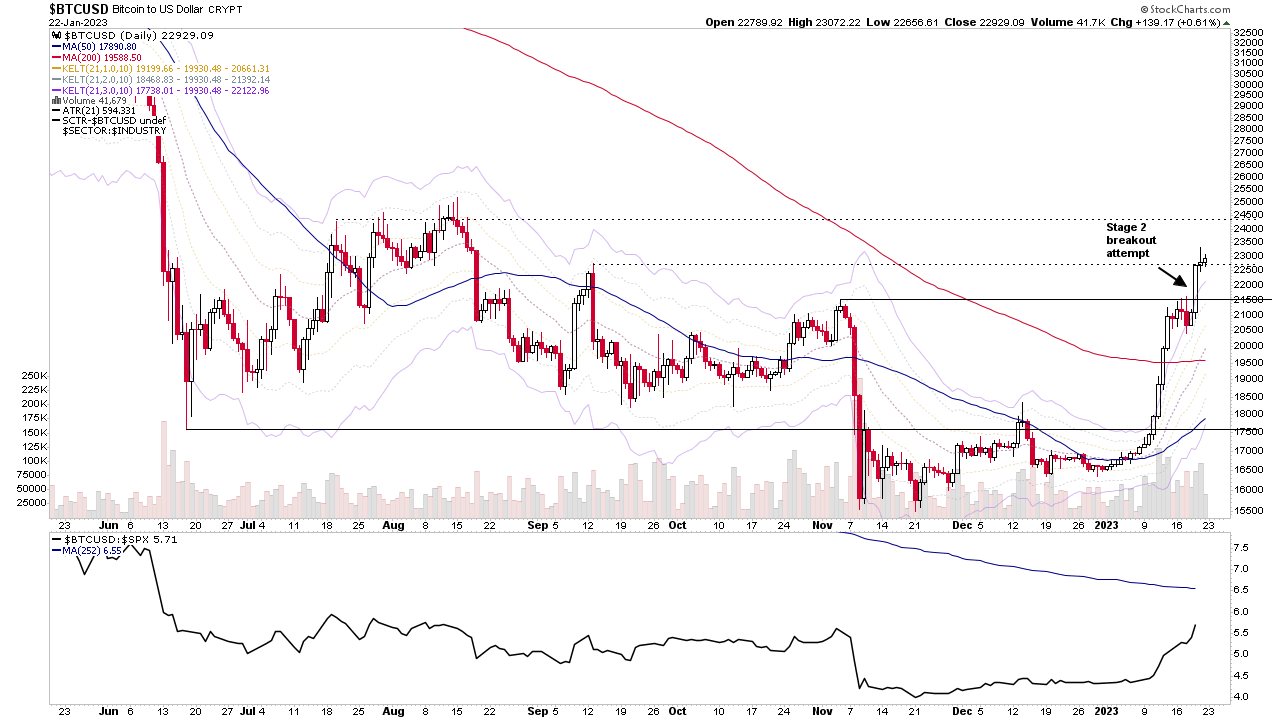
22 January, 2023
Stage Analysis Members Video – 22 January 2023 (1hr 12mins)
The Stage Analysis members weekend video featuring analysis of the early Stage breakout attempt in Bitcoin, and then the regular content with the major US Indexes, the futures charts, US Industry Groups RS Rankings, IBD Industry Groups Bell Curve - Bullish Percent, the Market Breadth Update to help to determine the Weight of Evidence and finishing with the US Stocks Watchlist in detail on multiple timeframes.
Read More
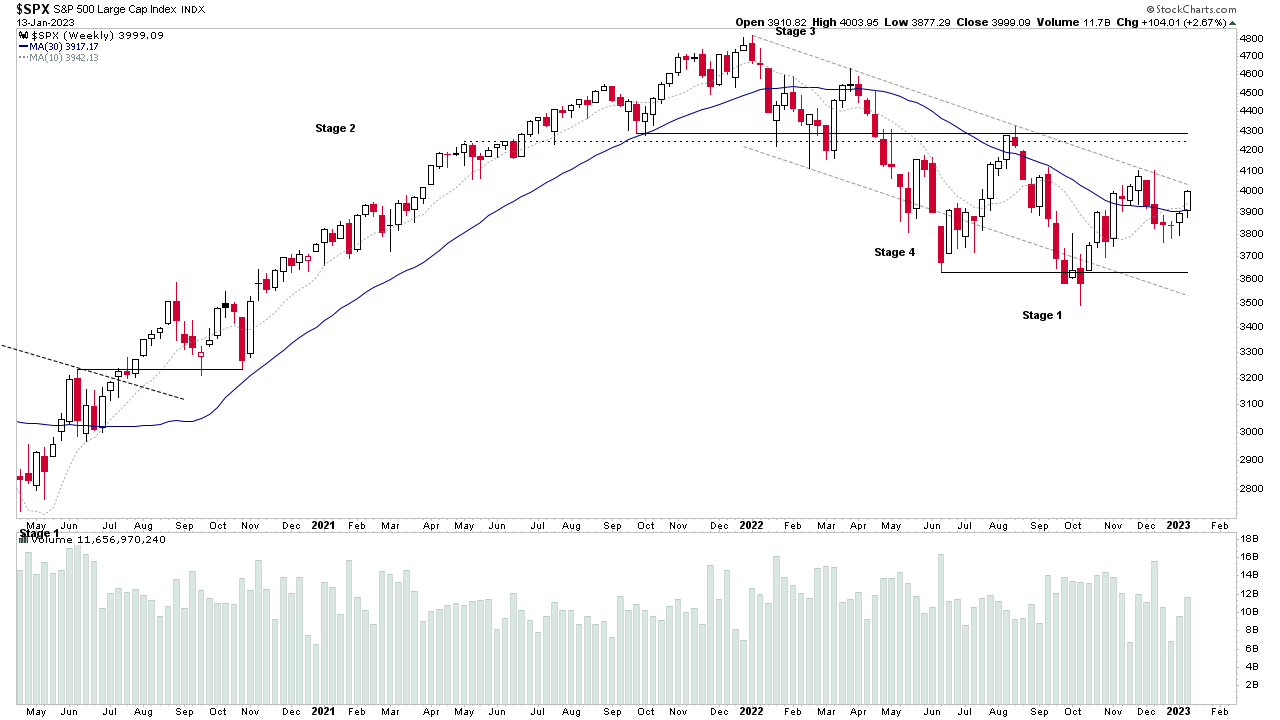
15 January, 2023
Stage Analysis Members Video – 15 January 2023 (1hr 15mins)
The Stage Analysis members weekend video featuring analysis of the major US Indexes as many approach their Stage 2 levels. Followed by a look at the futures charts, US Industry Groups RS Rankings, IBD Industry Groups Bell Curve - Bullish Percent, the Market Breadth Update to help to determine the Weight of Evidence and finishing with the US Stocks Watchlist in detail on multiple timeframes.
Read More
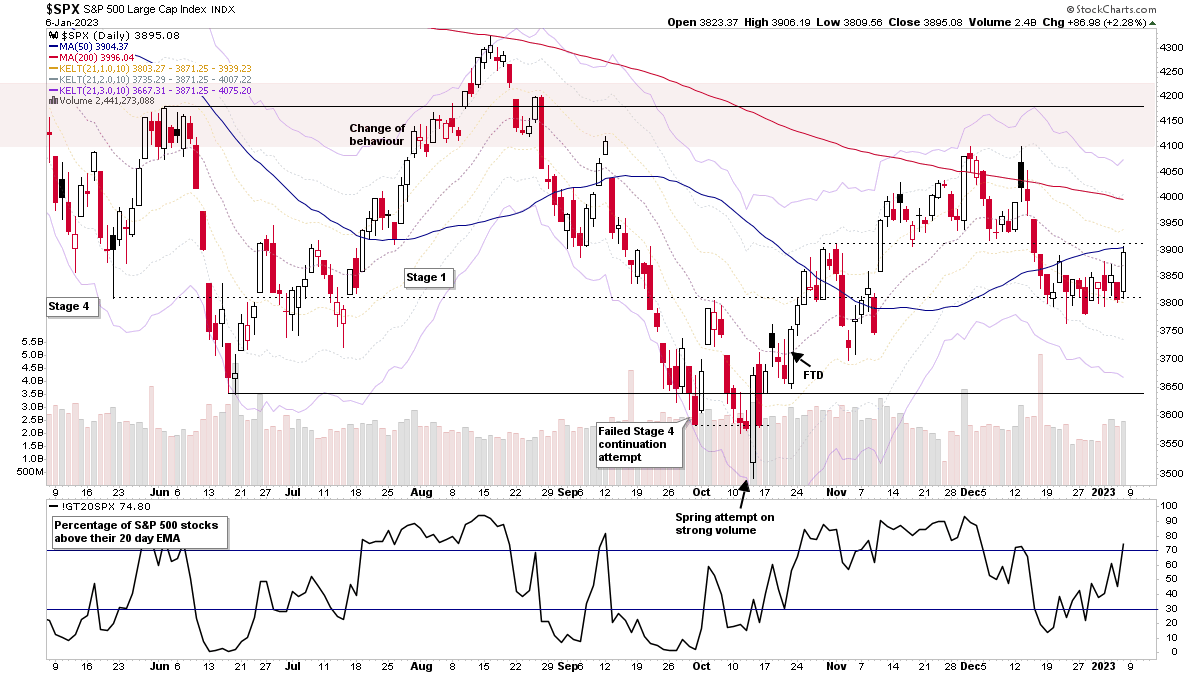
08 January, 2023
Stage Analysis Members Video – 8 January 2023 (1hr 22mins)
The Stage Analysis members weekend video featuring analysis of the US Sectors and major US Indexes. Followed by a look at the futures charts, US Industry Groups RS Rankings, IBD Industry Groups Bell Curve - Bullish Percent, Nasdaq 100 SATA Scores, the Market Breadth Update to help to determine the Weight of Evidence and finishing with the US Stocks Watchlist in detail on multiple timeframes.
Read More
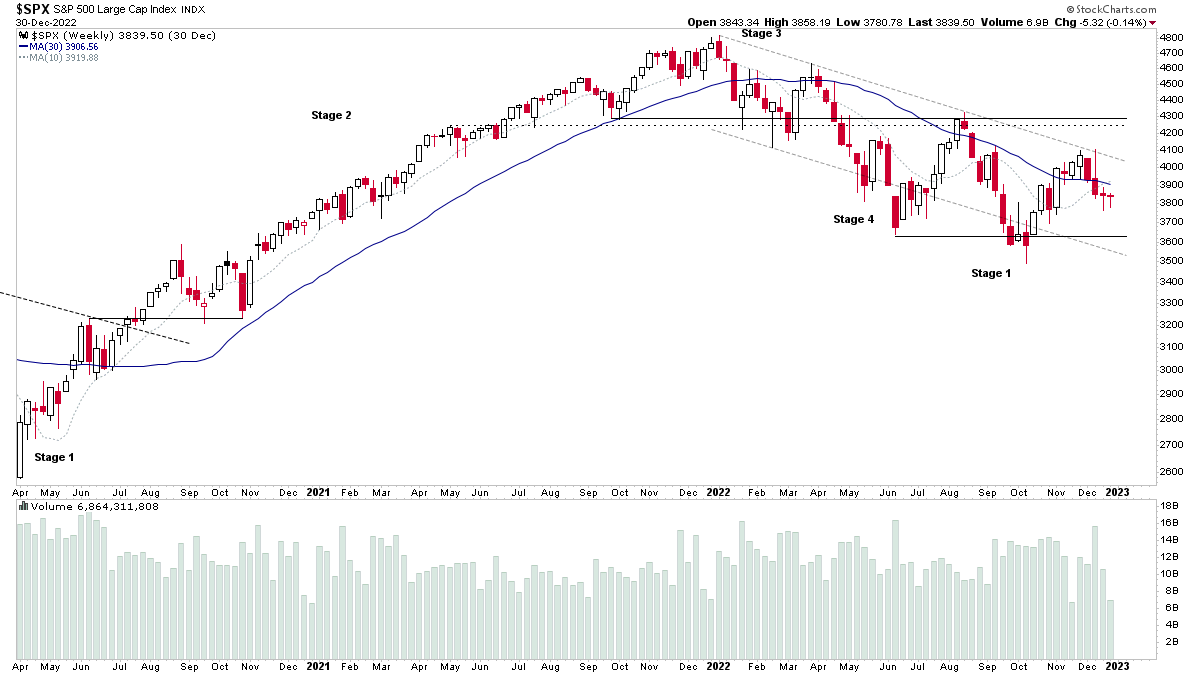
02 January, 2023
Stage Analysis Members Video – 2 January 2023 (1hr 31mins)
The Stage Analysis members weekend video with an end of year review of the markets, and special features on the US Industry Groups Relative Strength 2022 strongest groups, and the IBD Top 5 stocks of 2022. Plus the IBD industry group bell curve, and the market breadth charts to determine the weight of evidence. Followed by the US watchlist stocks in detail on multiple timeframes.
Read More
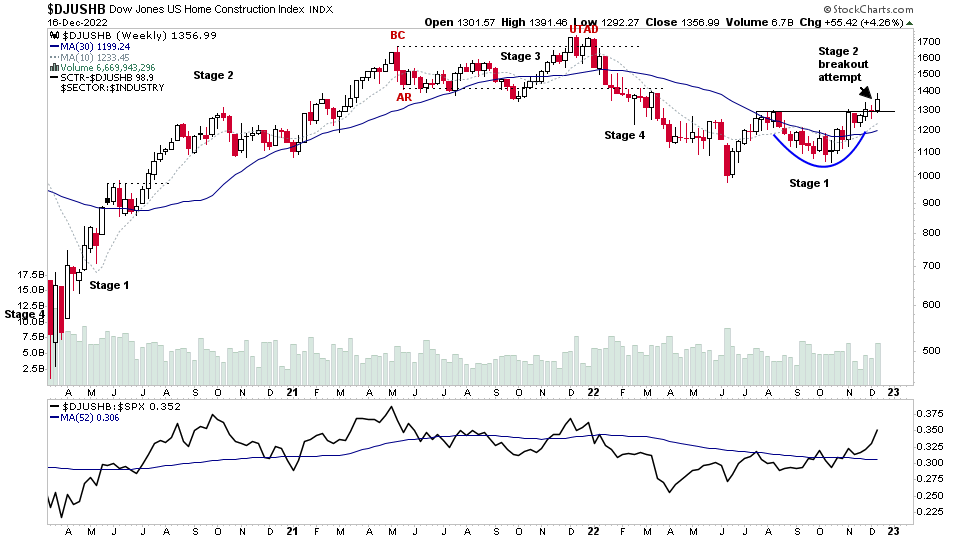
18 December, 2022
Stage Analysis Members Video – 18 December 2022 (1hr 23mins)
The Stage Analysis members weekend video begins this week with a special focus on the Home Construction Group stocks, of which multiple stocks within the group made a Stage 2 breakout attempt this week against the weak market action...
Read More