
US Stock Market Breadth Update - 29th November 2020
NYSE & Nasdaq Percentage of Stocks Above their 50 Day, 150 Day and 200 Day Moving Averages Charts
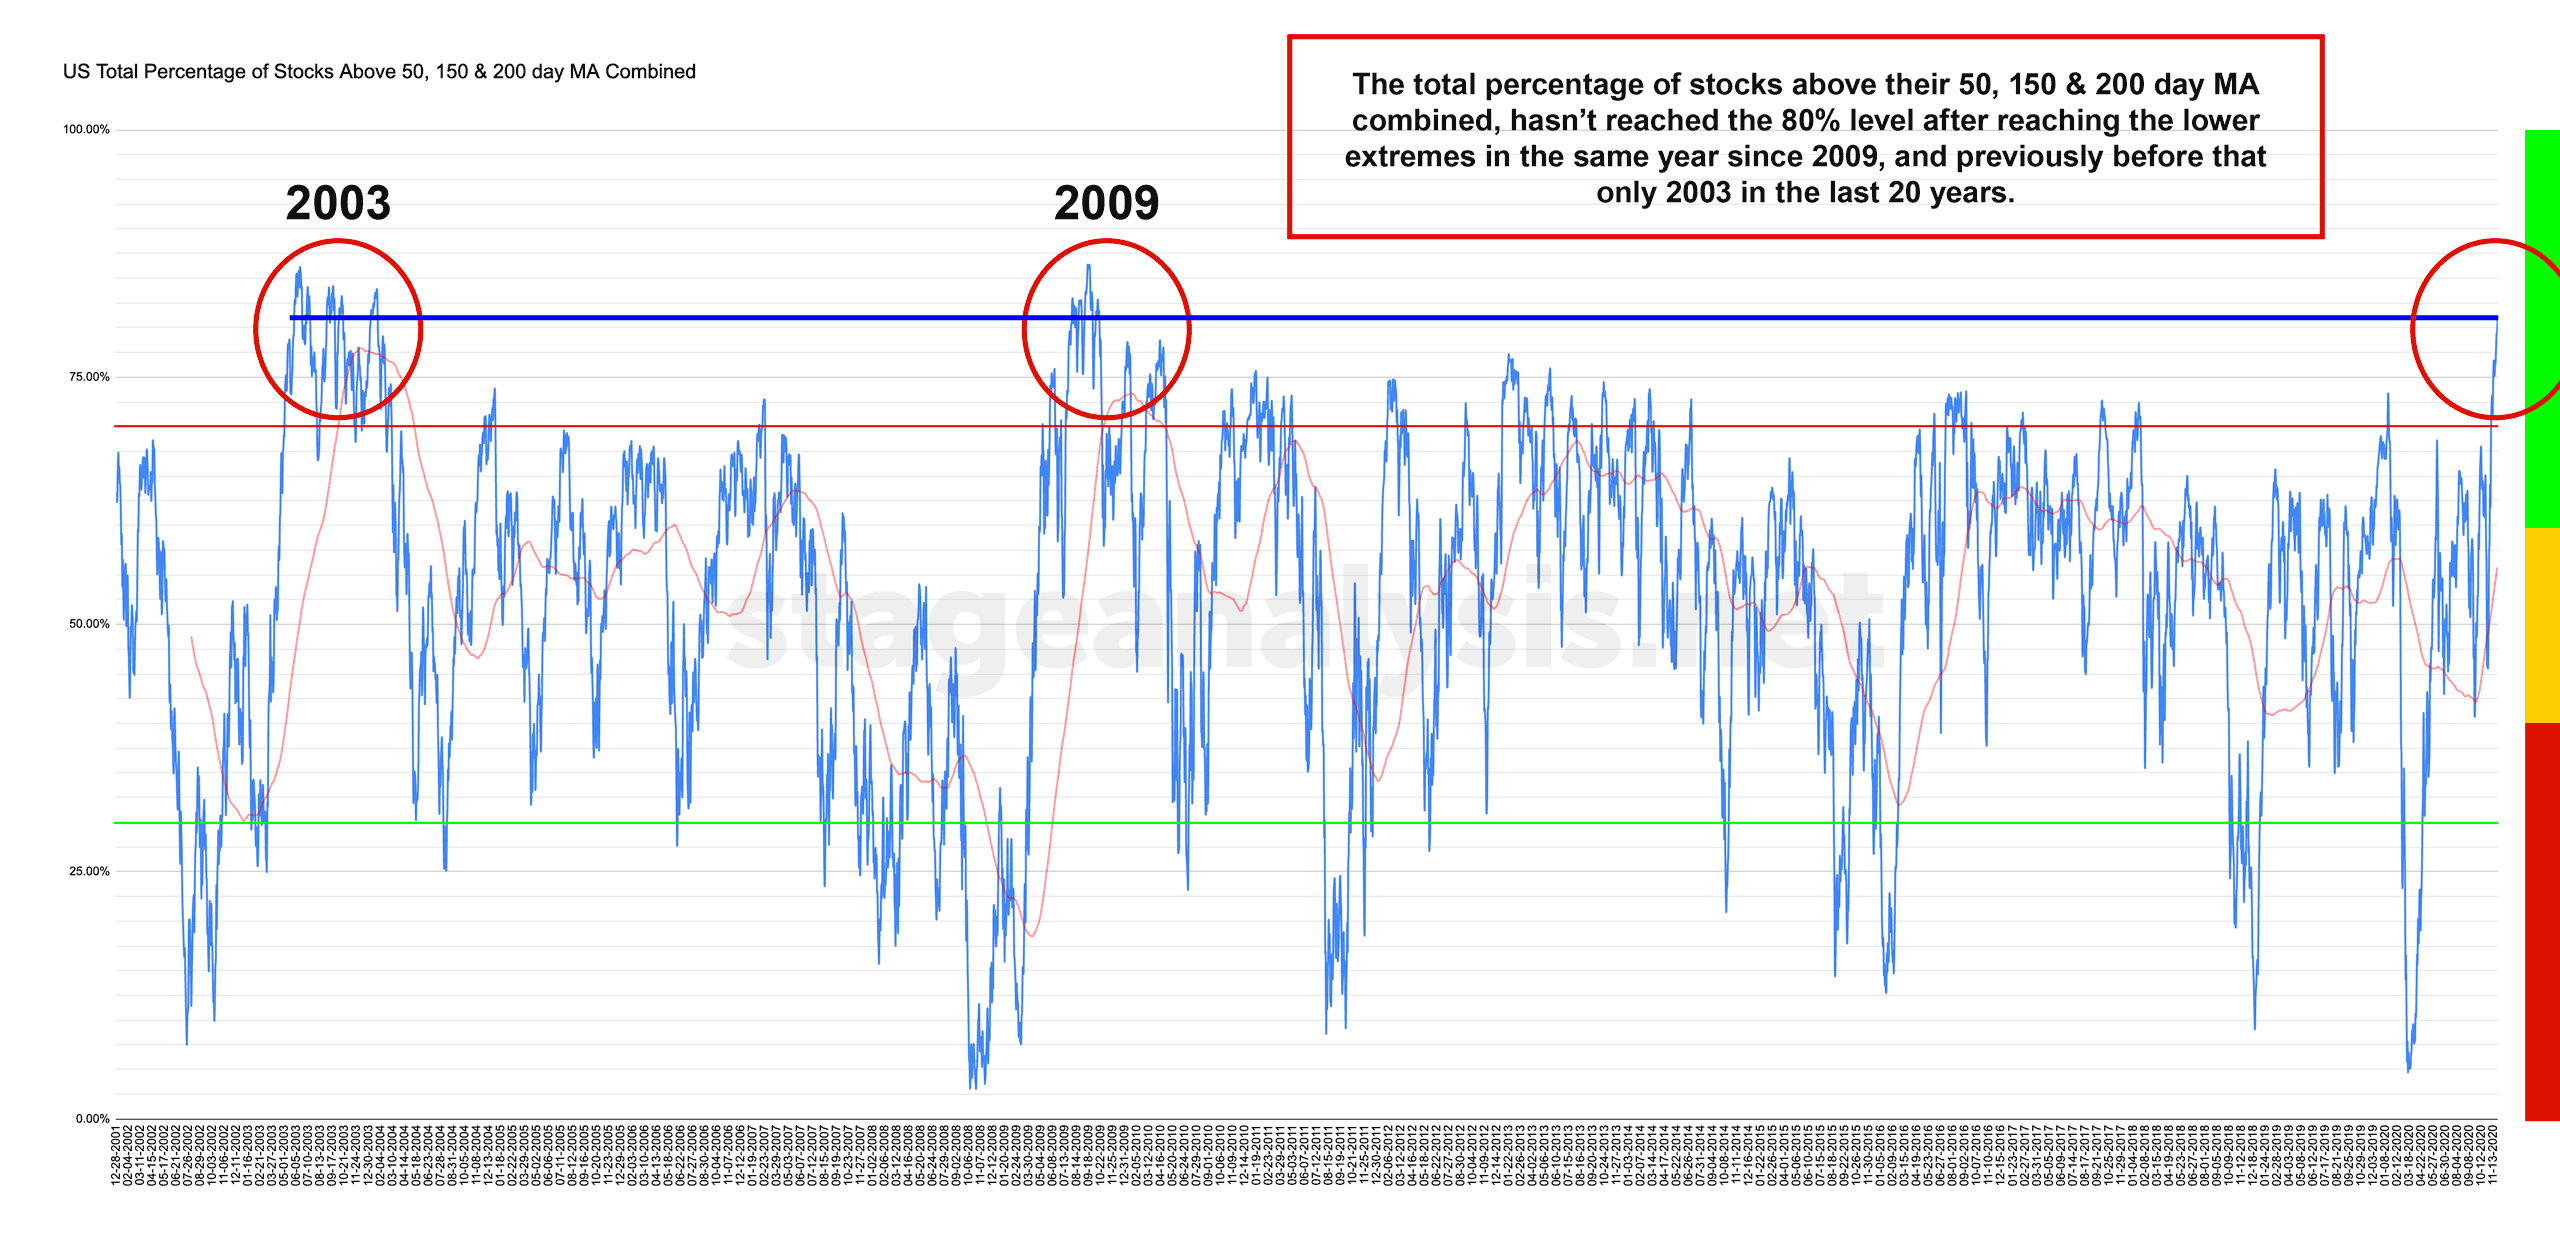
Potential Major Market Breadth signal that the Bull market is still only just beginning.
The 80%+ level has only been reached twice before in June 2003 & August 2009 as you can see attached. So although in the upper risk range. A major sign of strength.
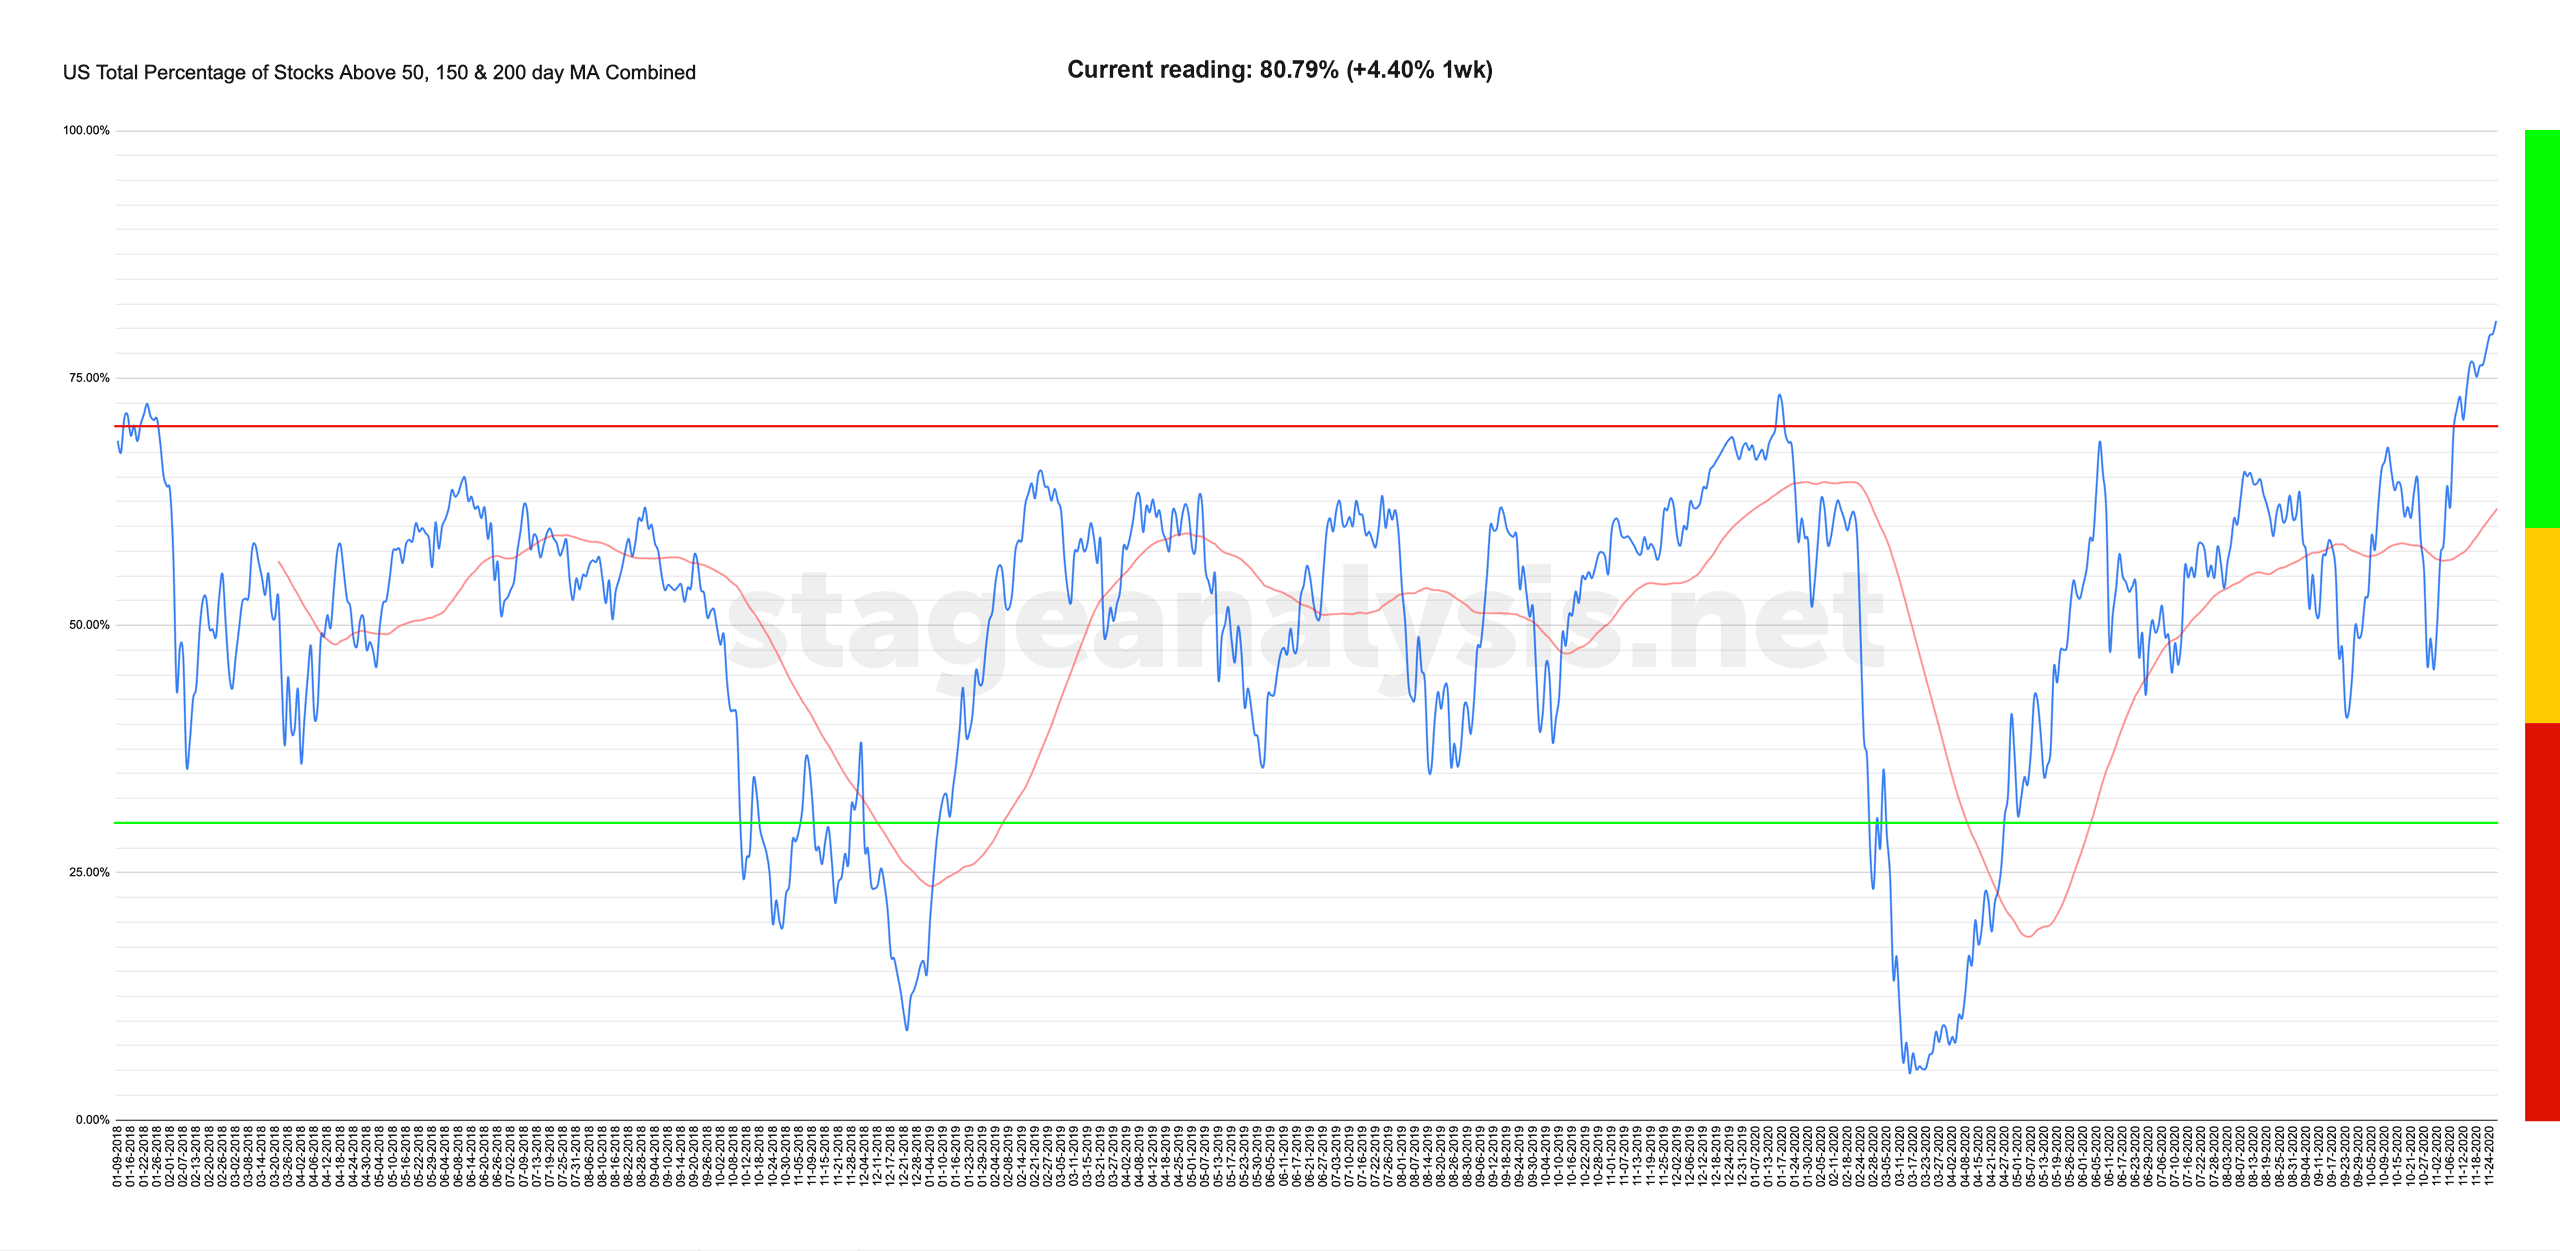
- US Total % Stocks Above their 50 Day, 150 Day and 200 Day Moving Averages = 80.79% (+4.40% 1wk)
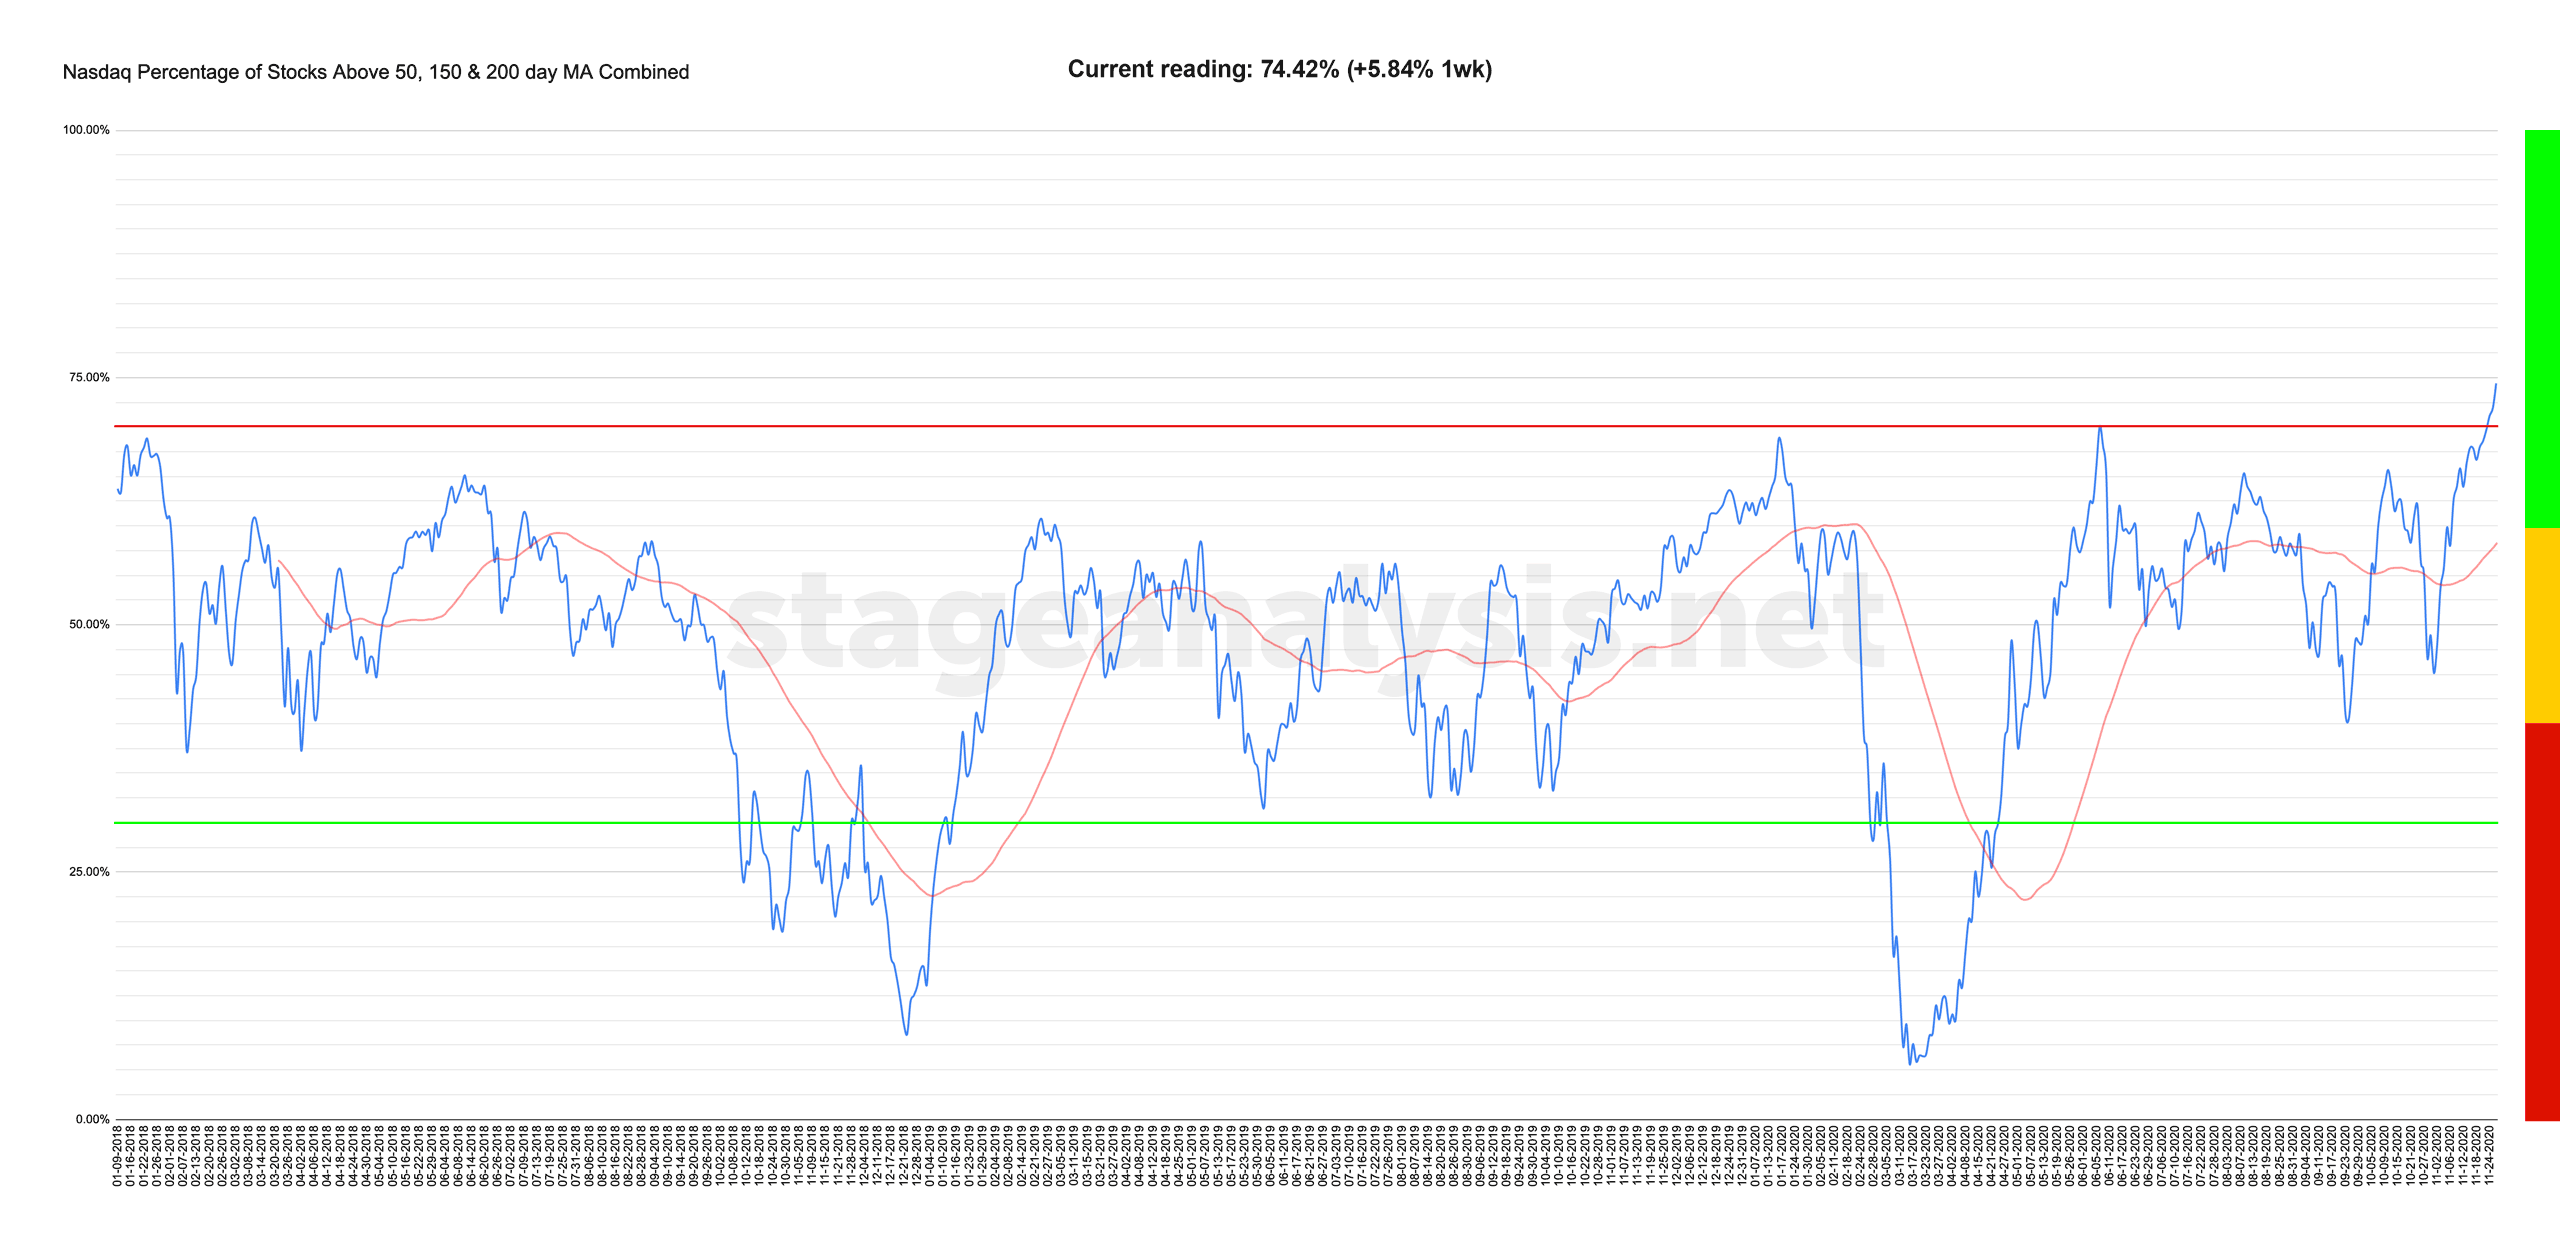
- Nasdaq Total % Stocks Above their 50 Day, 150 Day and 200 Day Moving Averages = 74.42% (+5.84% 1wk)
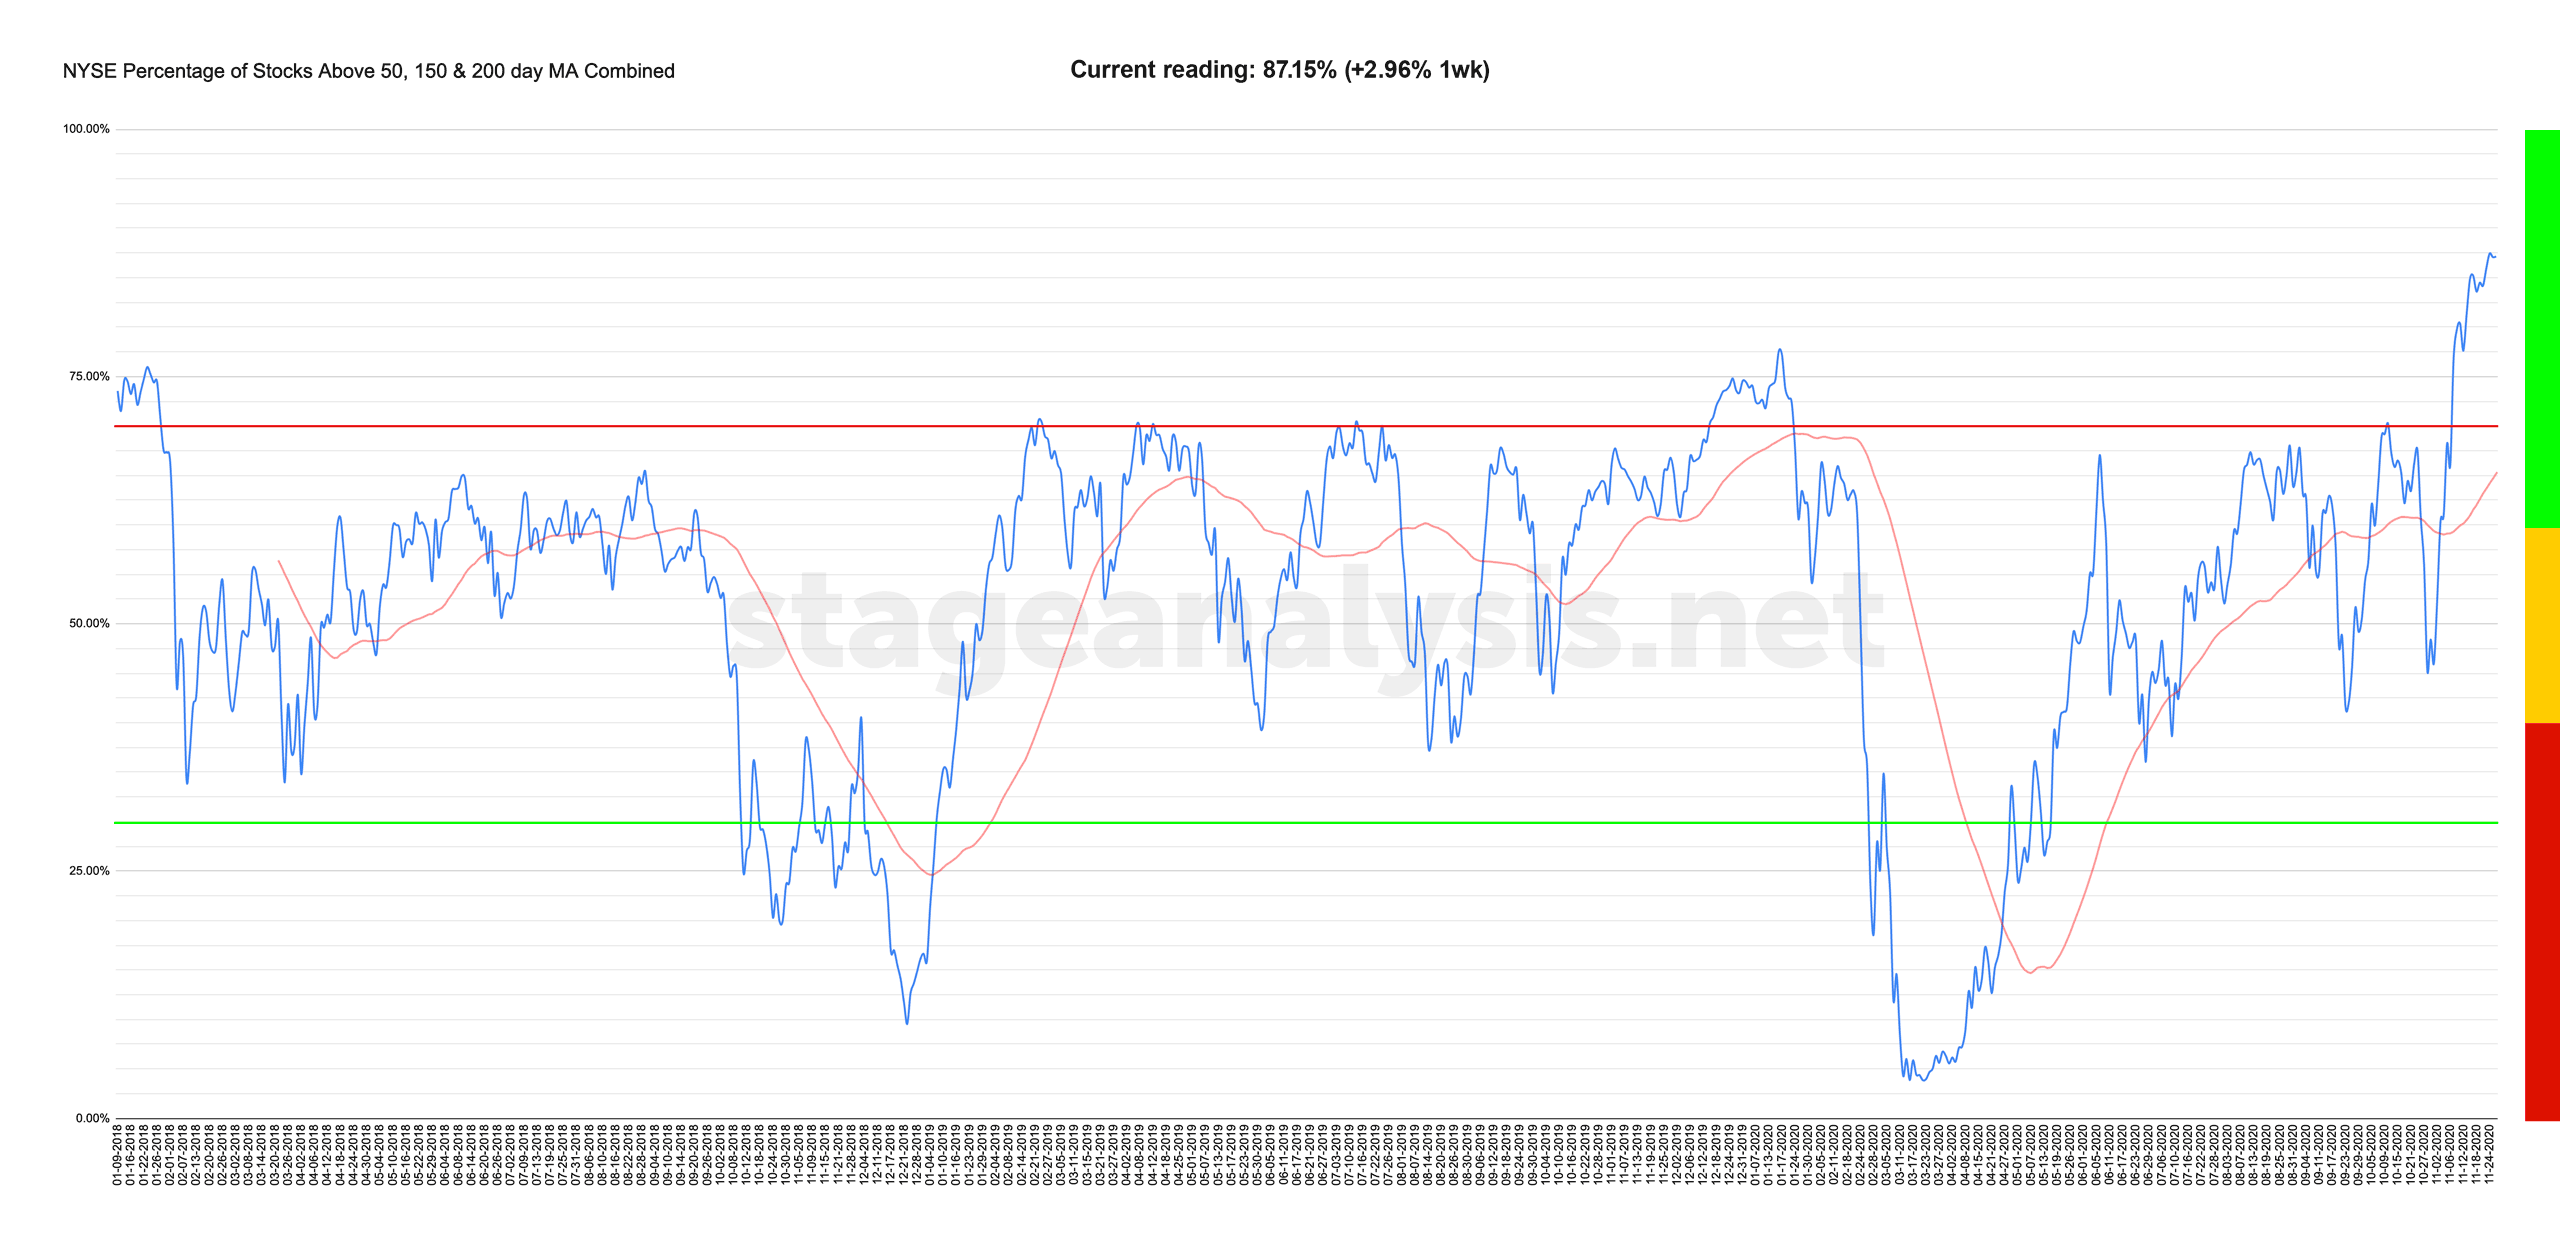
- NYSE Total % Stocks Above their 50 Day, 150 Day and 200 Day Moving Averages = 87.15% (+2.96% 1wk)
Continuing to be at the extremes of the upper range above the key 70% level.
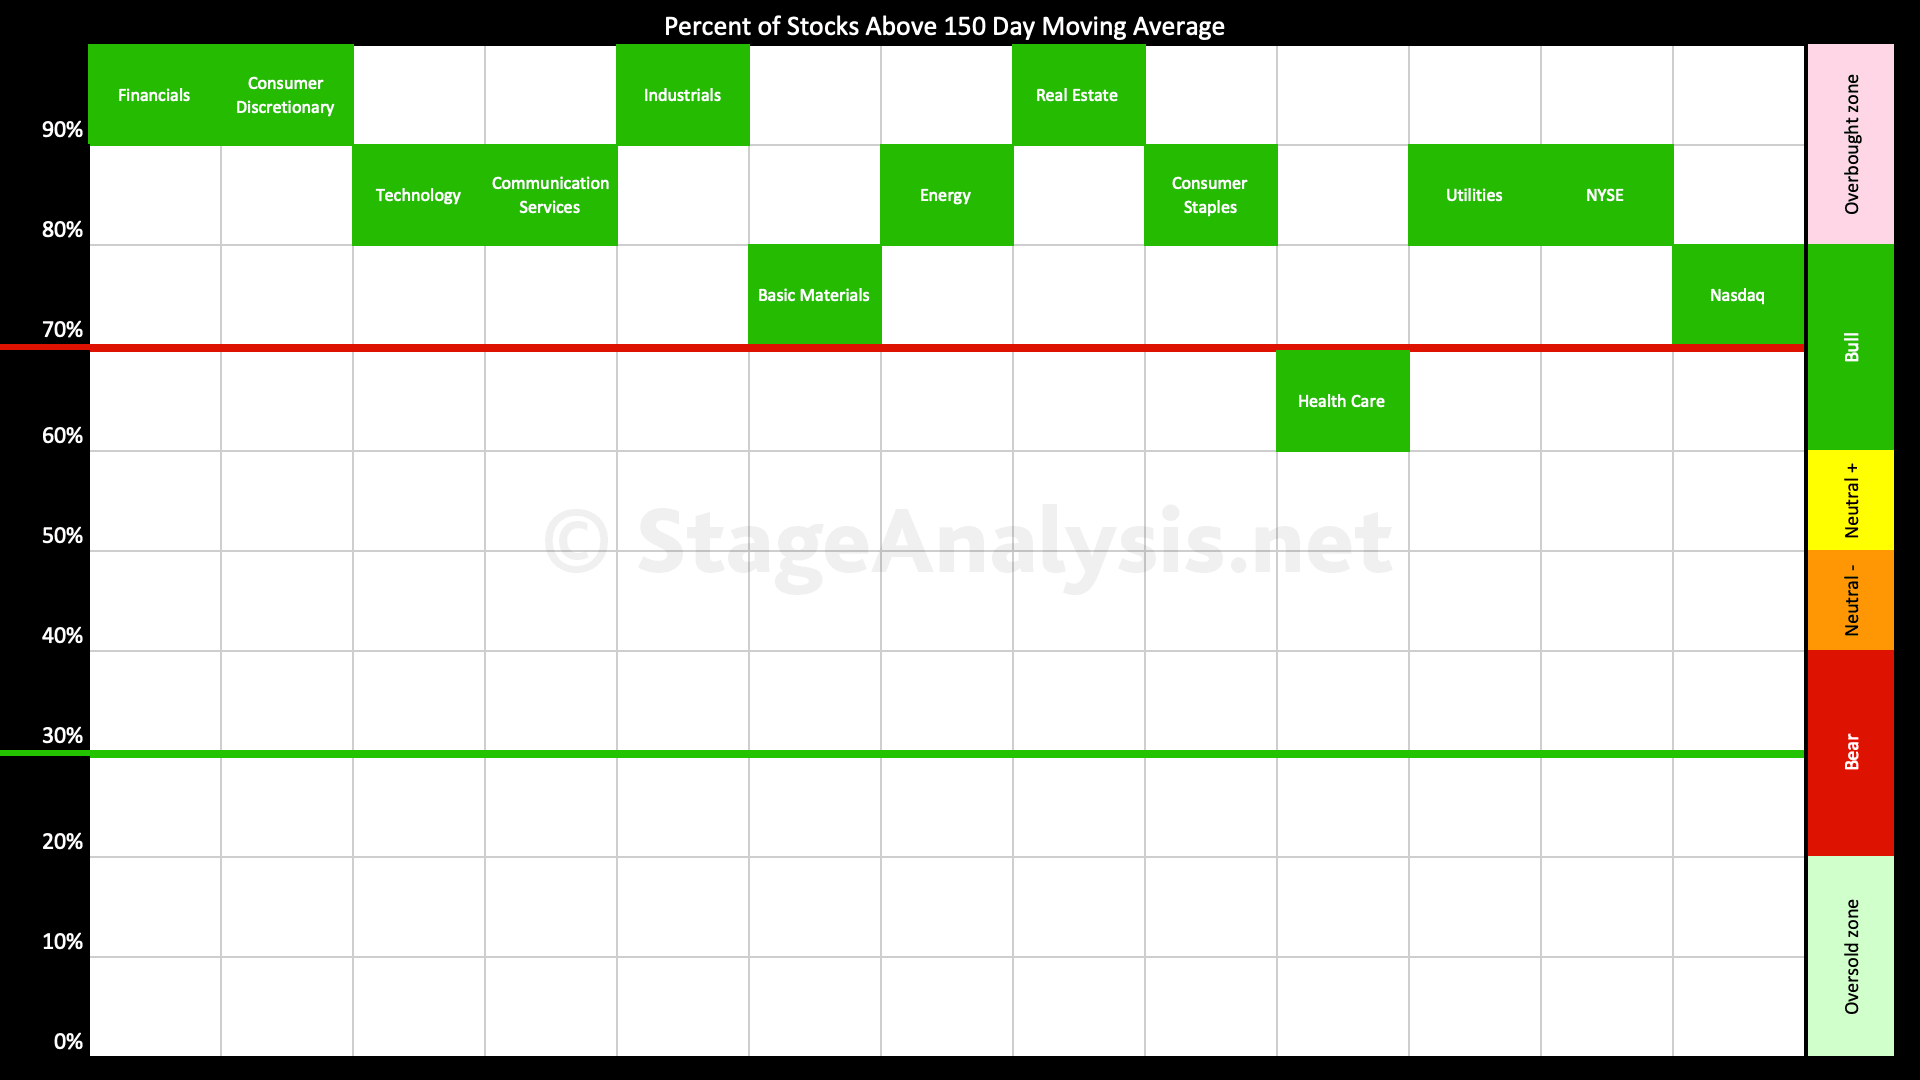
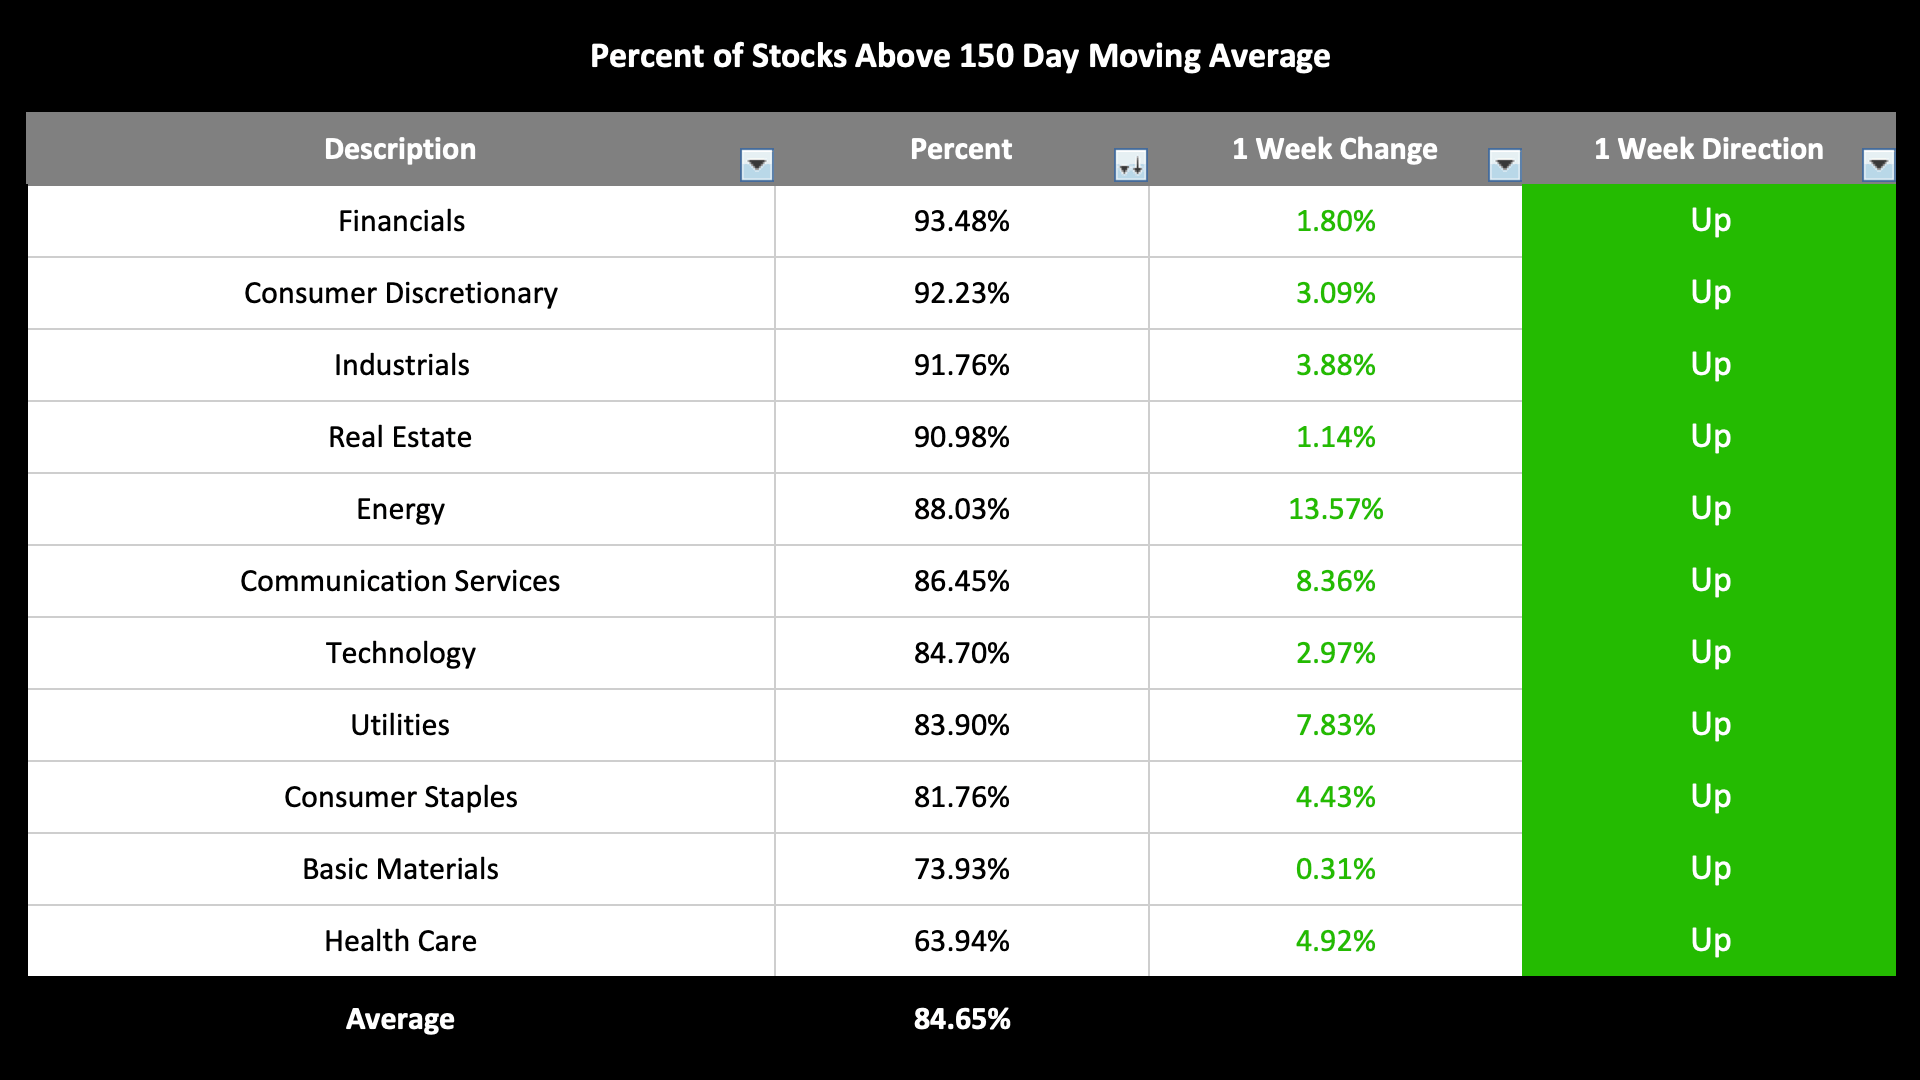
US Sectors: Percent of Stocks Above 150 Day Moving Averages
Sector Average at 84.65% (+4.75% 1wk) - which is in the Stage 2 zone (Bullish). With Energy & Communication Services having the weeks biggest moves
US Sectors: Percent of Stocks Above 150 Day Moving Averages Table.
Four sectors with a breadth thrust to the extremes above 90%. First time this year any sectors have been above 90%.
Enjoy the ride, but don't chase
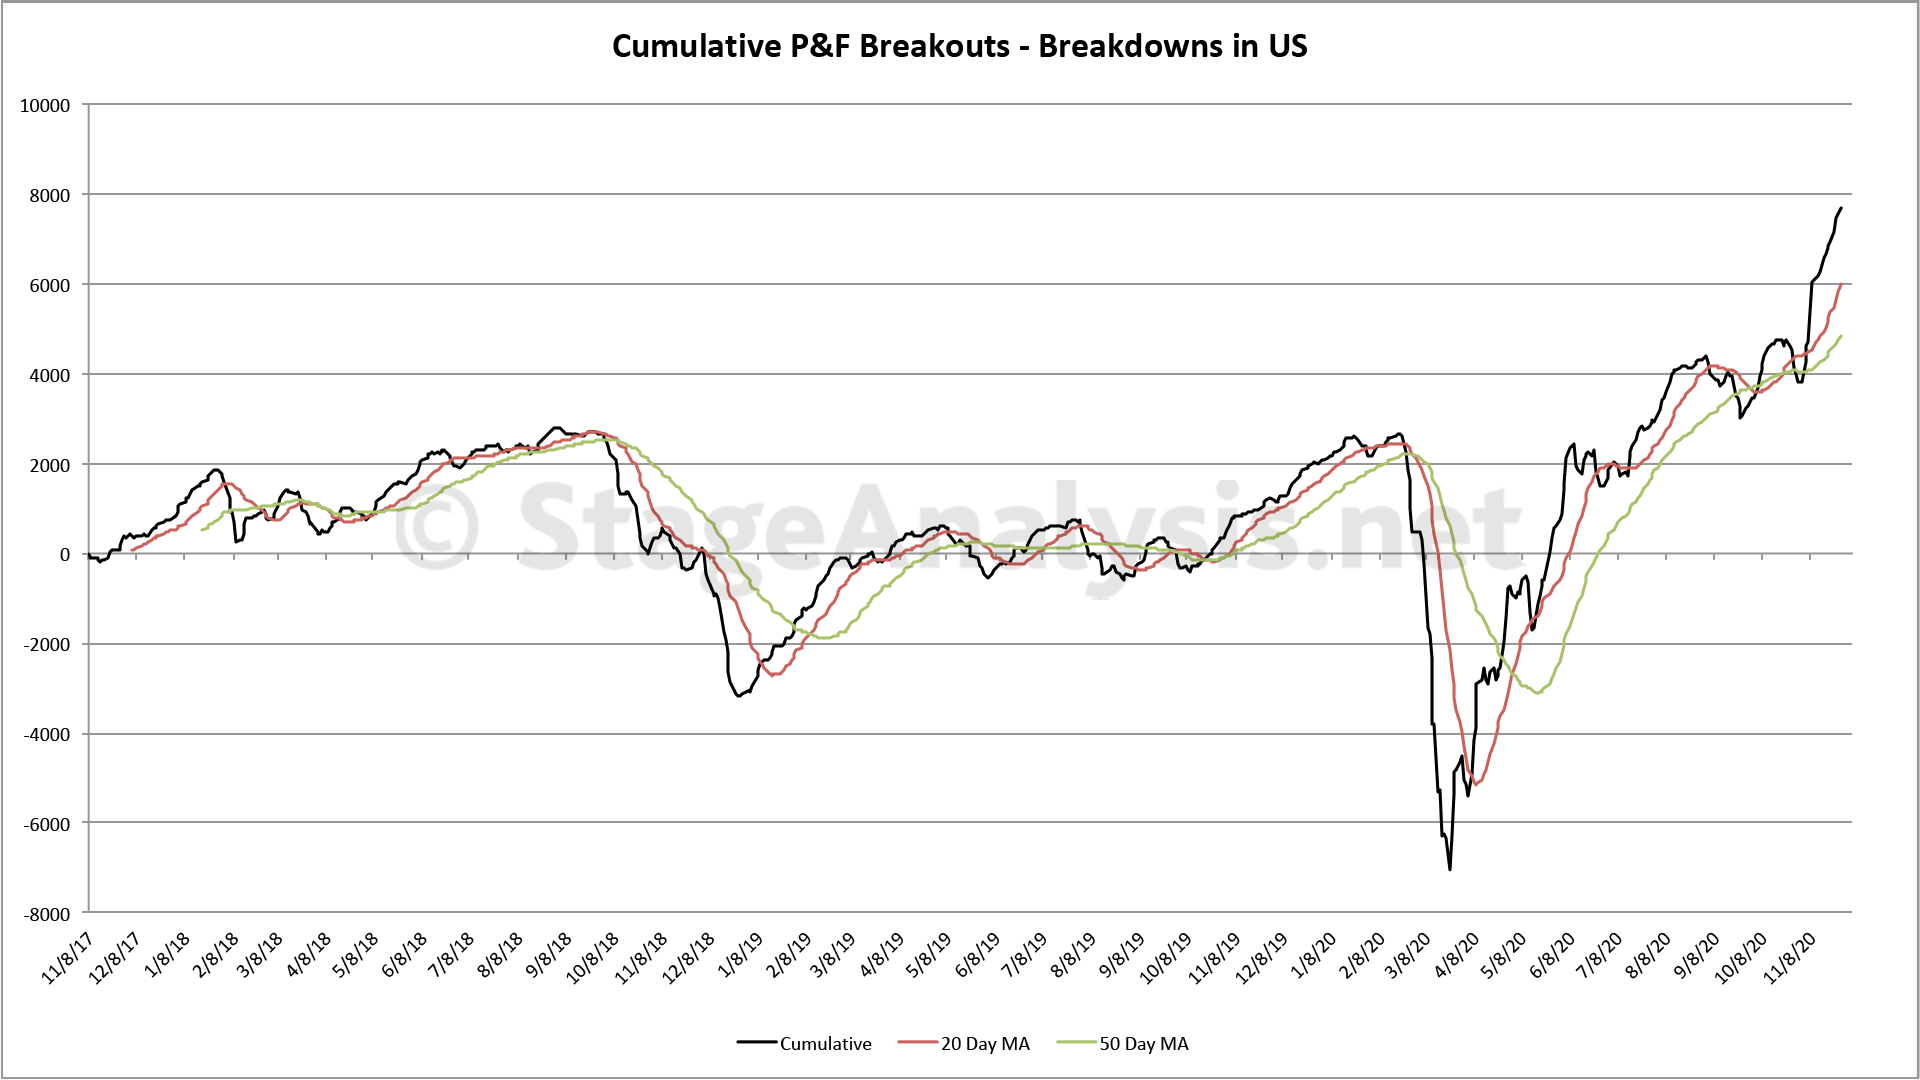
Cumulative Point & Figure Breakouts - Breakdowns
Totals for the week:
+920 double top stock breakouts
-152 double bottom stock breakdowns
+768 net stock breakouts - stock breakdowns
Note: continuing to make new all time highs
#stocks #trading #nasdaq #StockMarket #StockTrading #money #investing
Disclaimer: For educational purpose only. Not investment advice. Seek professional advice from a financial advisor before making any investing decisions.