
US Market Review – 19 October 2023
With the continued near-term correction in the major US stock market indexes, I thought it would be useful to do a broad review and Stage Analysis of some of the major charts in order to help to determine the current state of the market, beginning with the precious metals...
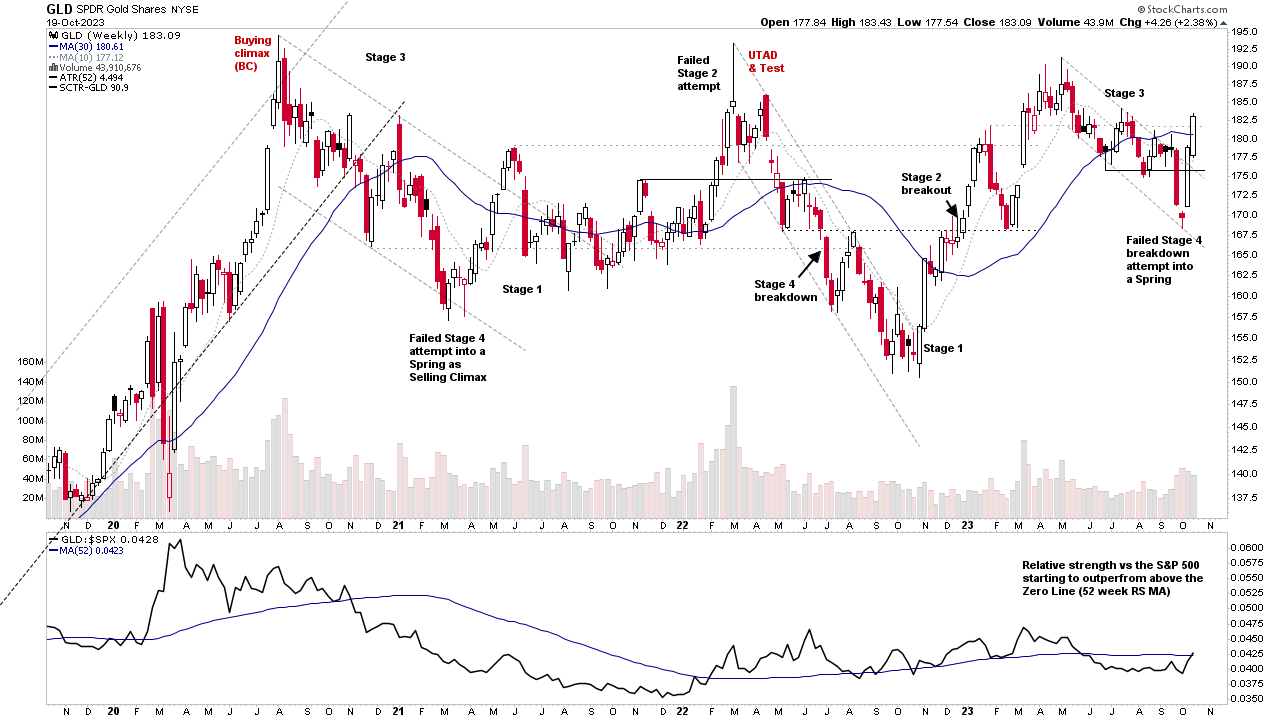
Gold (GLD) has recovered back above its medium and longer-term moving averages this week, following a now failed and brief Stage 4 breakdown attempt in late September, which morphed into a Spring. So if it can hold above the 200 day MA on any pullback and follow through, then there could be potential for it to make a new Stage 2 attempt. Hence it may be a good time to start tracking the gold mining stocks, if you are not already, as they have been appearing in the watchlist posts throughout October.
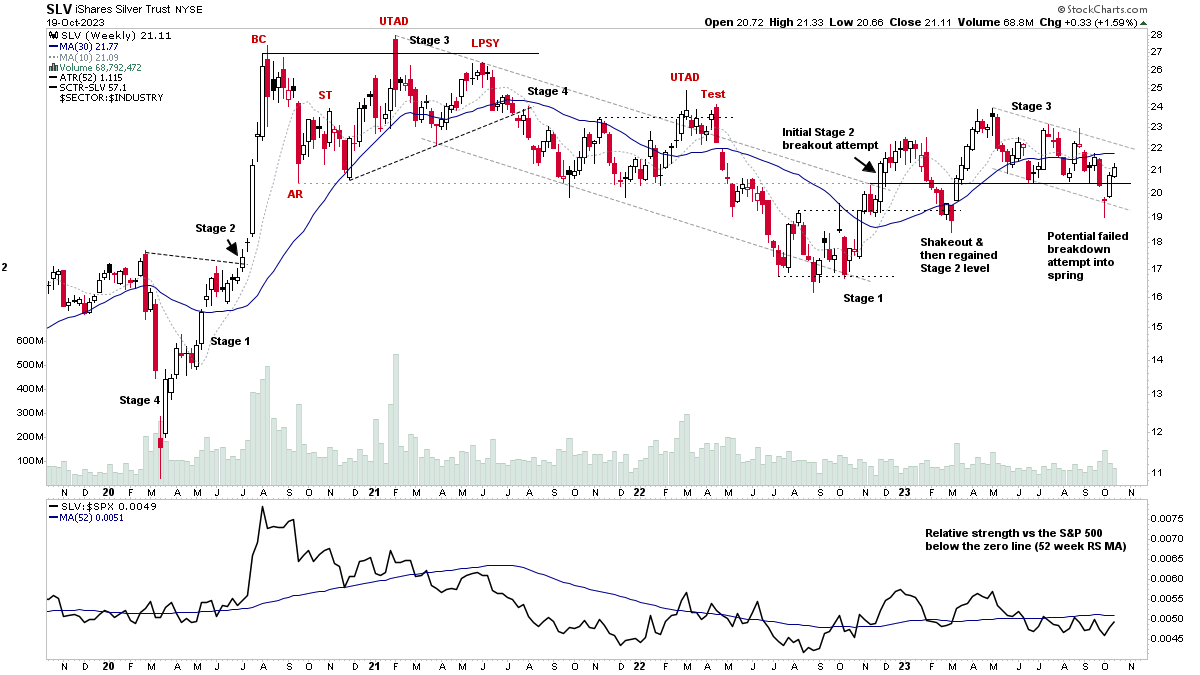
Silver (SLV) has also seen a similar recovery to Gold, but to a lesser extent, as it's still below its 30 week MA and 200 day MA and its SATA Score remains weak currently. But strength in Gold often filters through to Silver and the miners, as they are strongly correlated assets. But Silver is considerably more volatile.
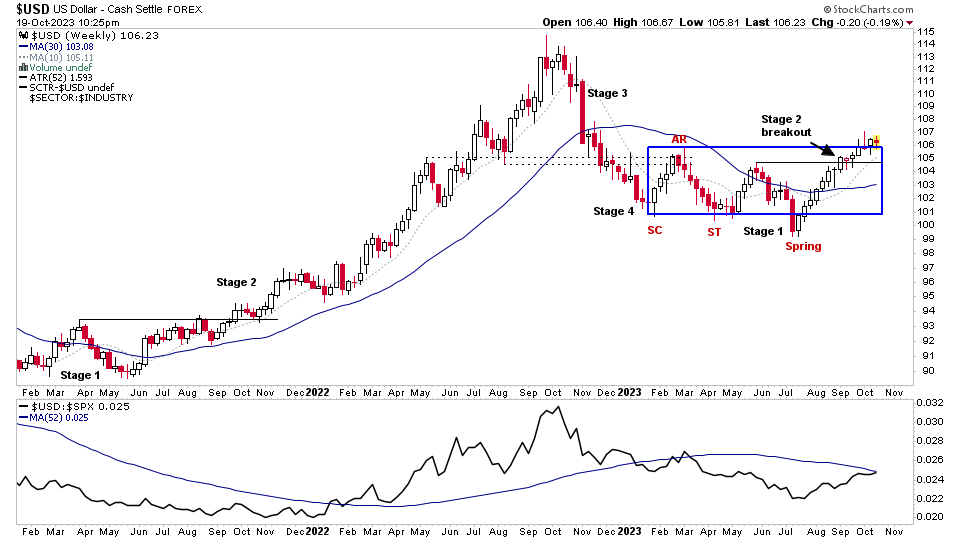
The US Dollar Index is a key component in regard to the precious metals, and for the majority of the time it has an inverse correlation to them. But this has eased a little over the last quarter or so, with a few spikes in the correlation back towards zero (i.e. uncorrelated), but the longer term 200 day average correlation is still -0.59 currently in spot gold / USD, which is still a fairly strong negative correlation.
In terms of the US Dollar Index Stage Analysis. It broke out into Stage 2 six weeks ago, when it was still within the broader base structure, that had been developing since early in year, when it was still in Stage 4 and made a Selling Climax (SC) and Automatic Rally (AR). The Mansfield Relative Strength line is currently back at the still declining zero line, and the moving averages have turned up.
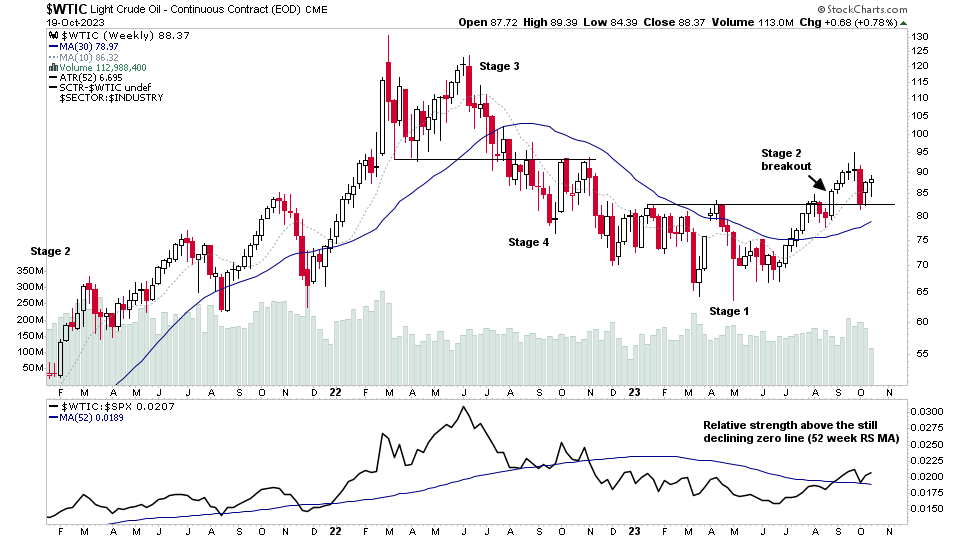
Light Crude Oil ($WTIC) broke out into early Stage 2 seven weeks ago (which is referred to as Stage 2A – see Stan Weinstein's Stage Analysis - Definitions of the Stages and Sub-stages post for the definitions and Stages examples) and rebounded from the backup to the breakout level two weeks ago, which is the potential secondary entry zone in the investor method, and so Crude Oil is one of the strongest areas of the market currently. As it is moving into early Stage 2, while stocks in the broader market have been correcting into Stage 3, with many also moving lower in Stage 4. So the Crude Oil stocks remain a current area of focus in terms of relative strength.
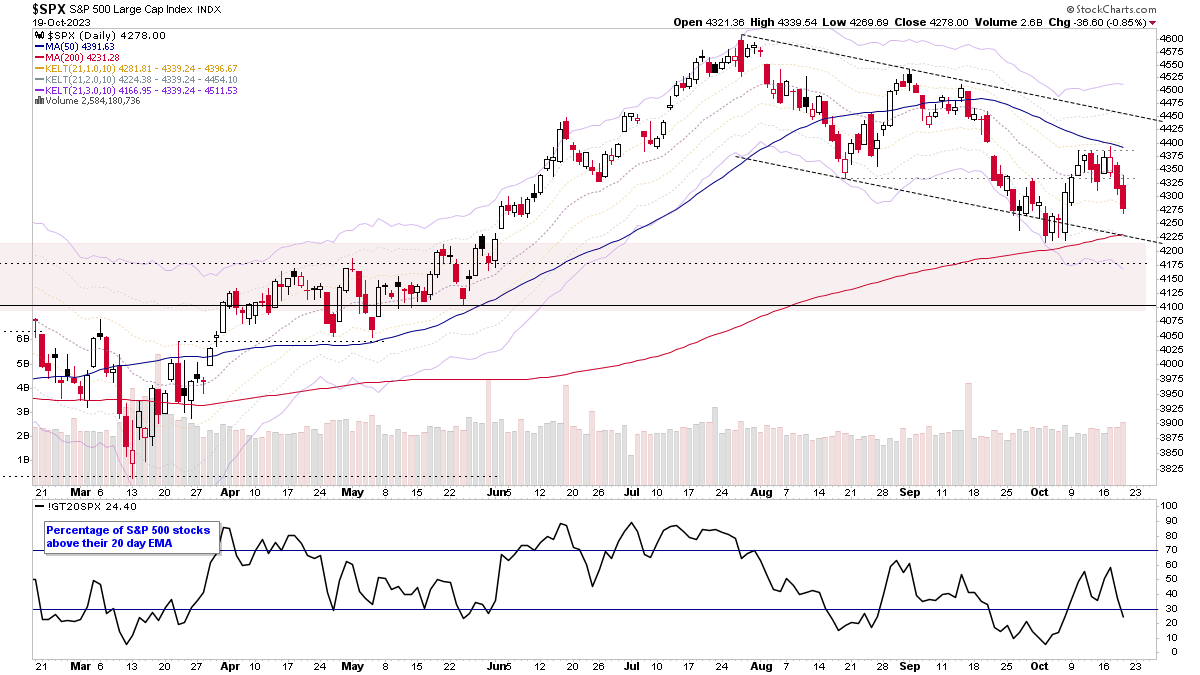
The S&P 500 continues to make lower highs and lower lows since the 27th July peak in the Stage 2 advance, and so is in a short-term downtrend channel, and is pulling back towards its 200 day MA once more and the recent pivot low from the 3rd October.
The weekly chart has moved into early Stage 3 territory, as the correction has been significant – approaching three months, and has brought it all the way back towards its Stage 2 level and under its 30 week MA currently. So deterioration below the recent pivot low would certainly be cause for concern. But if it can find support in the current short-term range, then it could yet recover back into Stage 2. As has been the case in many Stage 2 advances in the past. So the coming week/s could be pivotal.
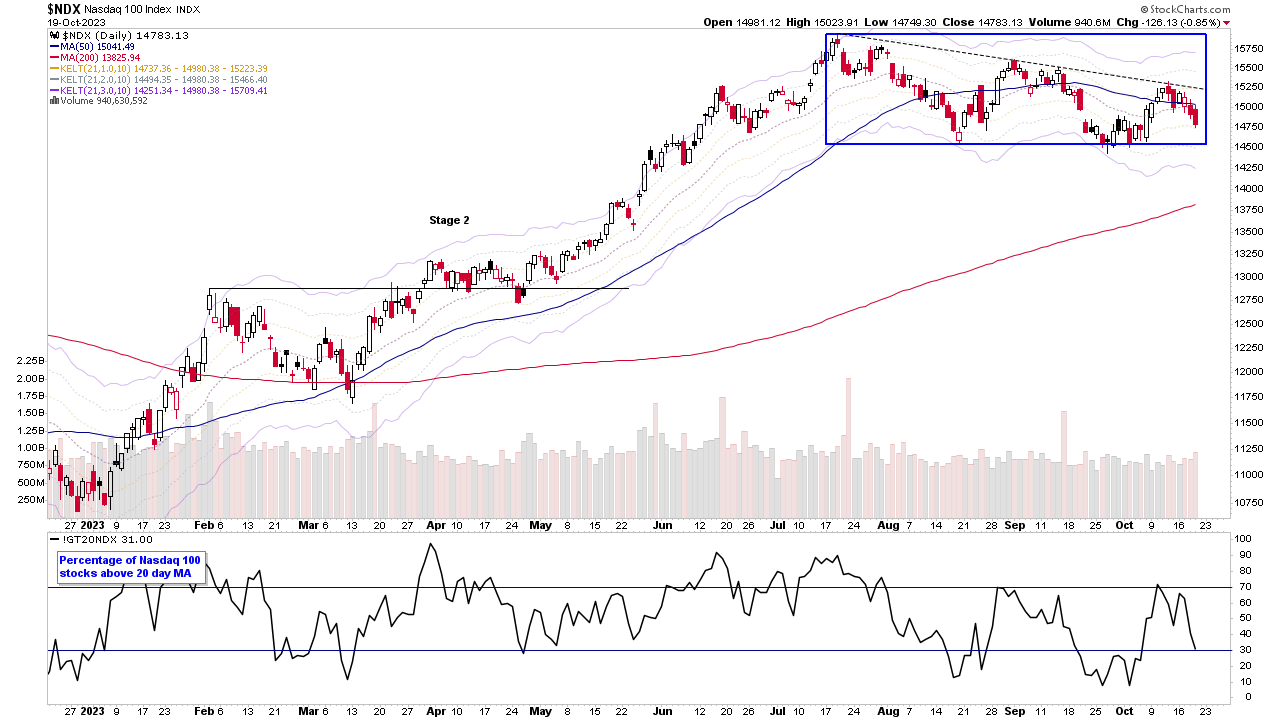
The Nasdaq 100 remains the leading US stock market index year to date, with it still holding above its recent pivot lows, a rising 30 week MA and +6.92% above its 200 day MA. Therefore, it would still be considered in Stage 2, but it is on the borderline of potential early Stage 3. And so as with the S&P 500, the coming week/s are likely to be pivotal, especially with earnings results starting to come out.
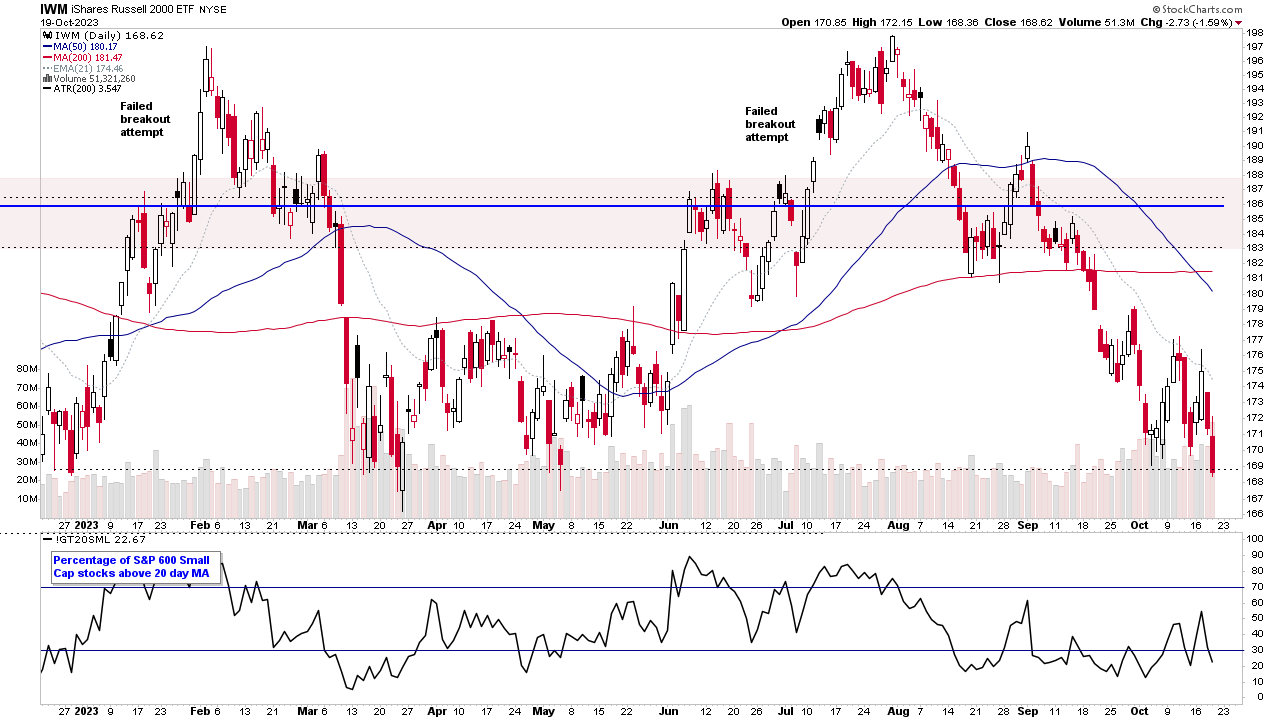
And finally, the Russell 2000 Small Caps Index. Which continues to be the major laggard year to date of the US indexes, and is currently testing the lows of the broader structure. So any further weakness could see it re-enter Stage 4, but at the moment would give it a Stage 1- rating, as it's very weak near to the lows of the Stage 1 structure. But if the market firms up, then it's in position for a potential Spring attempt.
Become a Stage Analysis Member:
To see more like this – US Stocks watchlist posts, detailed videos each weekend, use our unique Stage Analysis tools, such as the US Stocks & ETFs Screener, Charts, Market Breadth, Group Relative Strength and more...
Join Today
Disclaimer: For educational purpose only. Not investment advice. Seek professional advice from a financial advisor before making any investing decisions.