
Stage Analysis Technical Attributes Scores – Nasdaq 100
The Stage Analysis Technical Attributes (SATA) score is our proprietary indicator that helps to identify the four stages from Stan Weinstein's Stage Analysis method, using a scoring system from 0 to 10 that rates ten of the key technical characteristics that we look for when analysing the weekly charts.
We last covered the weekly SATA scores for the Nasdaq 100 back on 16th March, which gives a rough guide of the Stages of the individual stocks within the Nasdaq 100. i.e. everything above a 7 would be considered in the Stage 2 zone (Strong), 4-6 in the Stage 1 or Stage 3 zone (Neutral), and 3 or below is the Stage 4 zone (Weak).
Currently the Nasdaq 100 consists of:
- 44% Stage 2 zone (Strong)
- 28% Stage 1 or Stage 3 zone (Neutral)
- 28% Stage 4 zone (Weak)
Nasdaq 100 Average SATA Score: 5.29 (Neutral)
Percentage of stocks with a technically healthy SATA Score (6+): 56%
Compared to the 16th March post there are +12% more stocks in the Stage 2 zone, -2% less stocks in the Stage 1 or Stage 3 zone, and -10% less stocks in the Stage 4 zone, and so the weighting has shifted, with more stocks now in Stage 2 than Stage 4 in the Nasdaq 100. Which has moved the overall weighting above the mid point to 5.29, which is considered the Neutral+ zone. i.e. In the Neutral zone, but leaning slightly towards strong side.
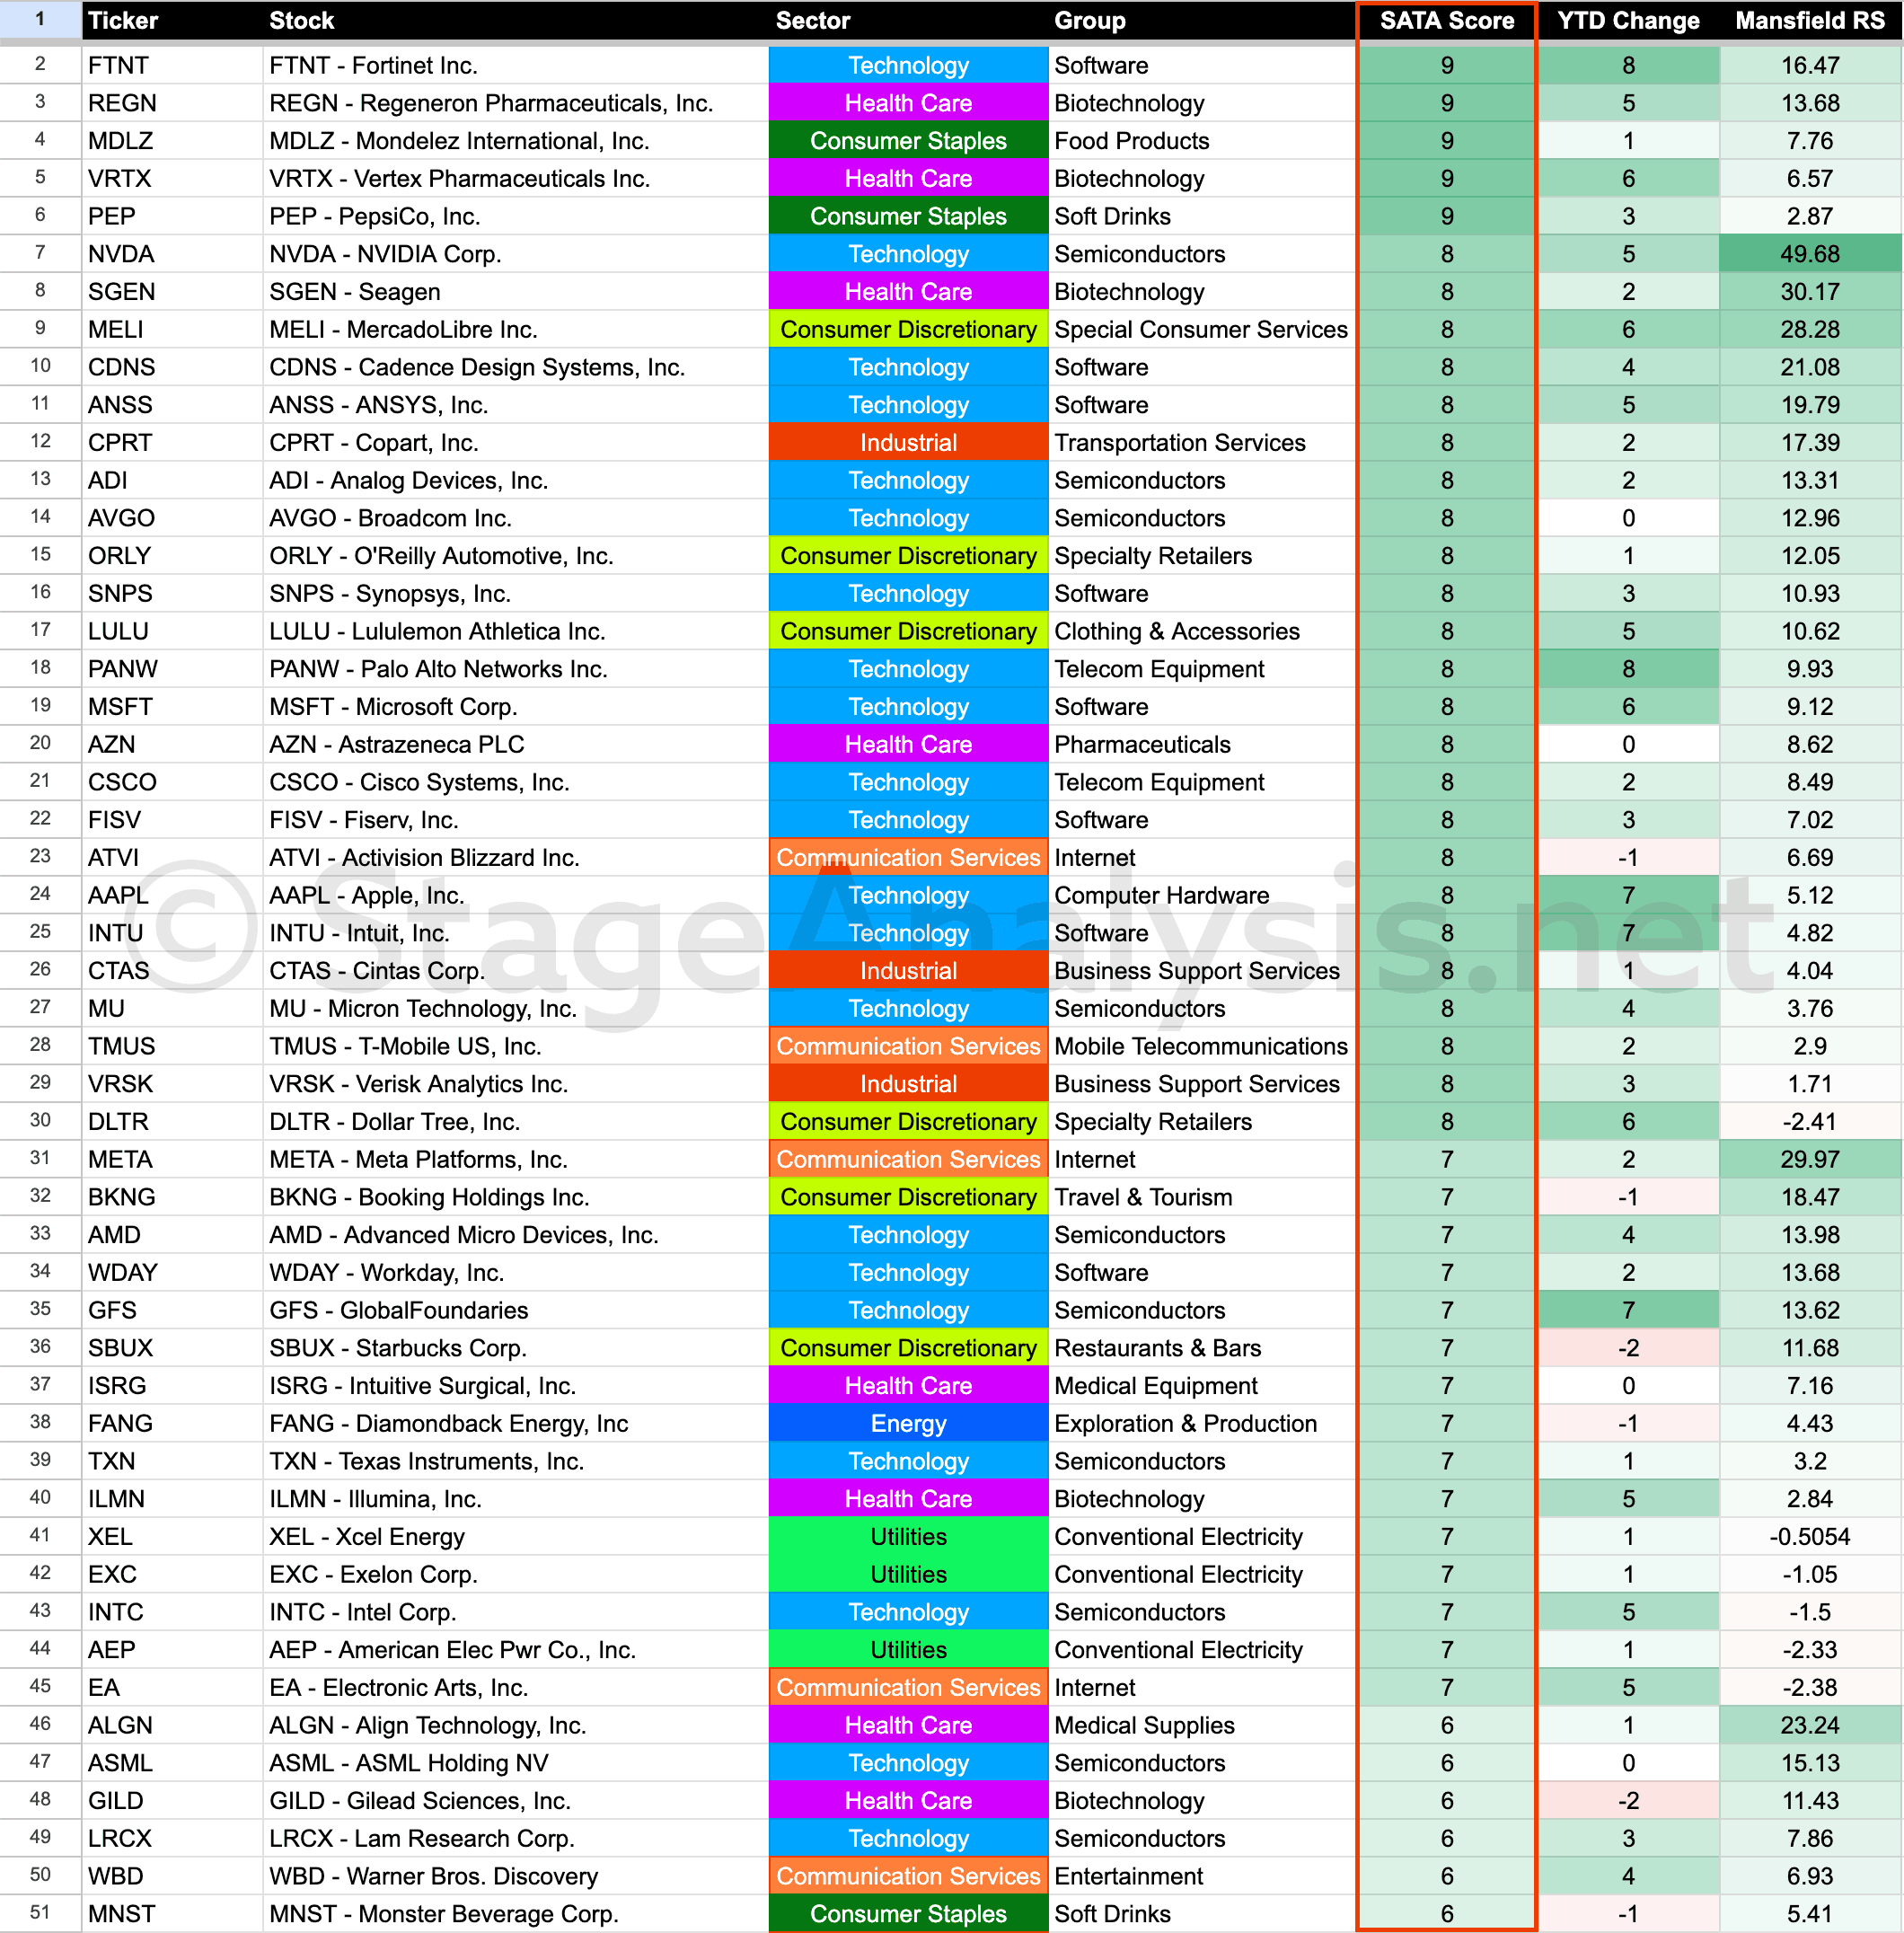
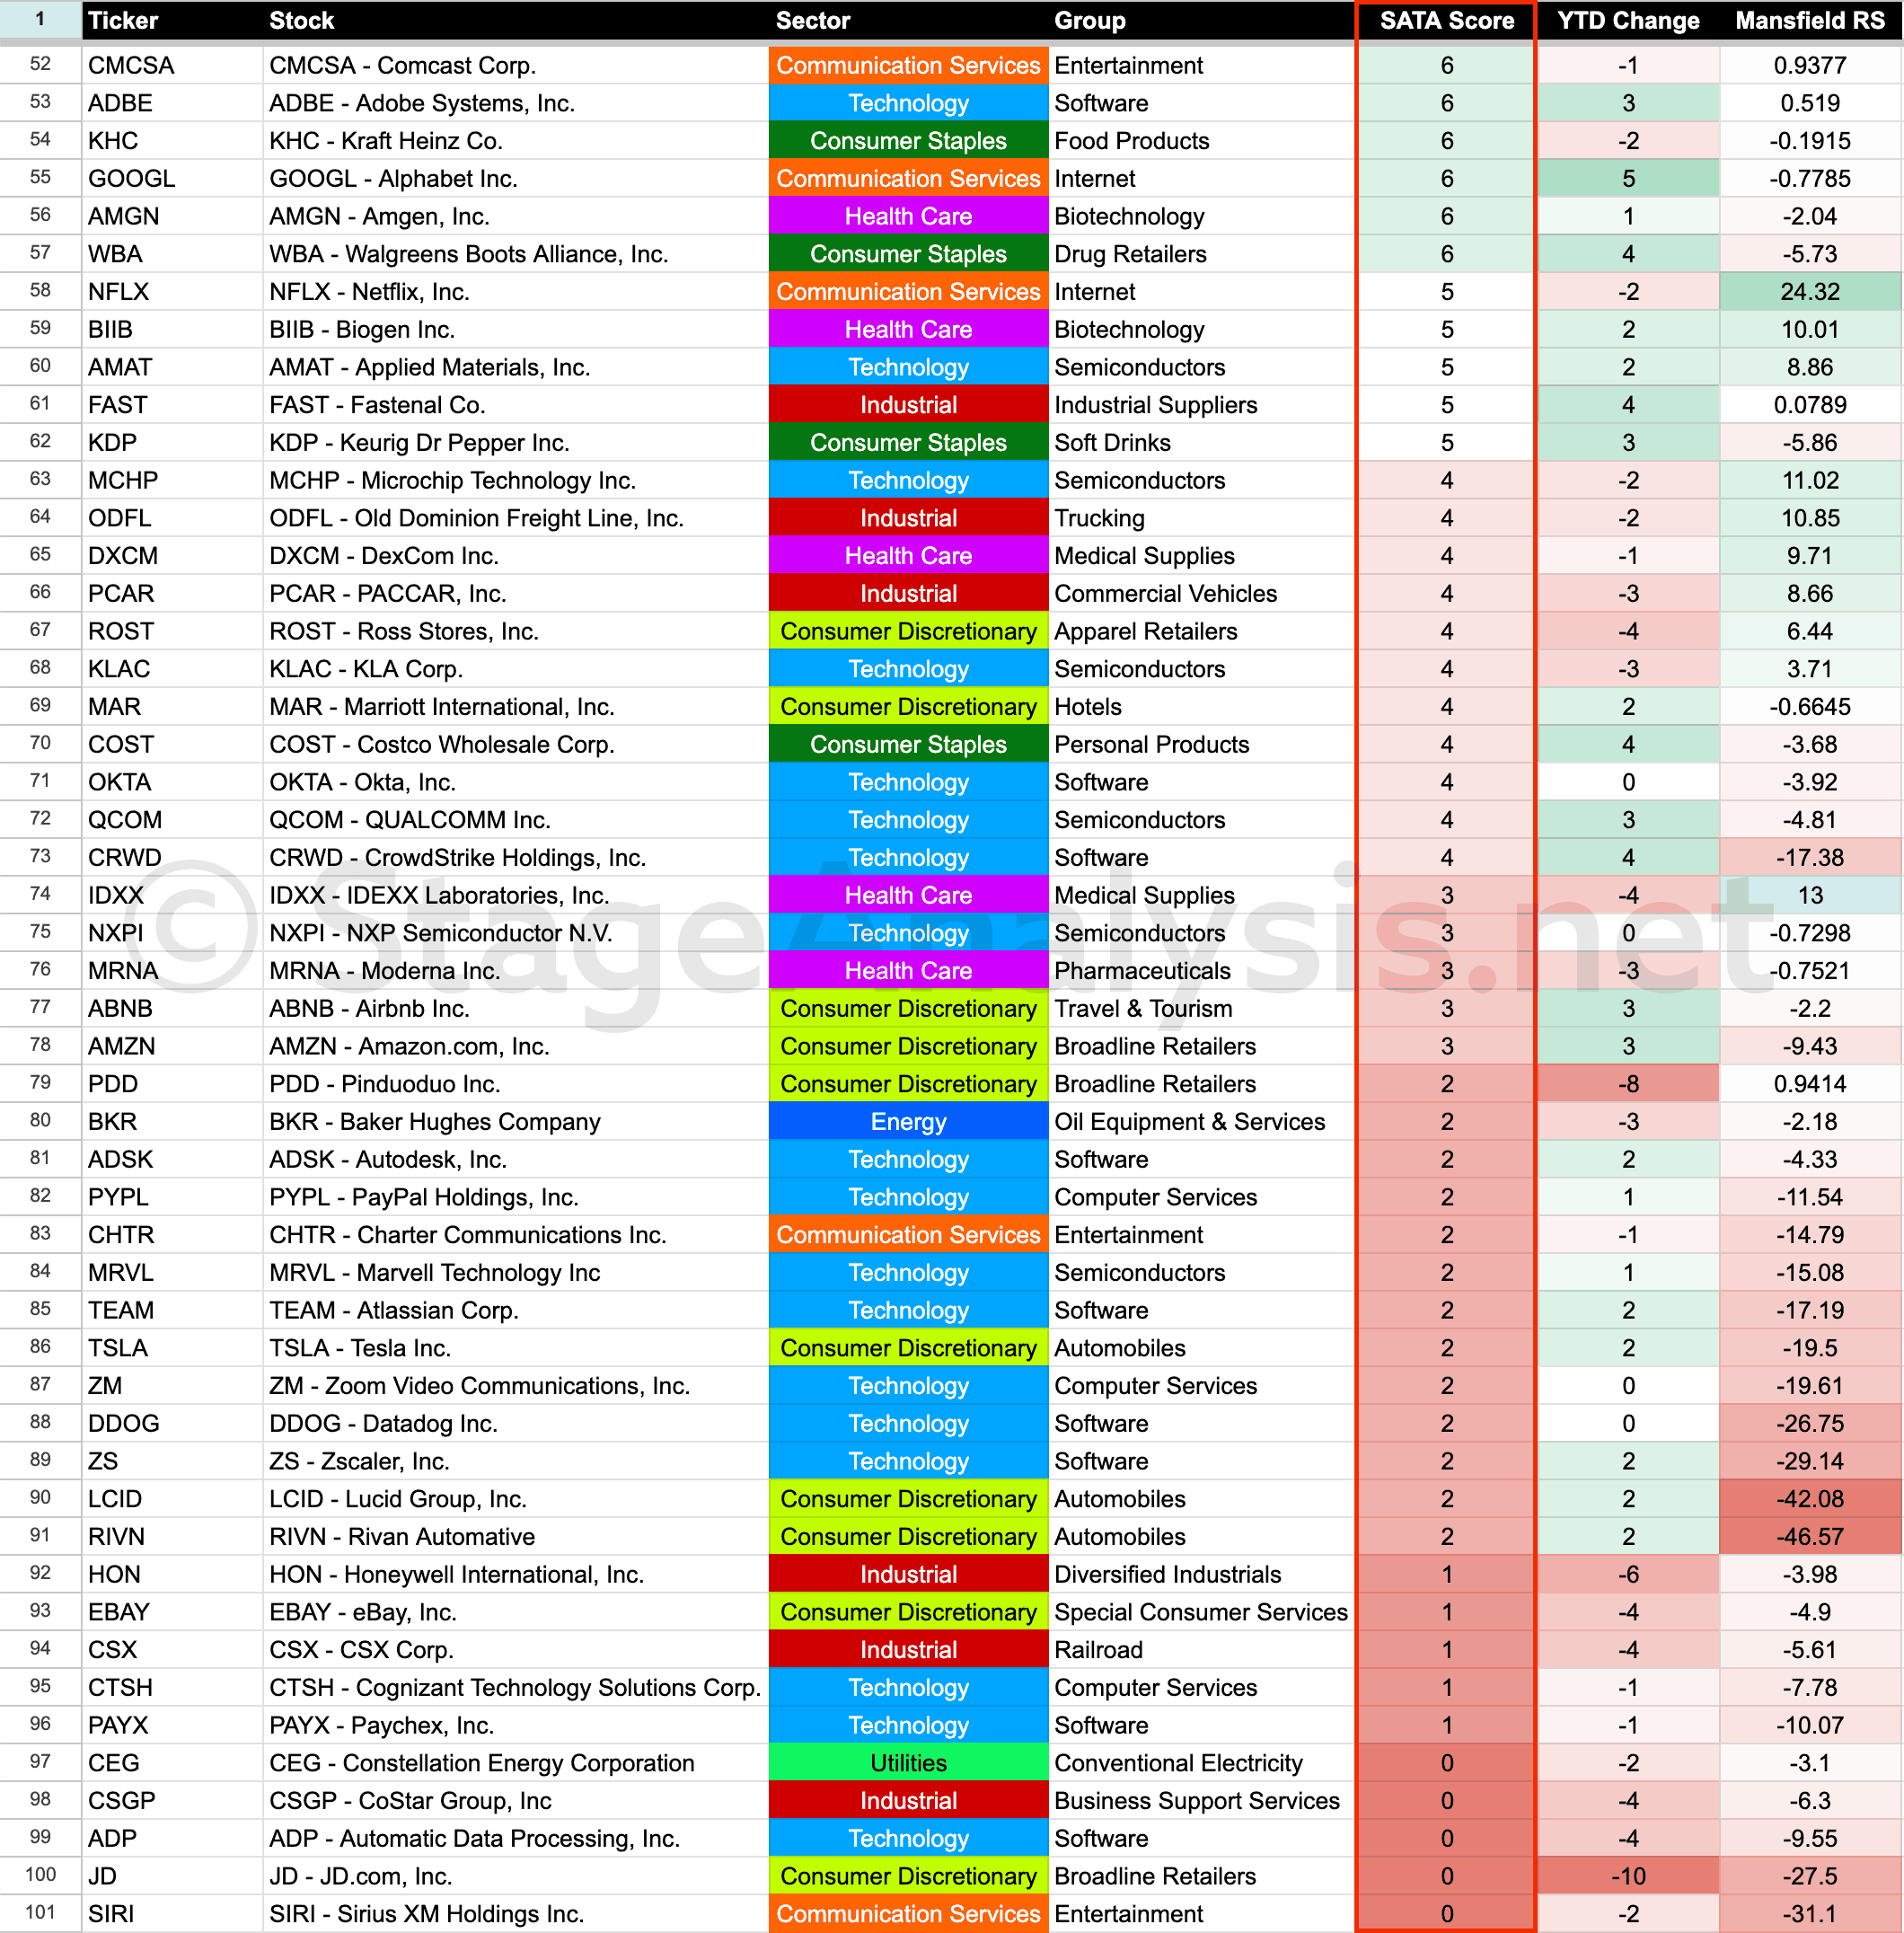
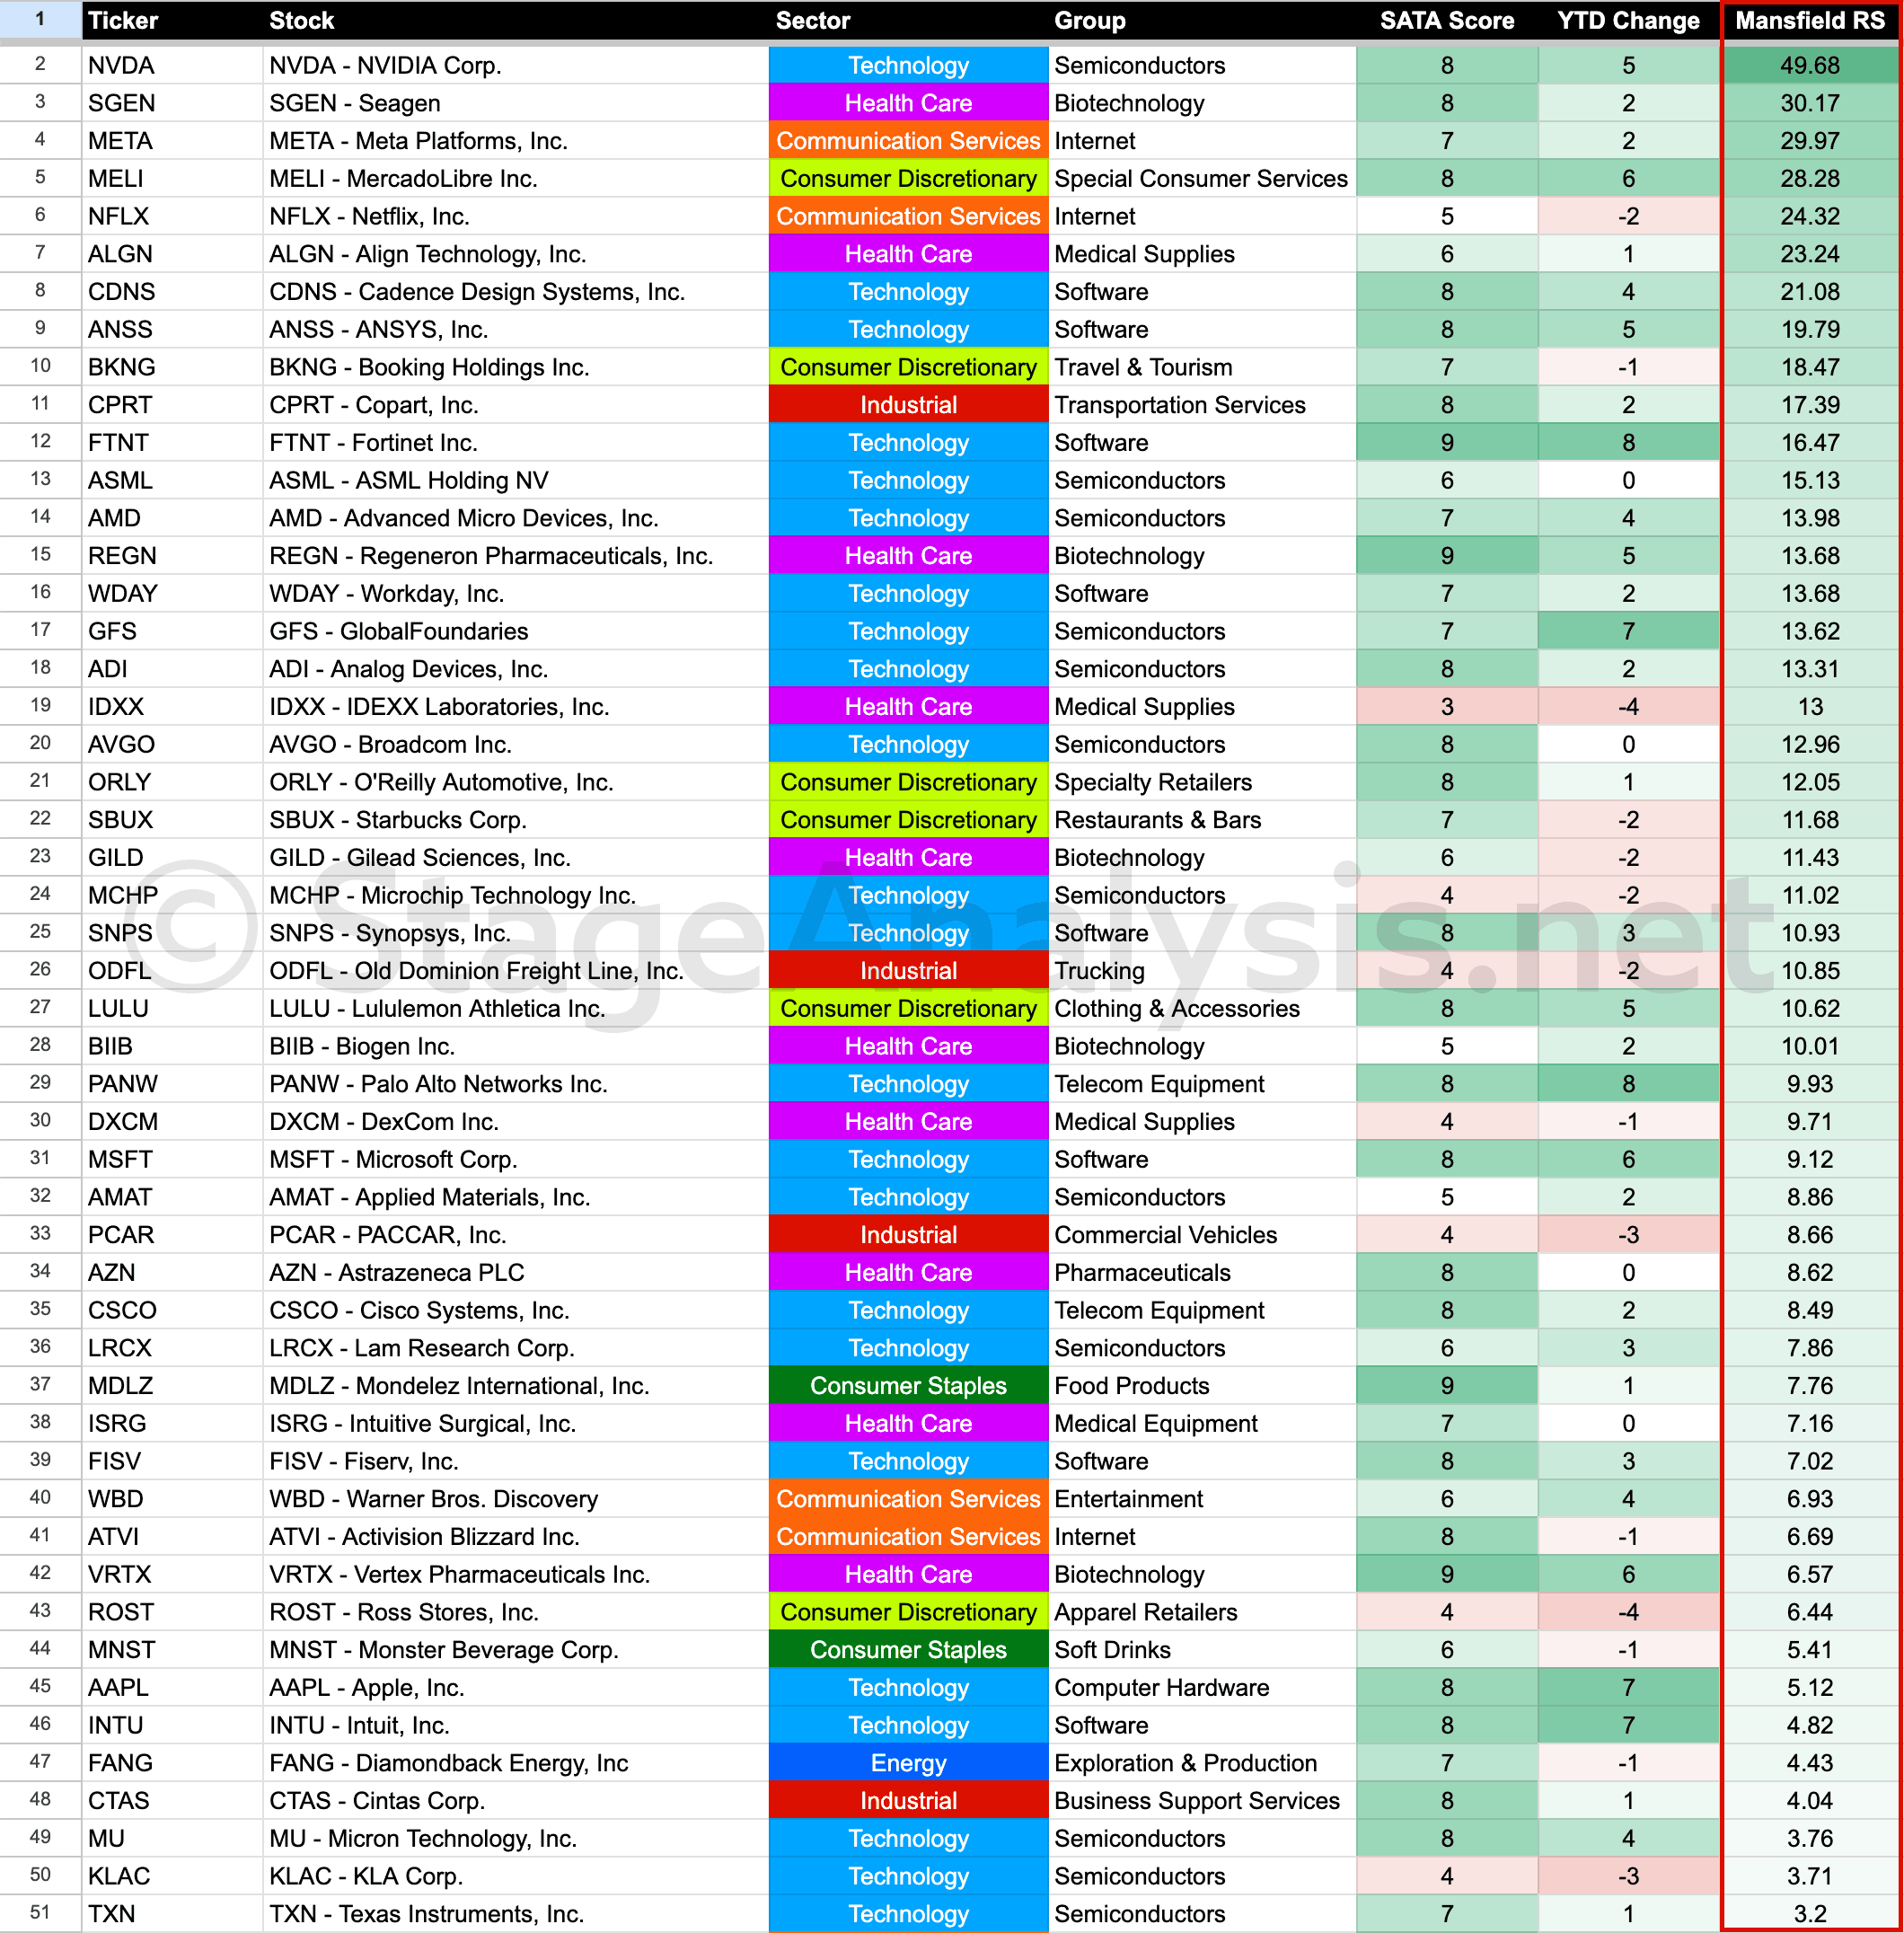
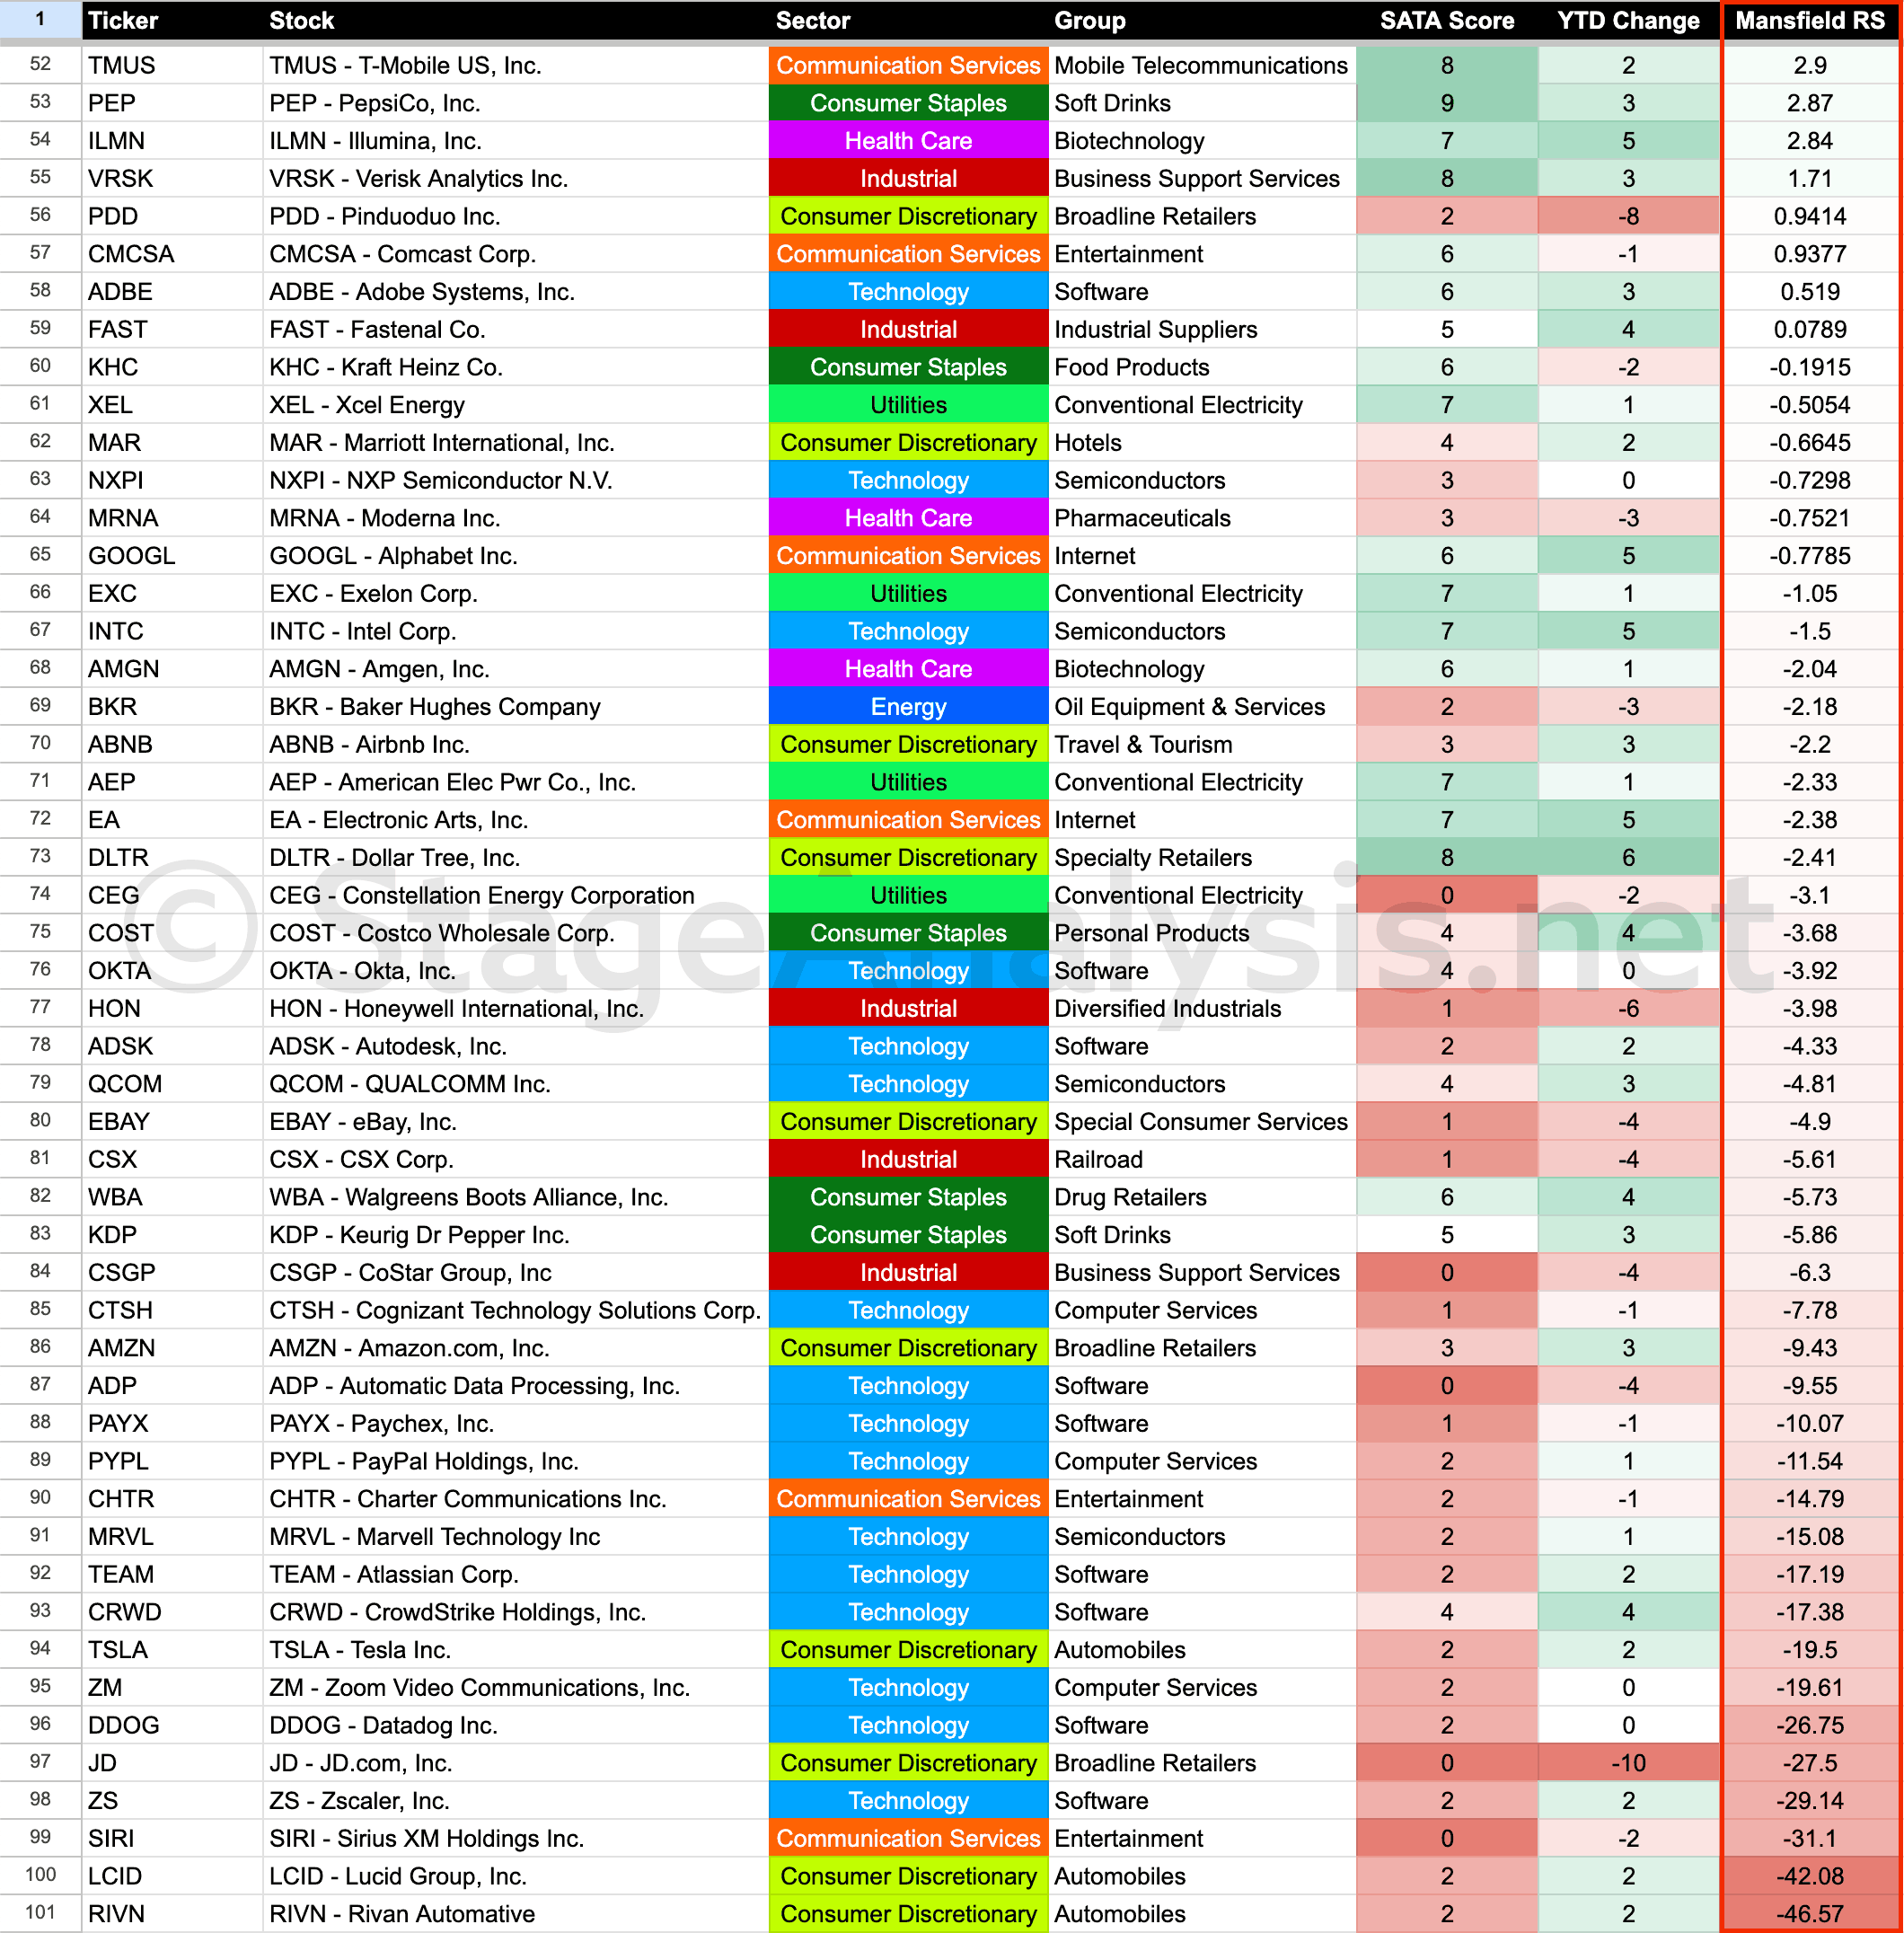
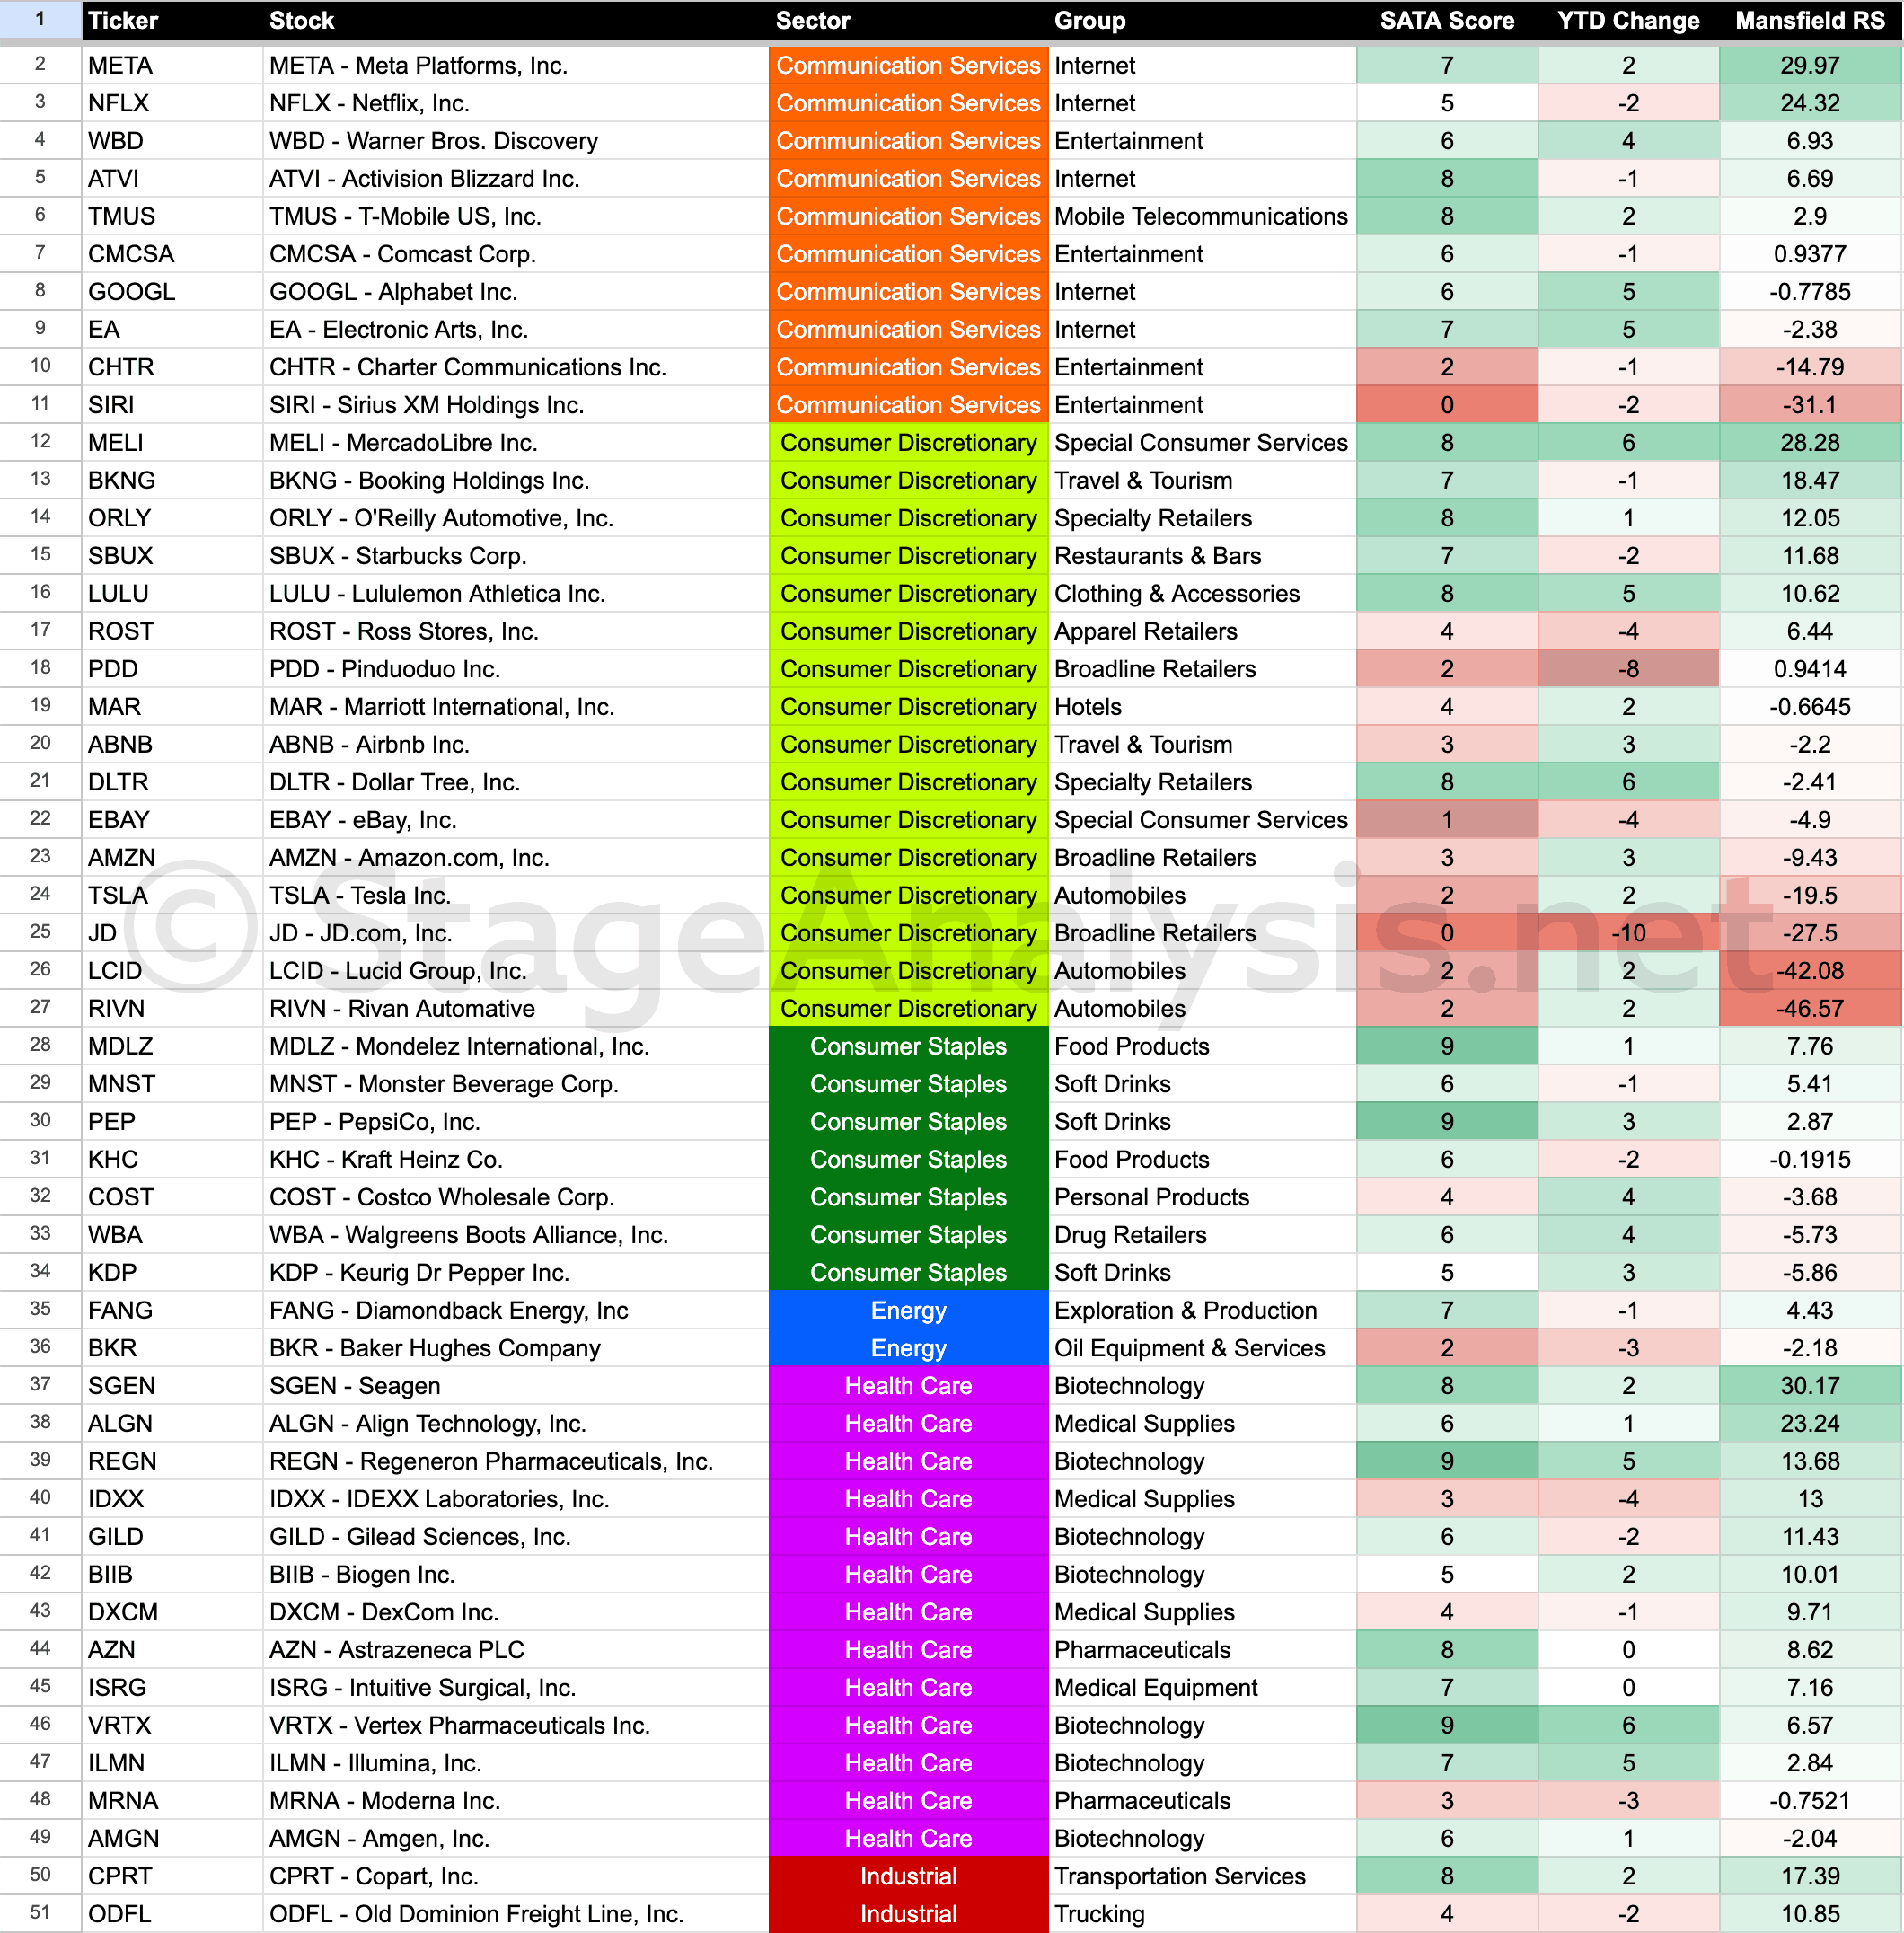
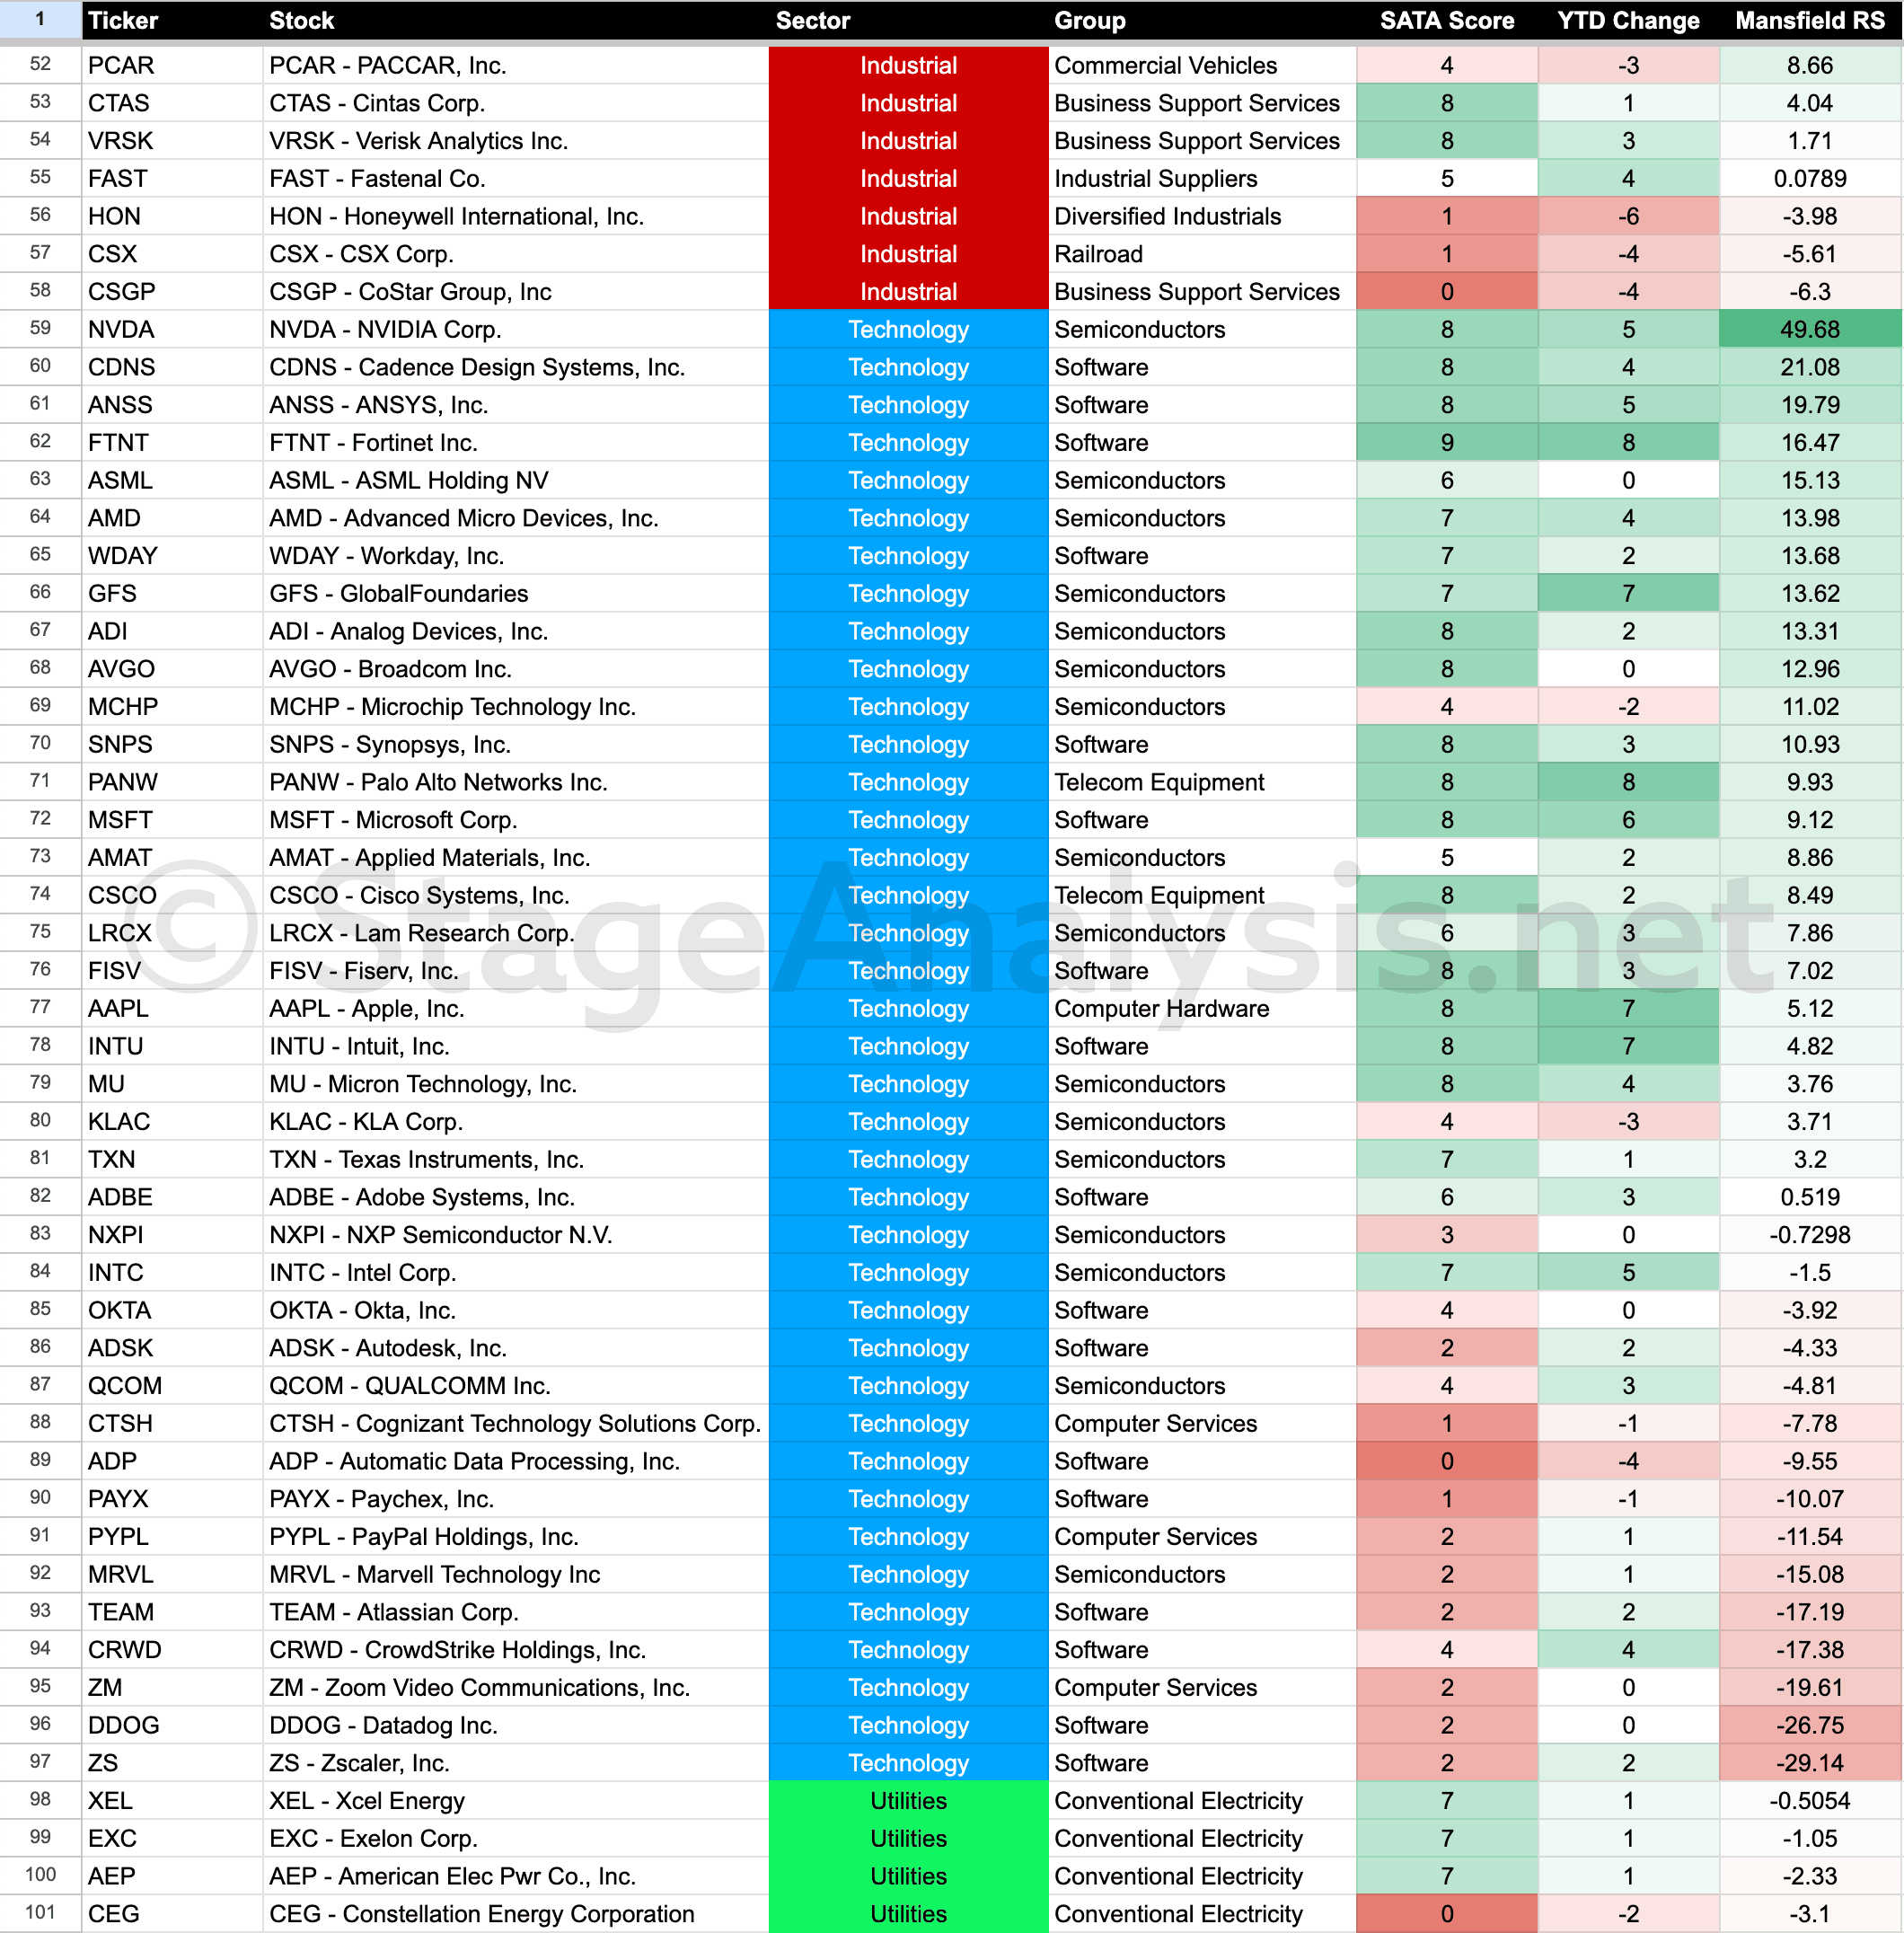
Below is the data tables of the Nasdaq 100 stocks in order of SATA Score, Mansfield Relative Strength, Sector and the position changes year to date.
Ordered by Highest SATA Score
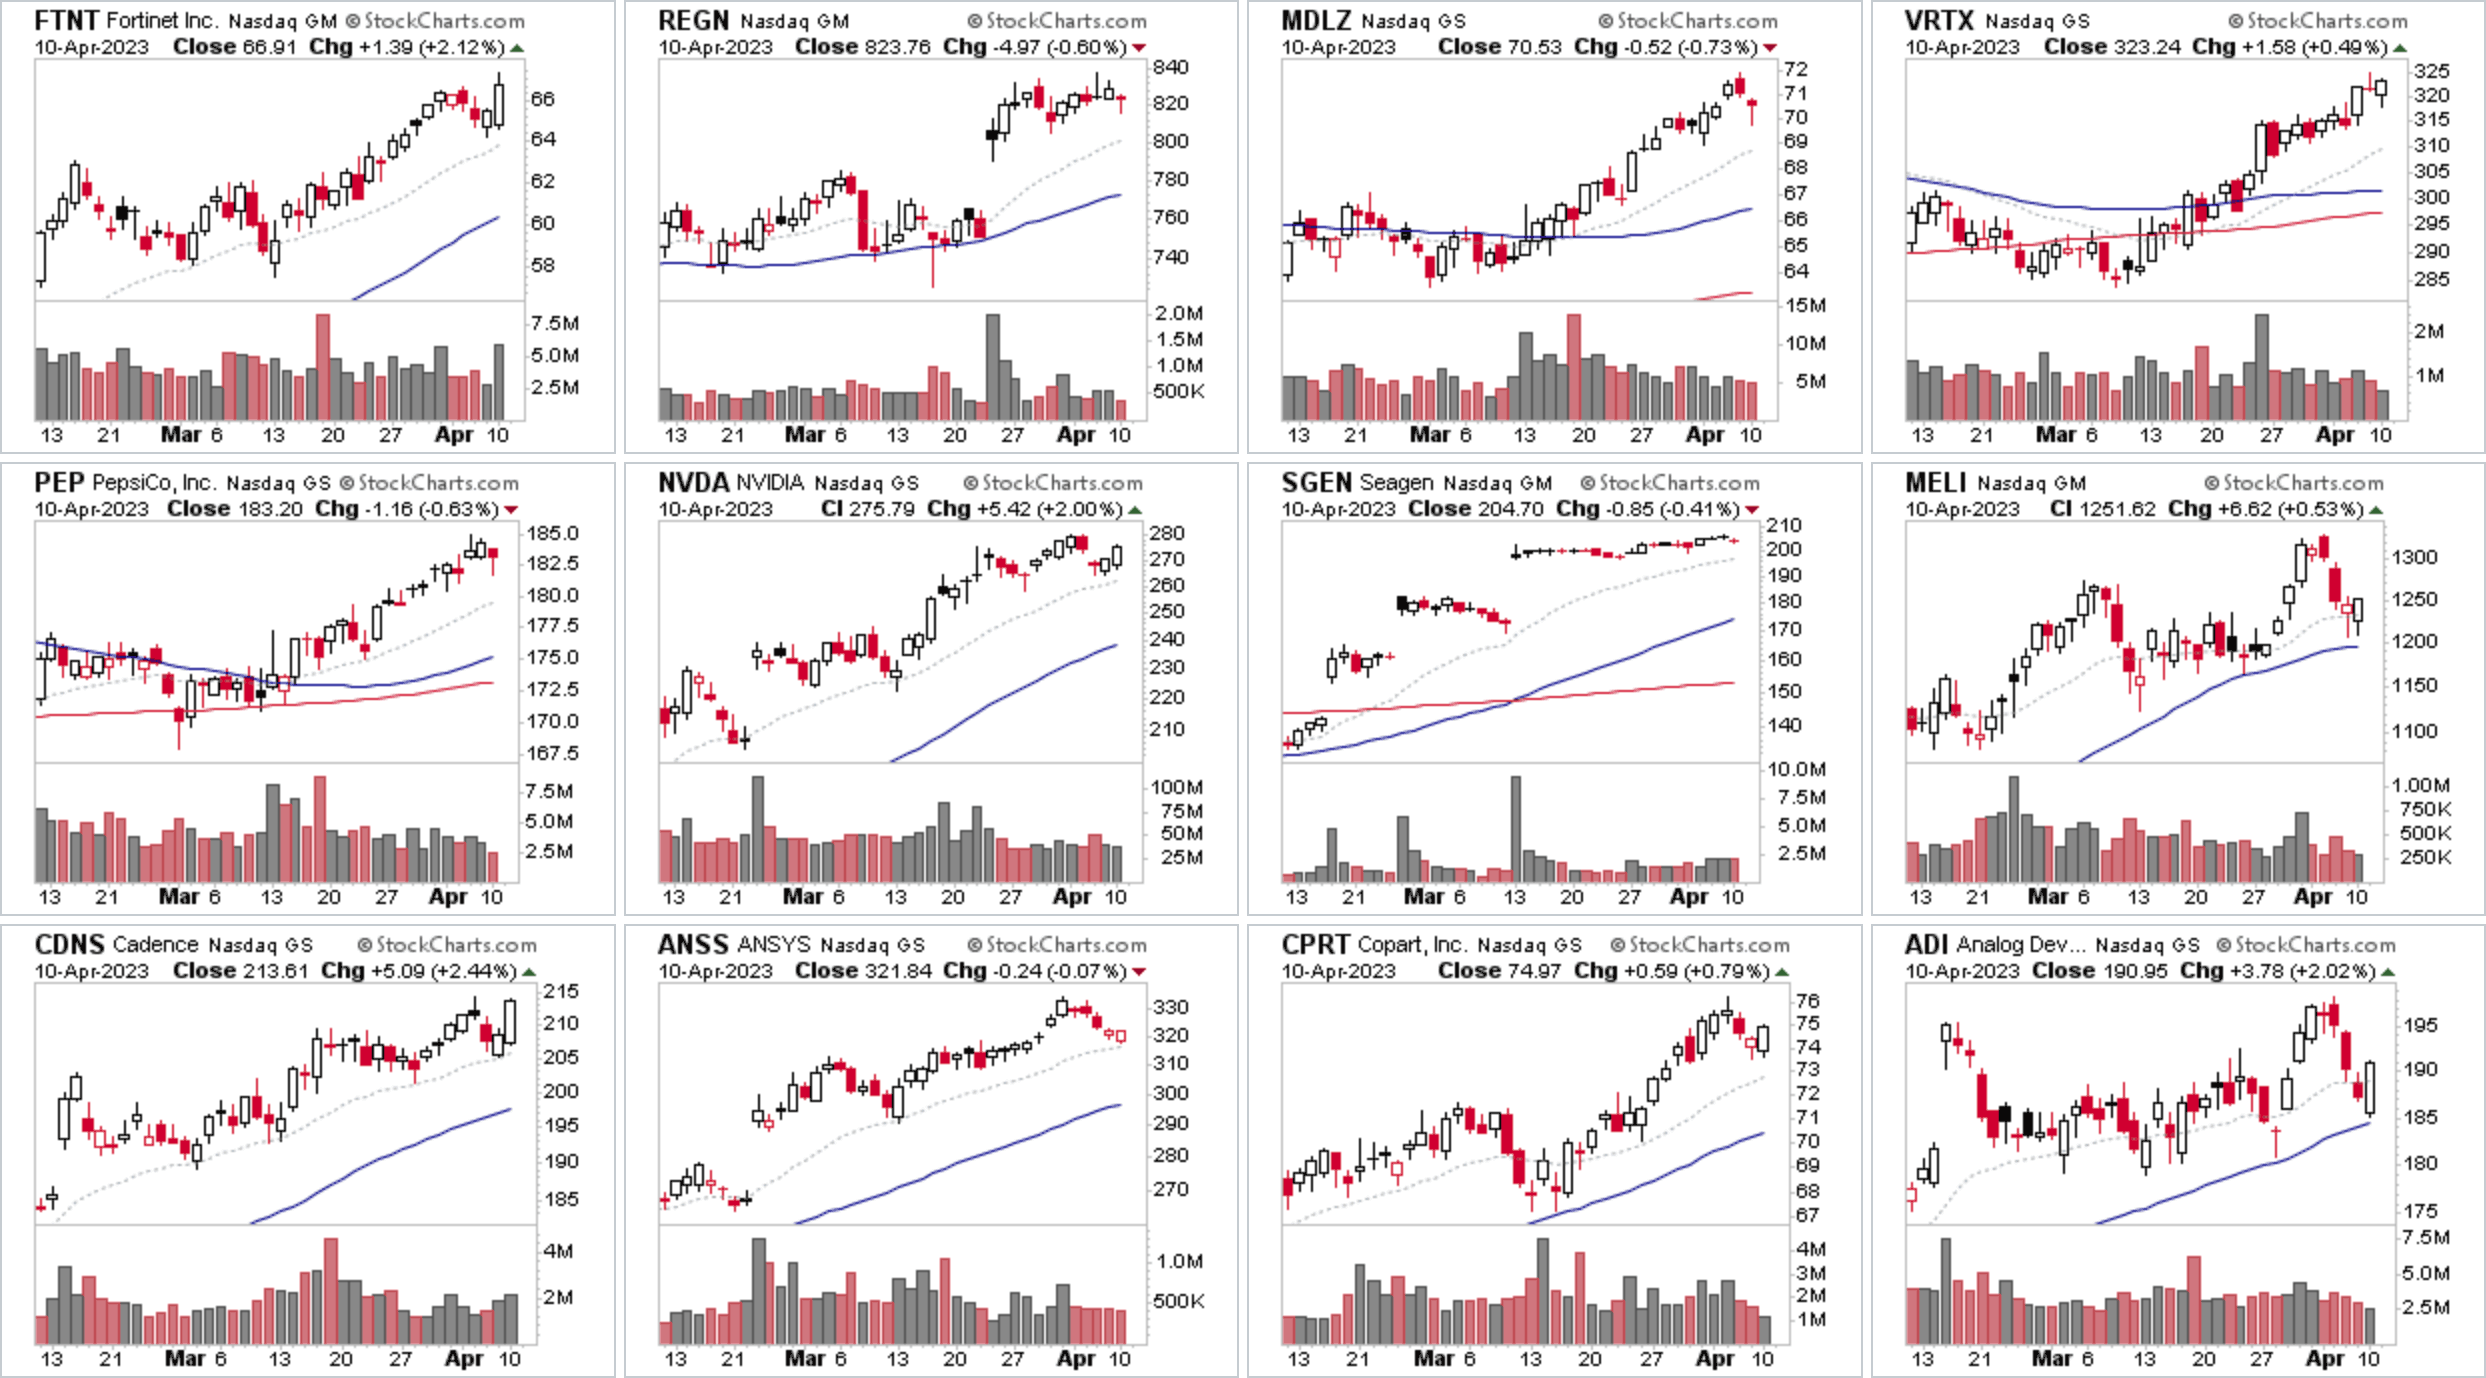
FTNT is the current leader, still fairly early in its Stage 2 advancing phase with a SATA score of 9 and strongest Mansfield Relative Strength of the SATA 9 stocks. NVDA which was the leader in mid March when I covered the group last, still leads on a purely RS basis, but has dropped slightly to 6th overall with a SATA score of 8, as it consolidates in Phase B of a small base structure, one quarter into it's Stage 2 advancing phase, and so would now just be considered in Stage 2, as it's no longer early in the Stage.
Ordered by Mansfield Relative Strength (RS) Score
Ordered by Sectors
Coming Soon – SATA Scores on the Website
As I mentioned in the previous post. We've been working hard since the start of the year developing a new tool, so that we can hopefully make the SATA scores available for the whole US market on the website, and potentially other markets too. Which will give Stage Analysis members the ability to see the SATA score changes on a daily basis and then make use of that information.
There's multiple ways that this data could be useful on both the long and short side of the market and also as market breadth data and charts. So we are excited to get it up and running on the website soon. So stay tuned for more info in the near future.
Become a Stage Analysis Member:
To see more like this – US Stocks watchlist posts, detailed videos each weekend, use our unique Stage Analysis tools, such as the US Stocks & ETFs Screener, Charts, Market Breadth, Group Relative Strength and more...
Join Today
Disclaimer: For educational purpose only. Not investment advice. Seek professional advice from a financial advisor before making any investing decisions.