
Stage Analysis Technical Attributes Scores – Nasdaq 100
The Stage Analysis Technical Attributes (SATA) score is our proprietary indicator that helps to identify the four stages from Stan Weinstein's Stage Analysis method, using a scoring system from 0 to 10 that rates ten of the key technical characteristics that we look for when analysing the weekly charts.
We last covered the weekly SATA scores for the Nasdaq 100 back in early January, which gives a rough guide of the Stages of the individual stocks within the Nasdaq 100. i.e. everything above a 7 would be considered in the Stage 2 zone (Positive), 4-6 in the Stage 1 or Stage 3 zone (Neutral), and 3 or below is the Stage 4 zone (Negative).
Currently the Nasdaq 100 consists of:
- 32% Stage 2 zone (Positive)
- 30% Stage 1 or Stage 3 zone (Neutral)
- 38% Stage 4 zone (Negative)
Nasdaq 100 Average SATA Score: 4.59 (Neutral Stage 1 or Stage 3 zone)
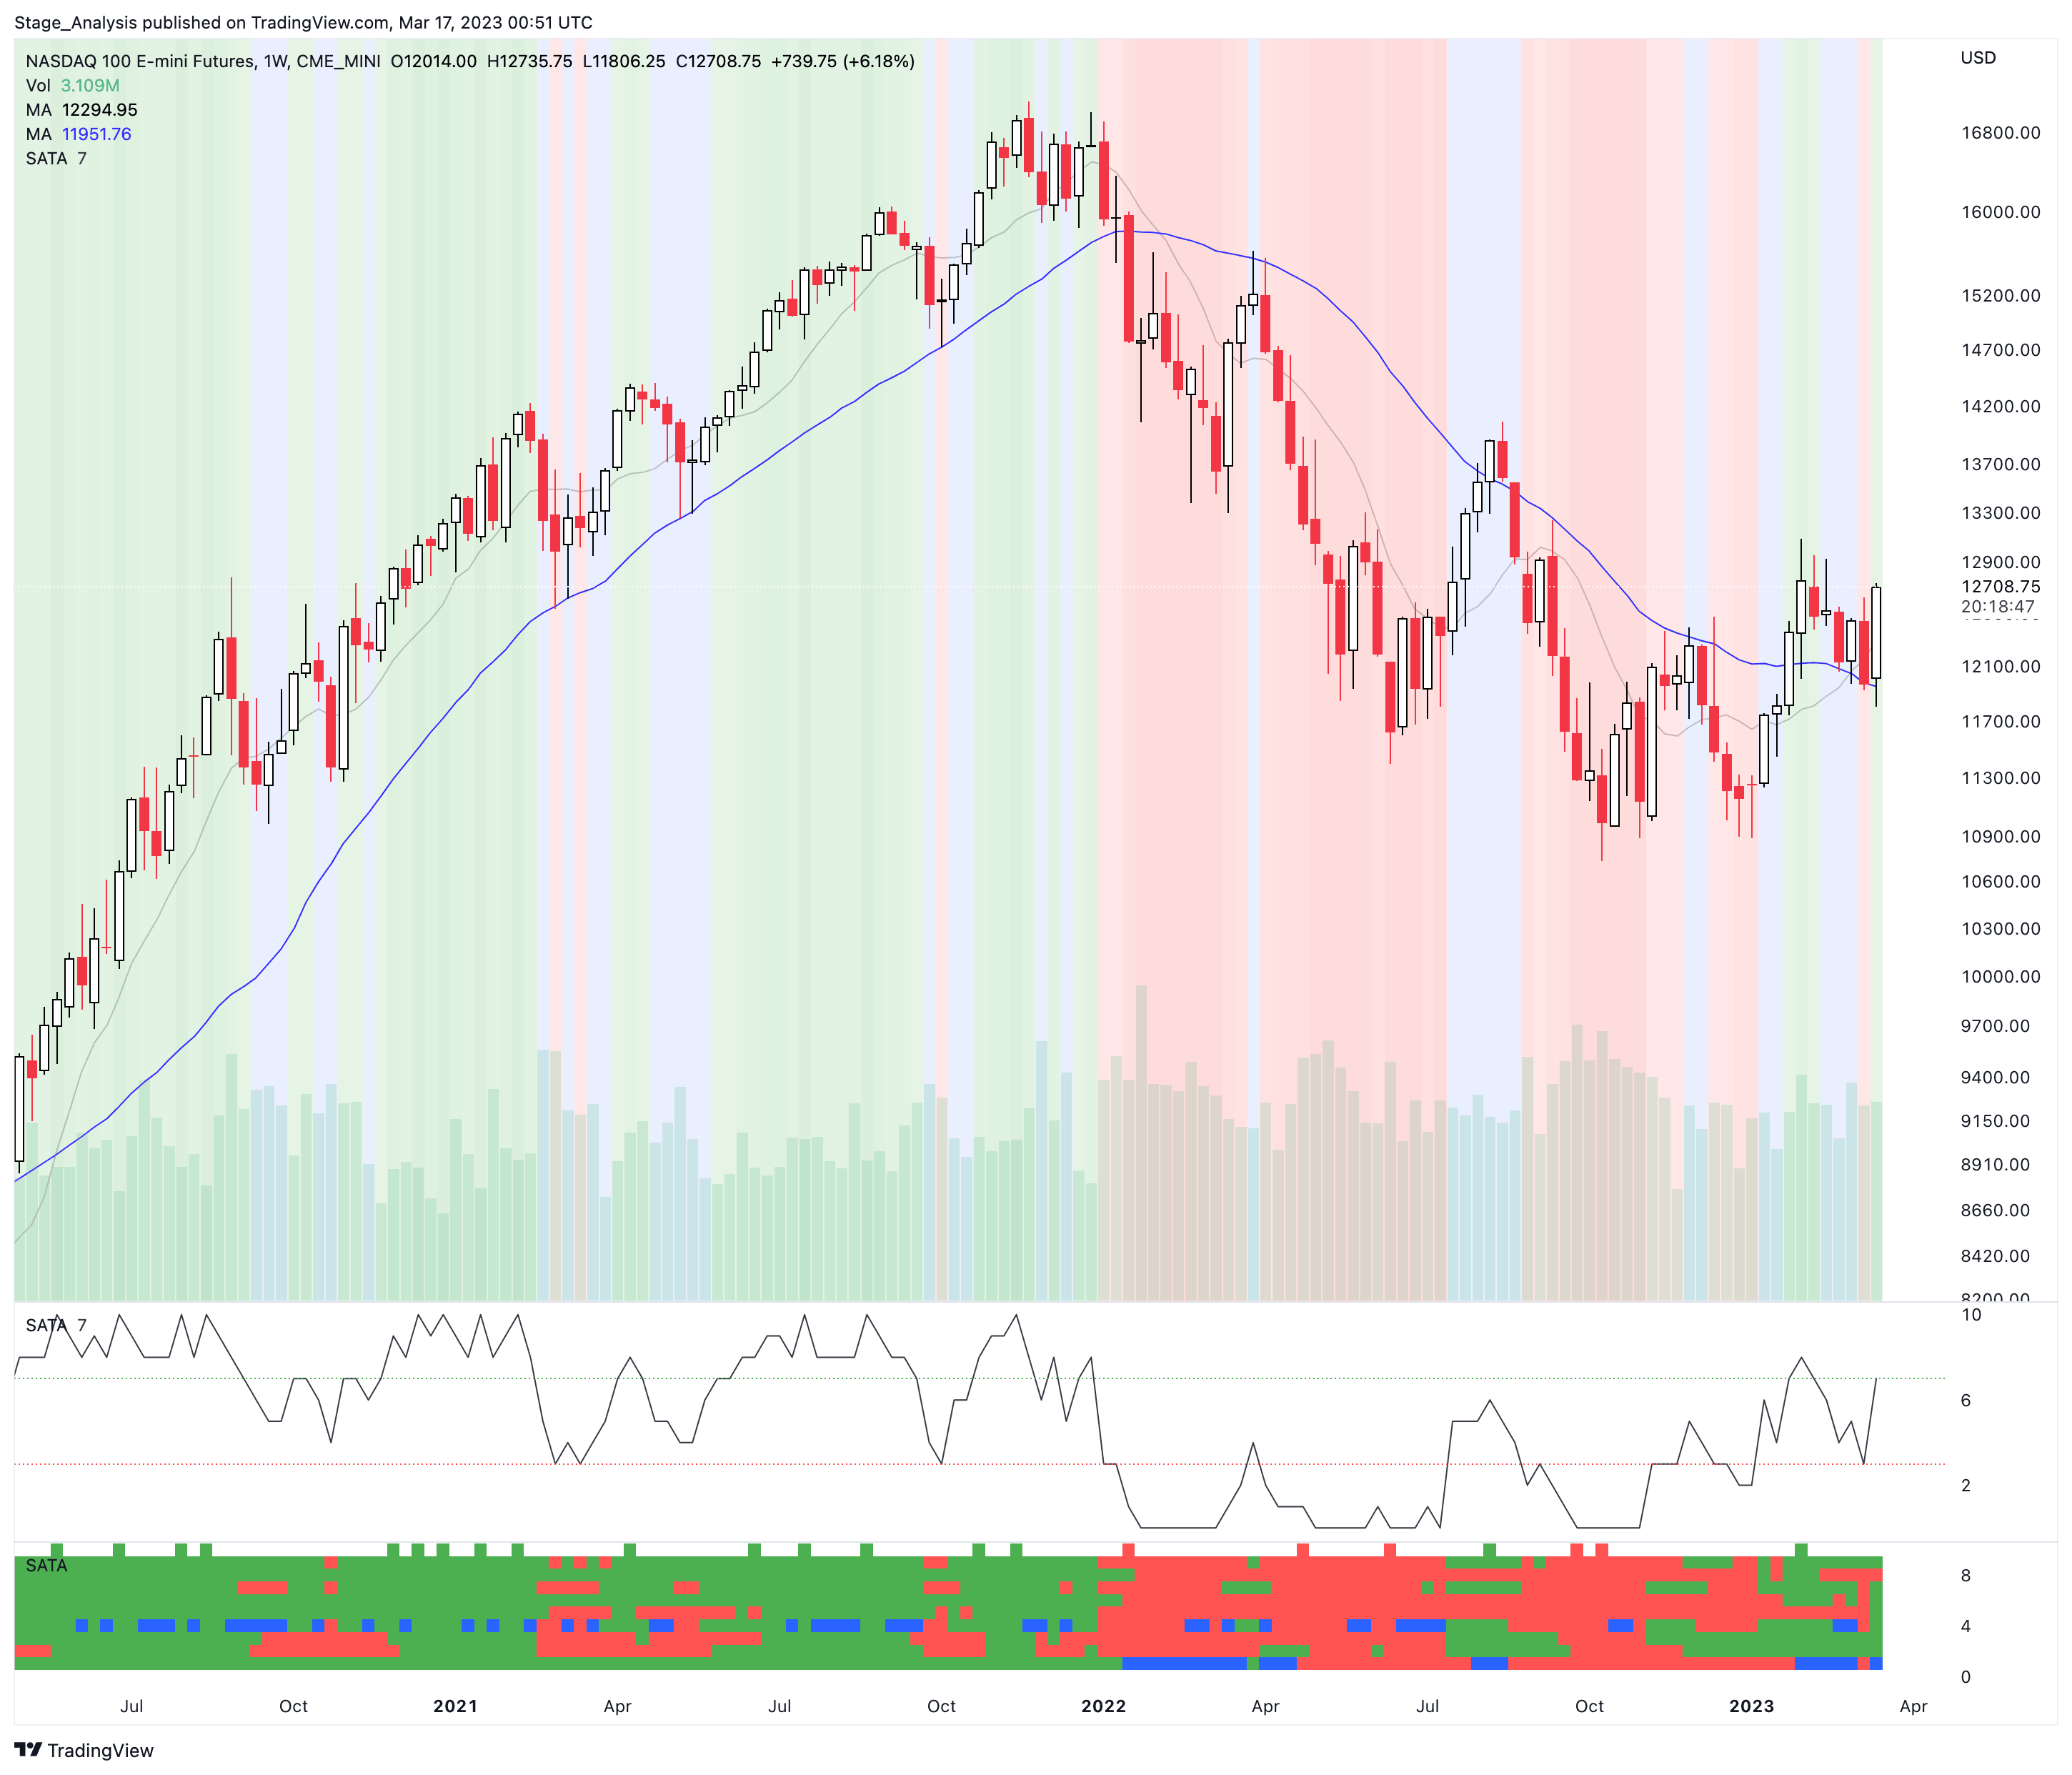
The SATA score has improved by +0.51 since the start of the year, with an average SATA score of 4.59 in the Nasdaq 100 stocks, compared to a SATA score of 7 in the Nasdaq 100 E-mini Futures chart. So the individual stocks score is -2.41 less than the futures.
Compared to the start of the year there are +10% more stocks in the Stage 2 zone, -1% less stocks in the Stage 1 or Stage 3 zone, and -9% less stocks in the Stage 4 zone. But overall it remains fairly even between the three zones, holding a neutral position.
So there has been modest improvement since the start of the year, with the overall average SATA score improving slightly within the neutral Stage 1 range.
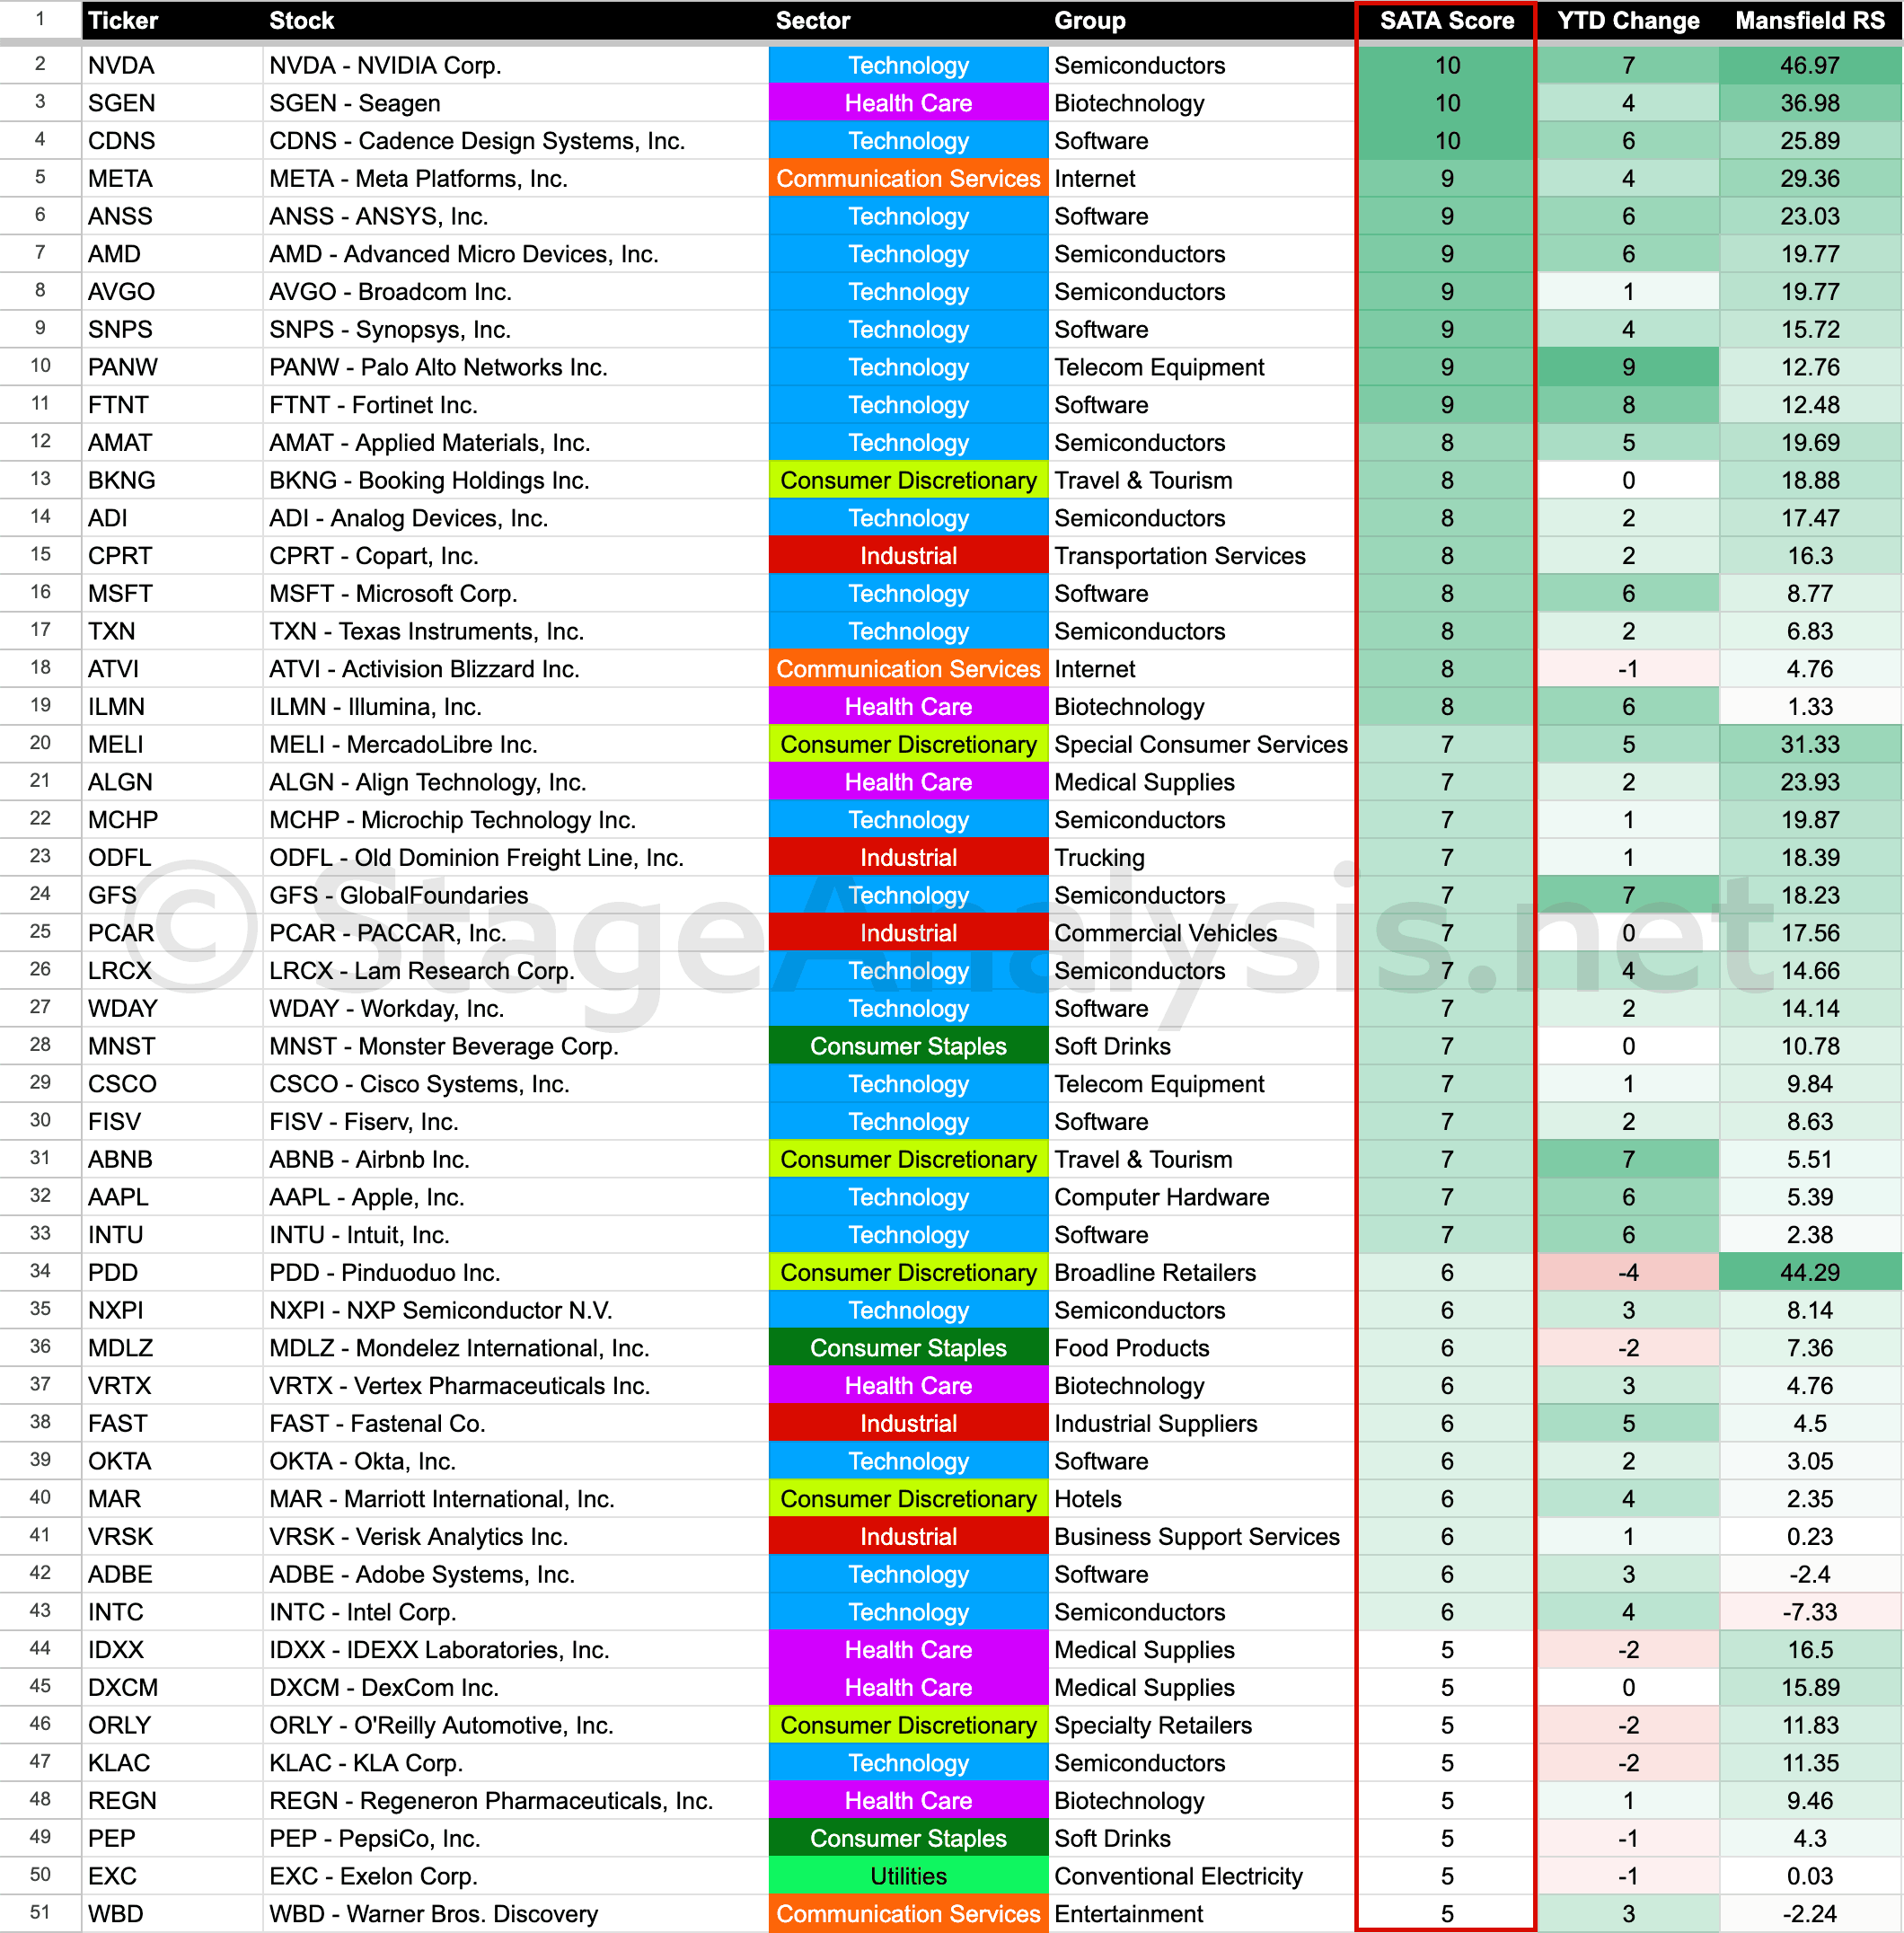
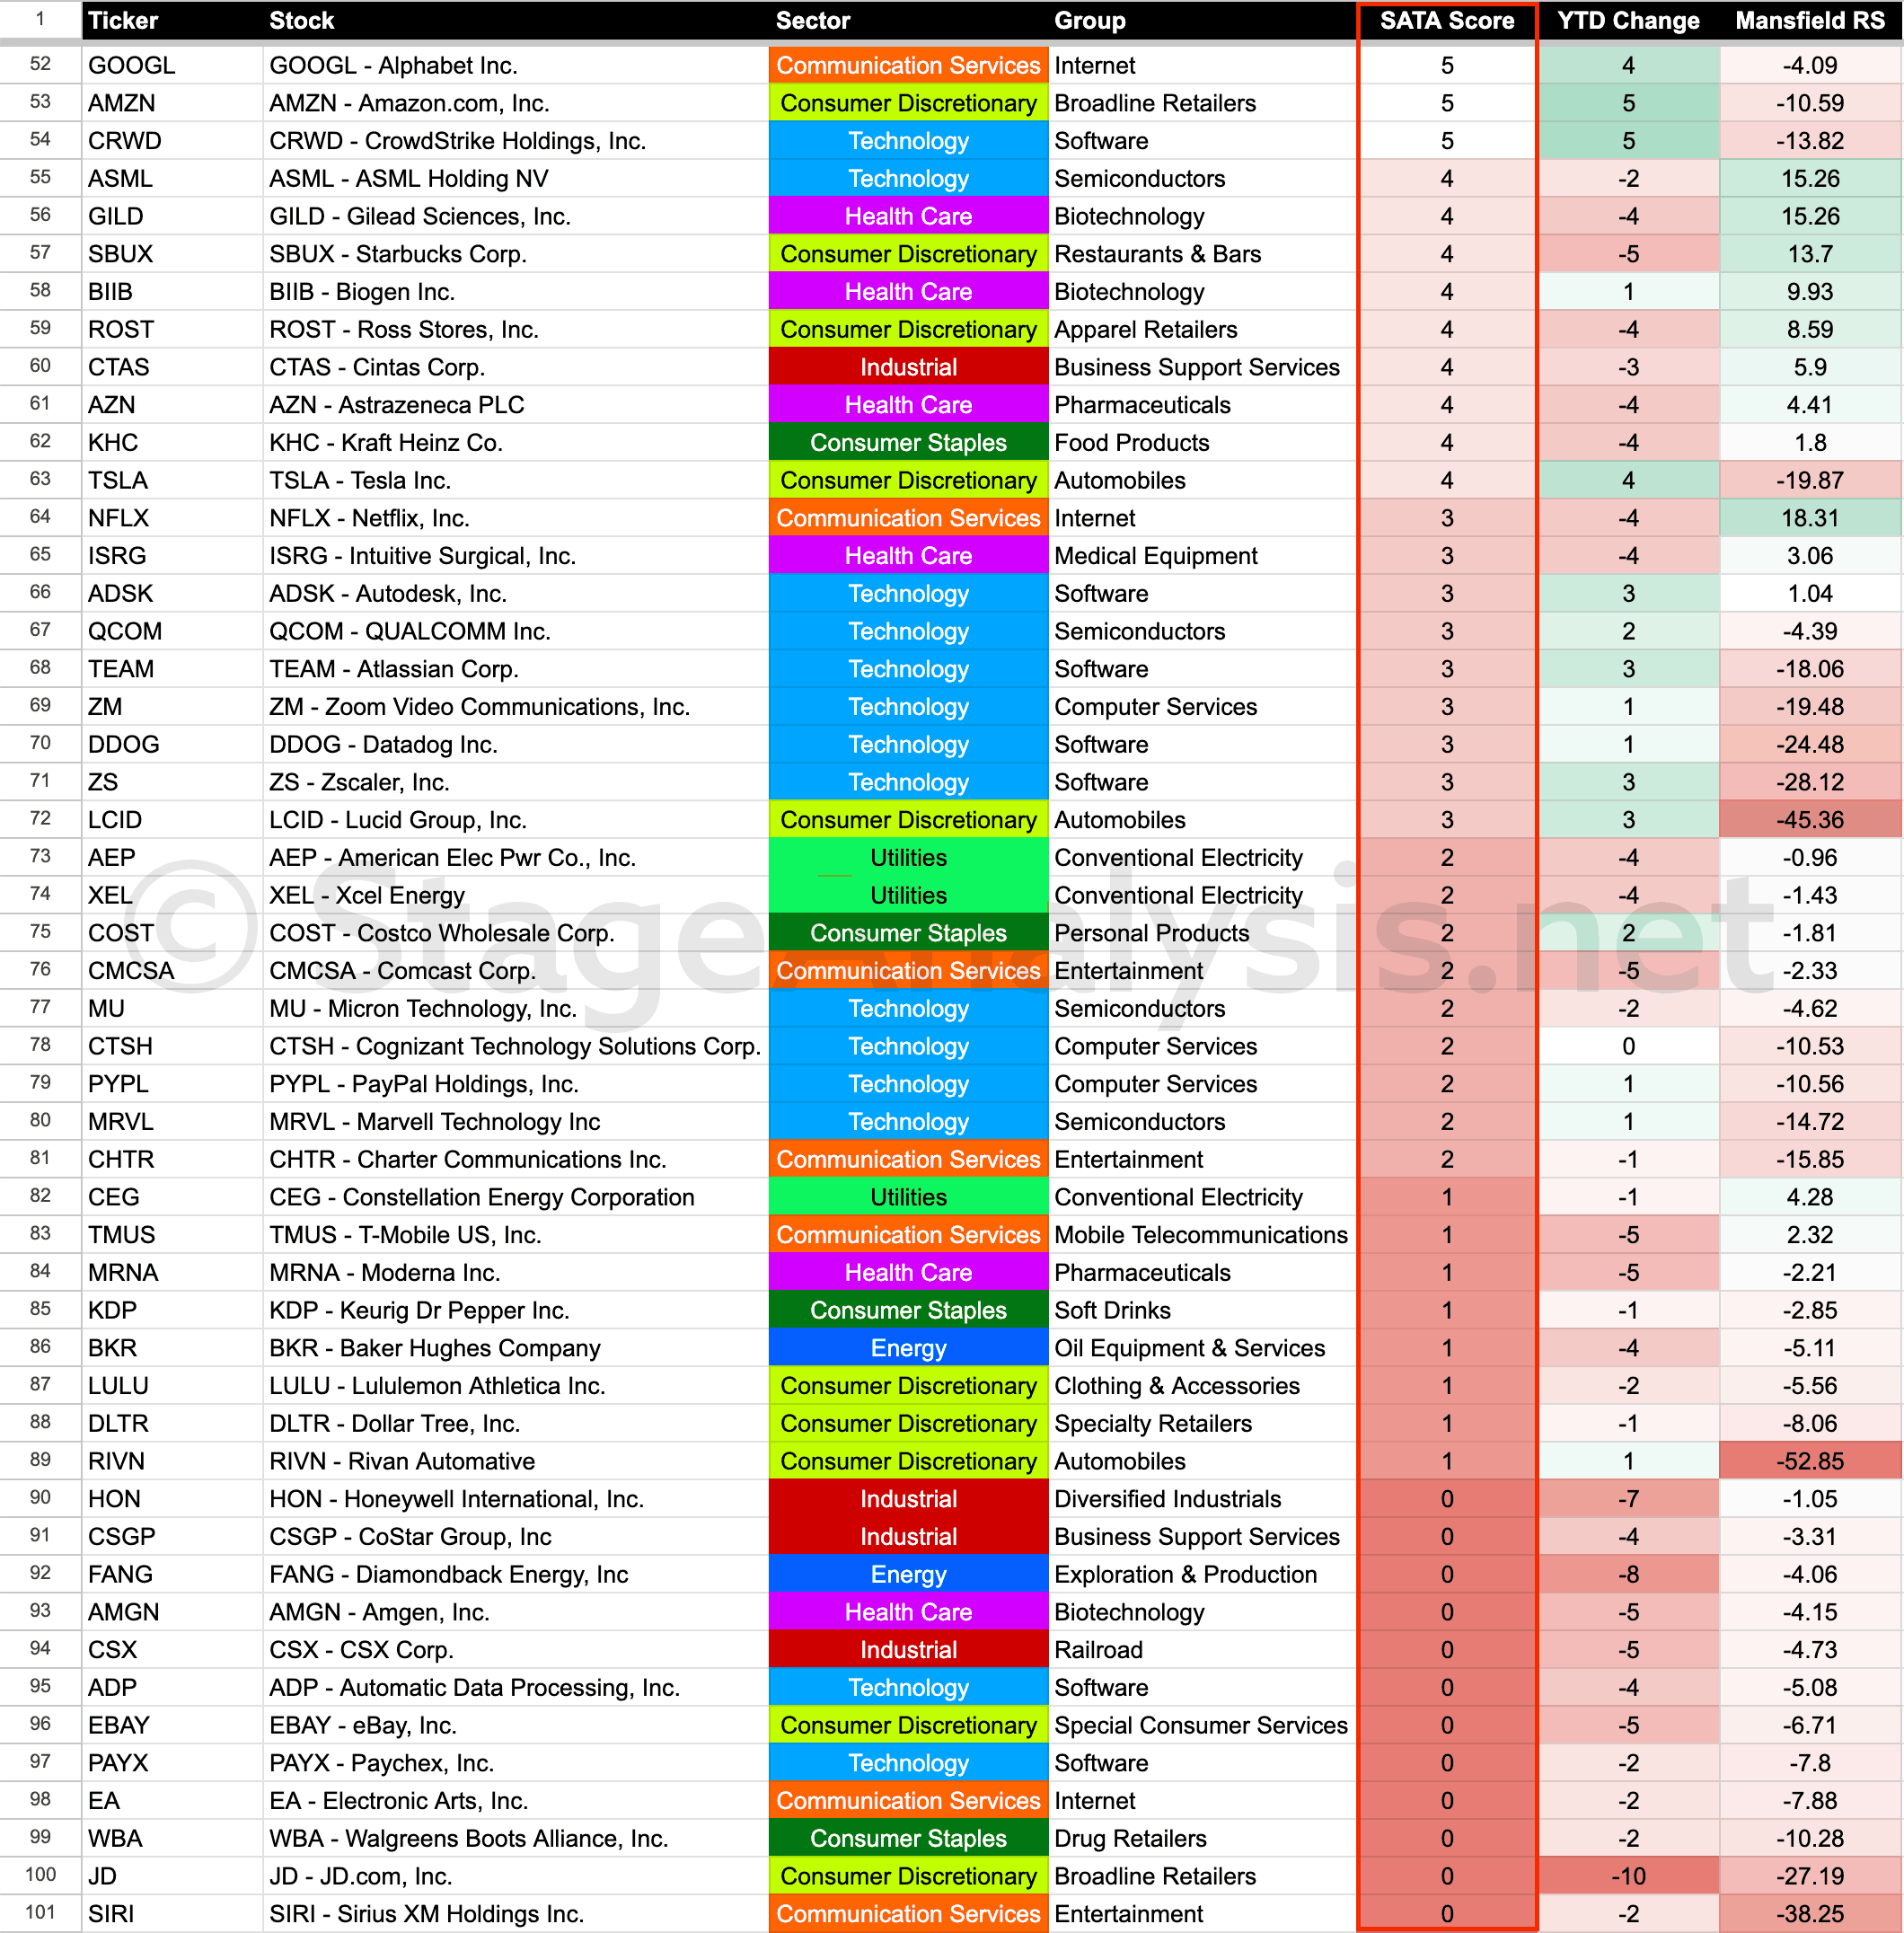
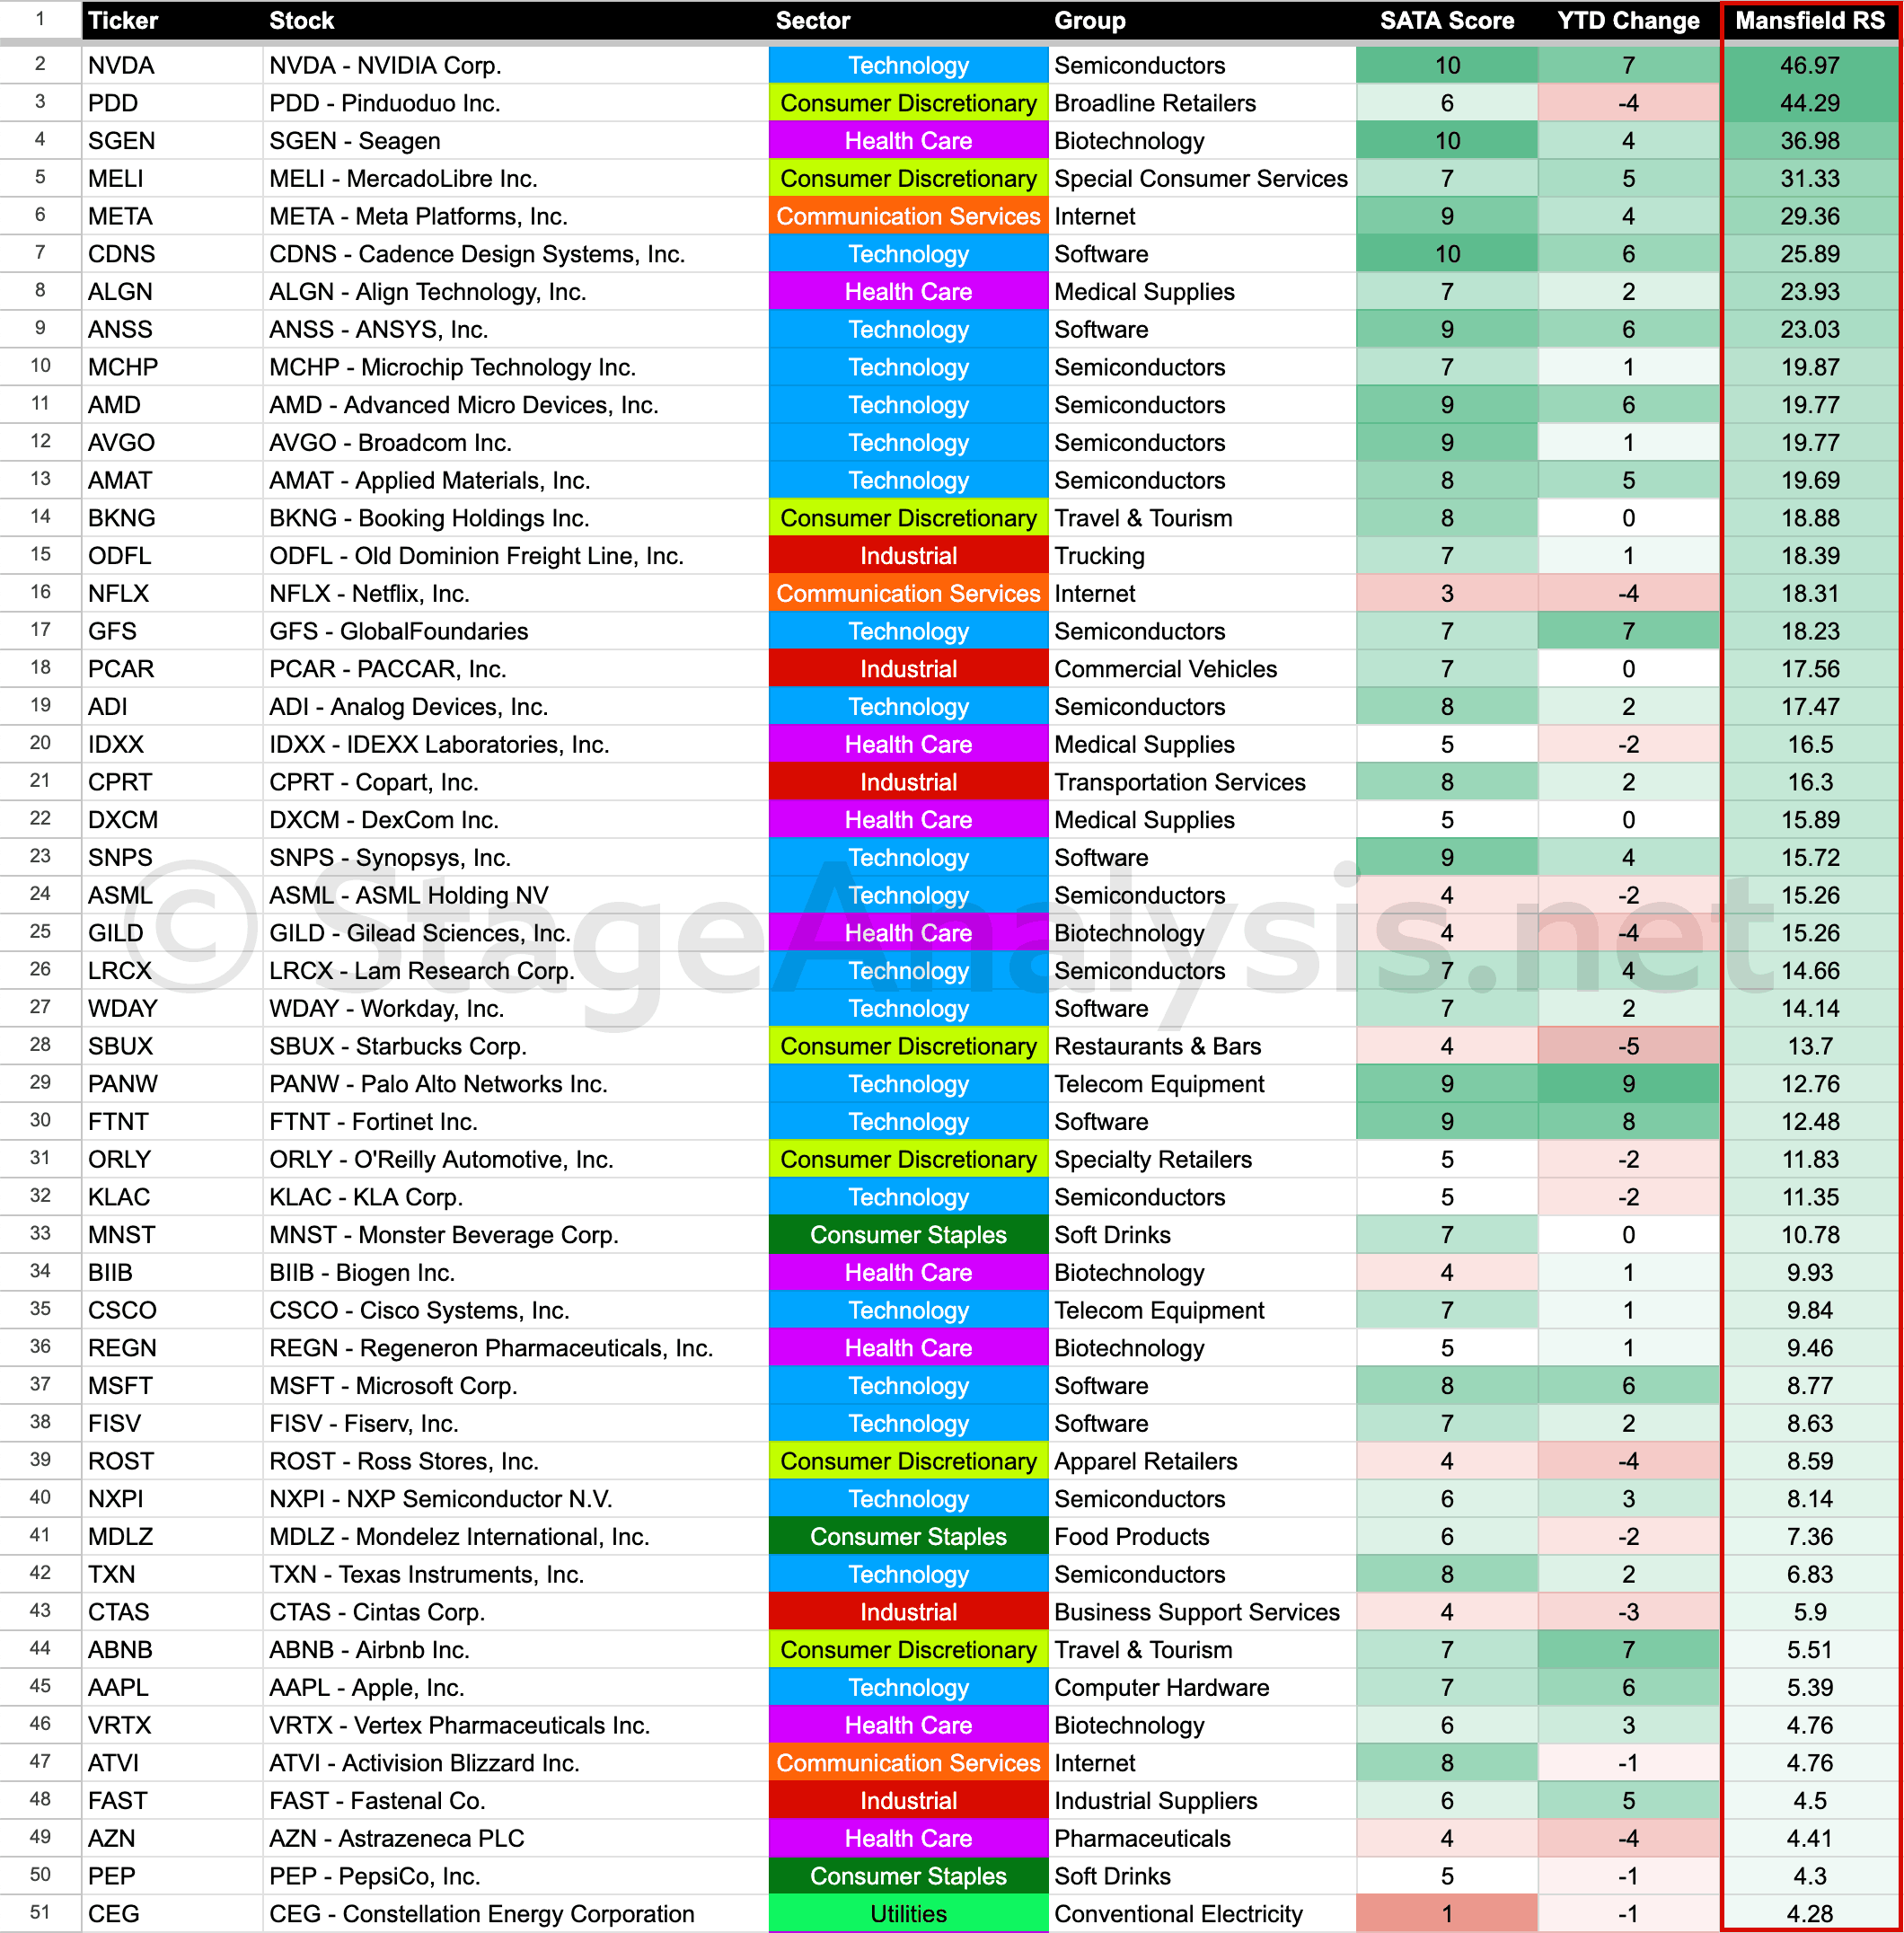
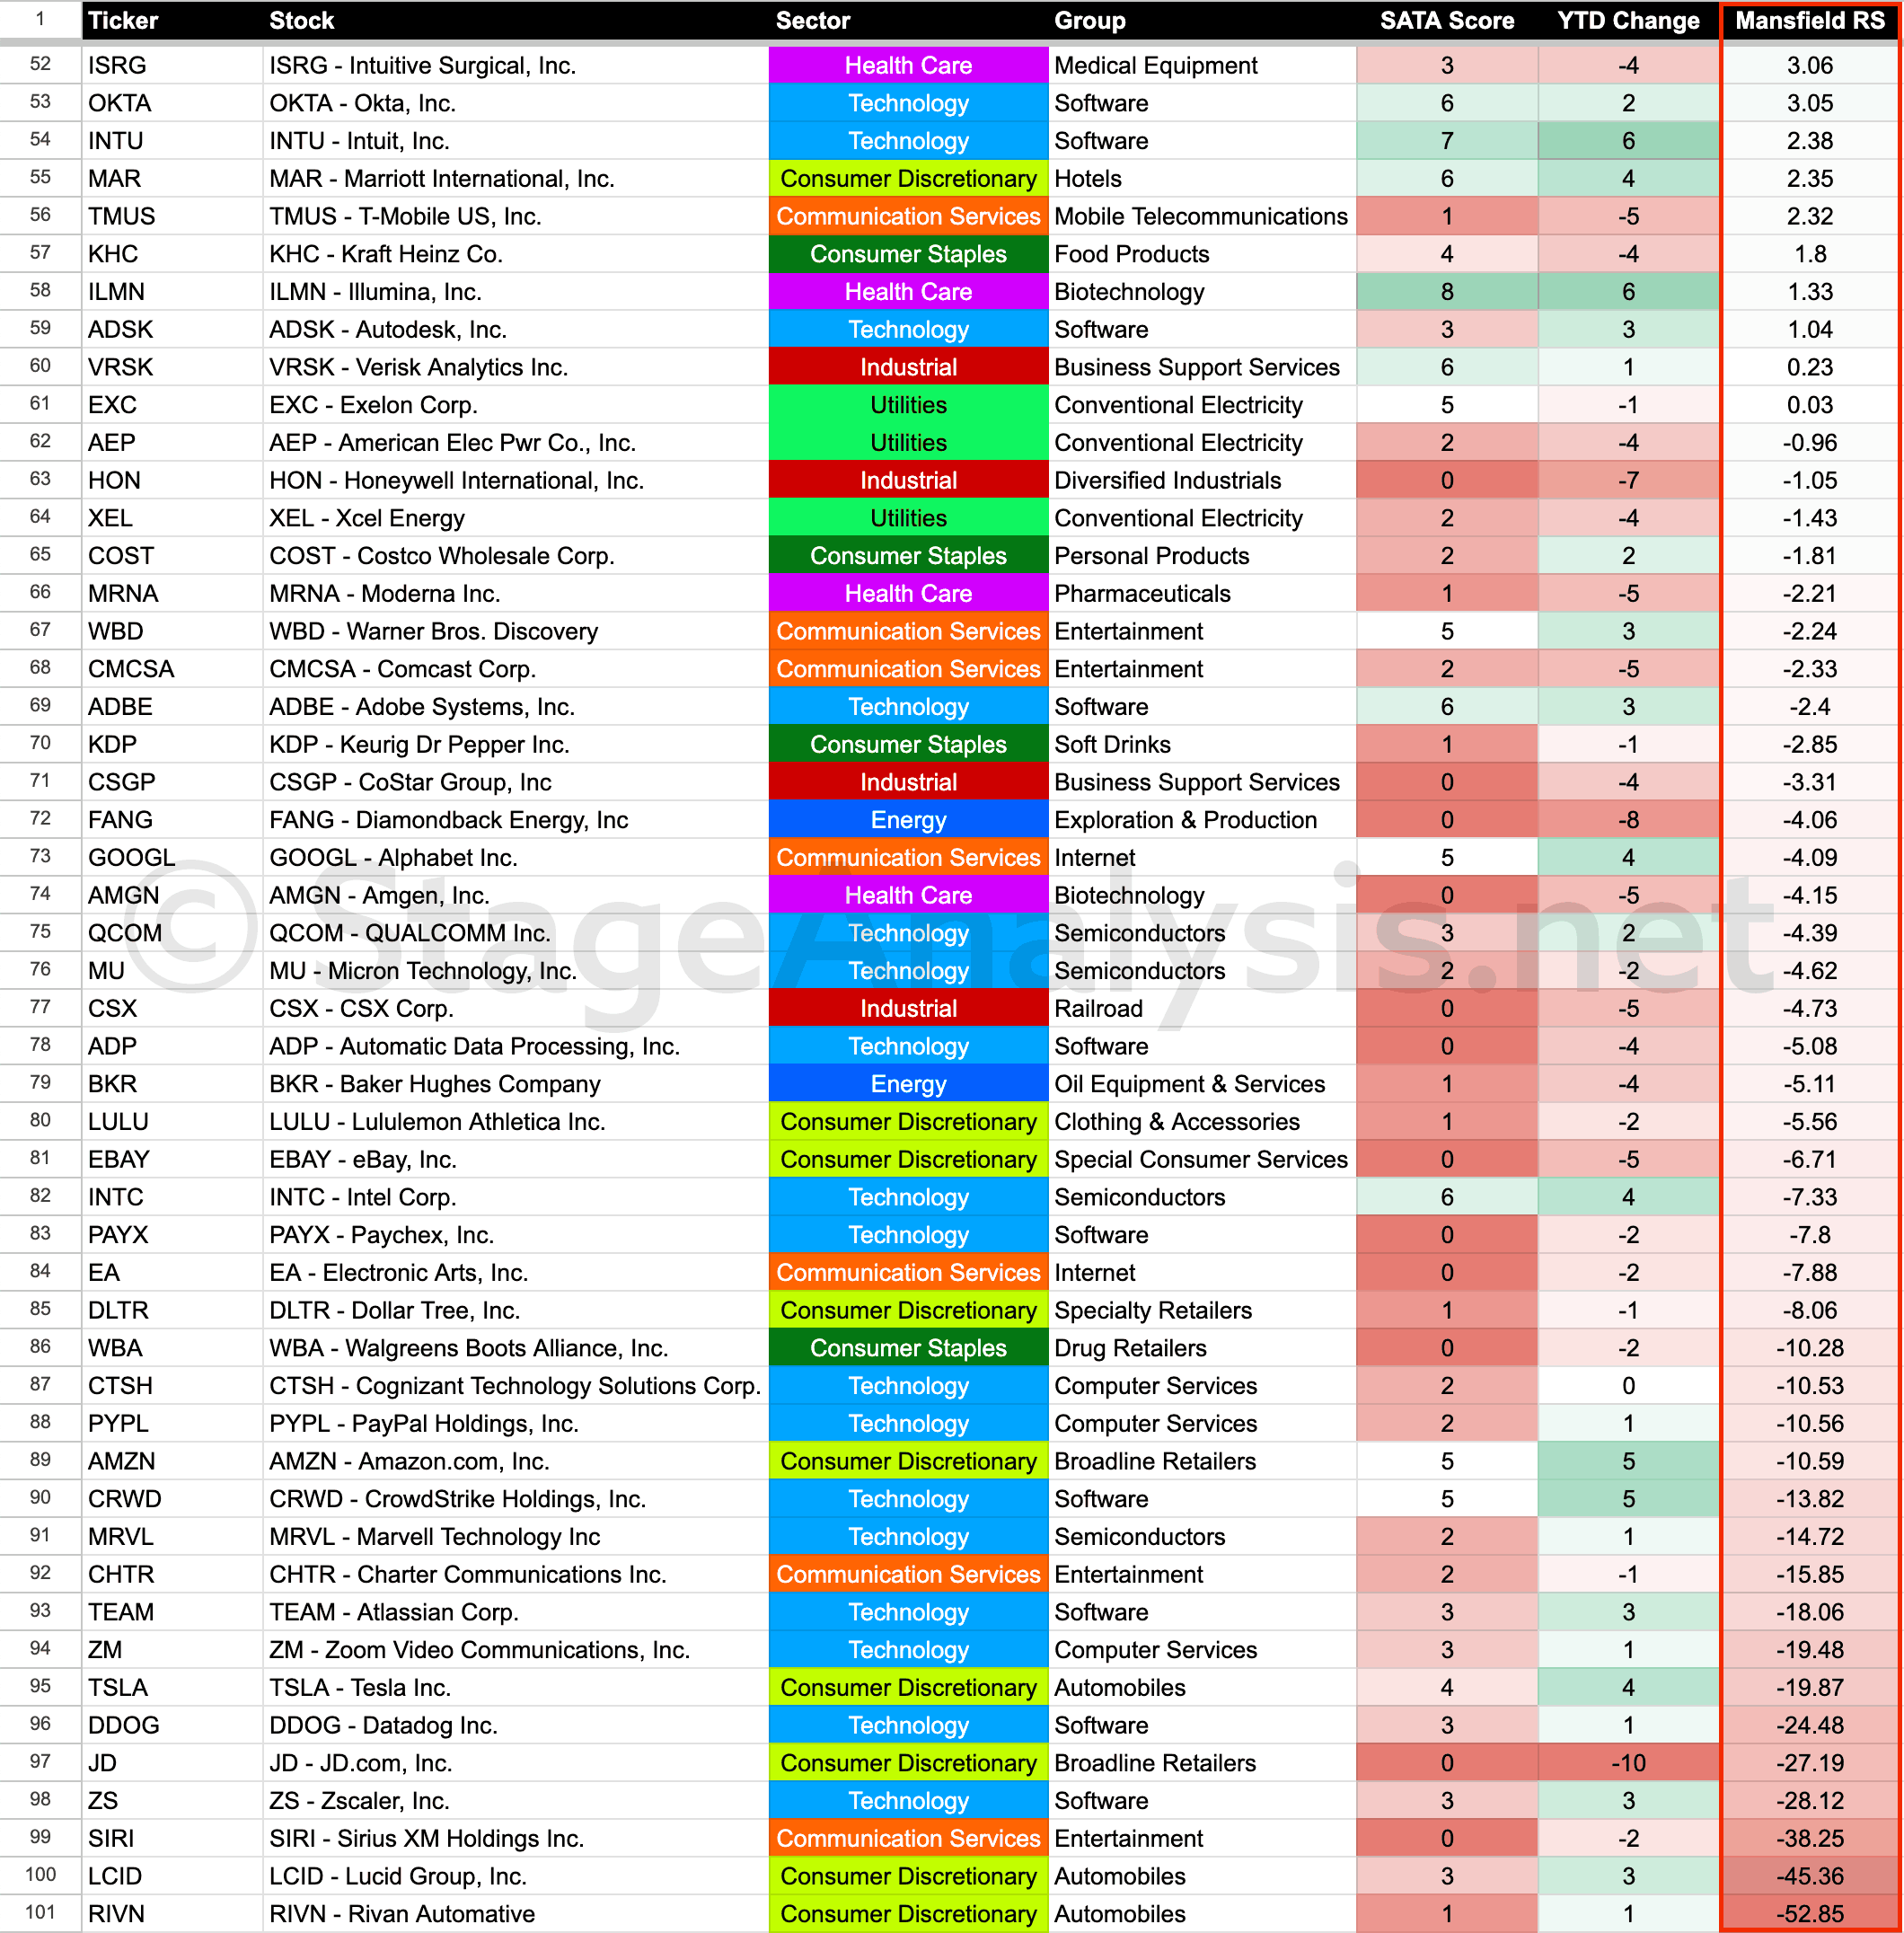
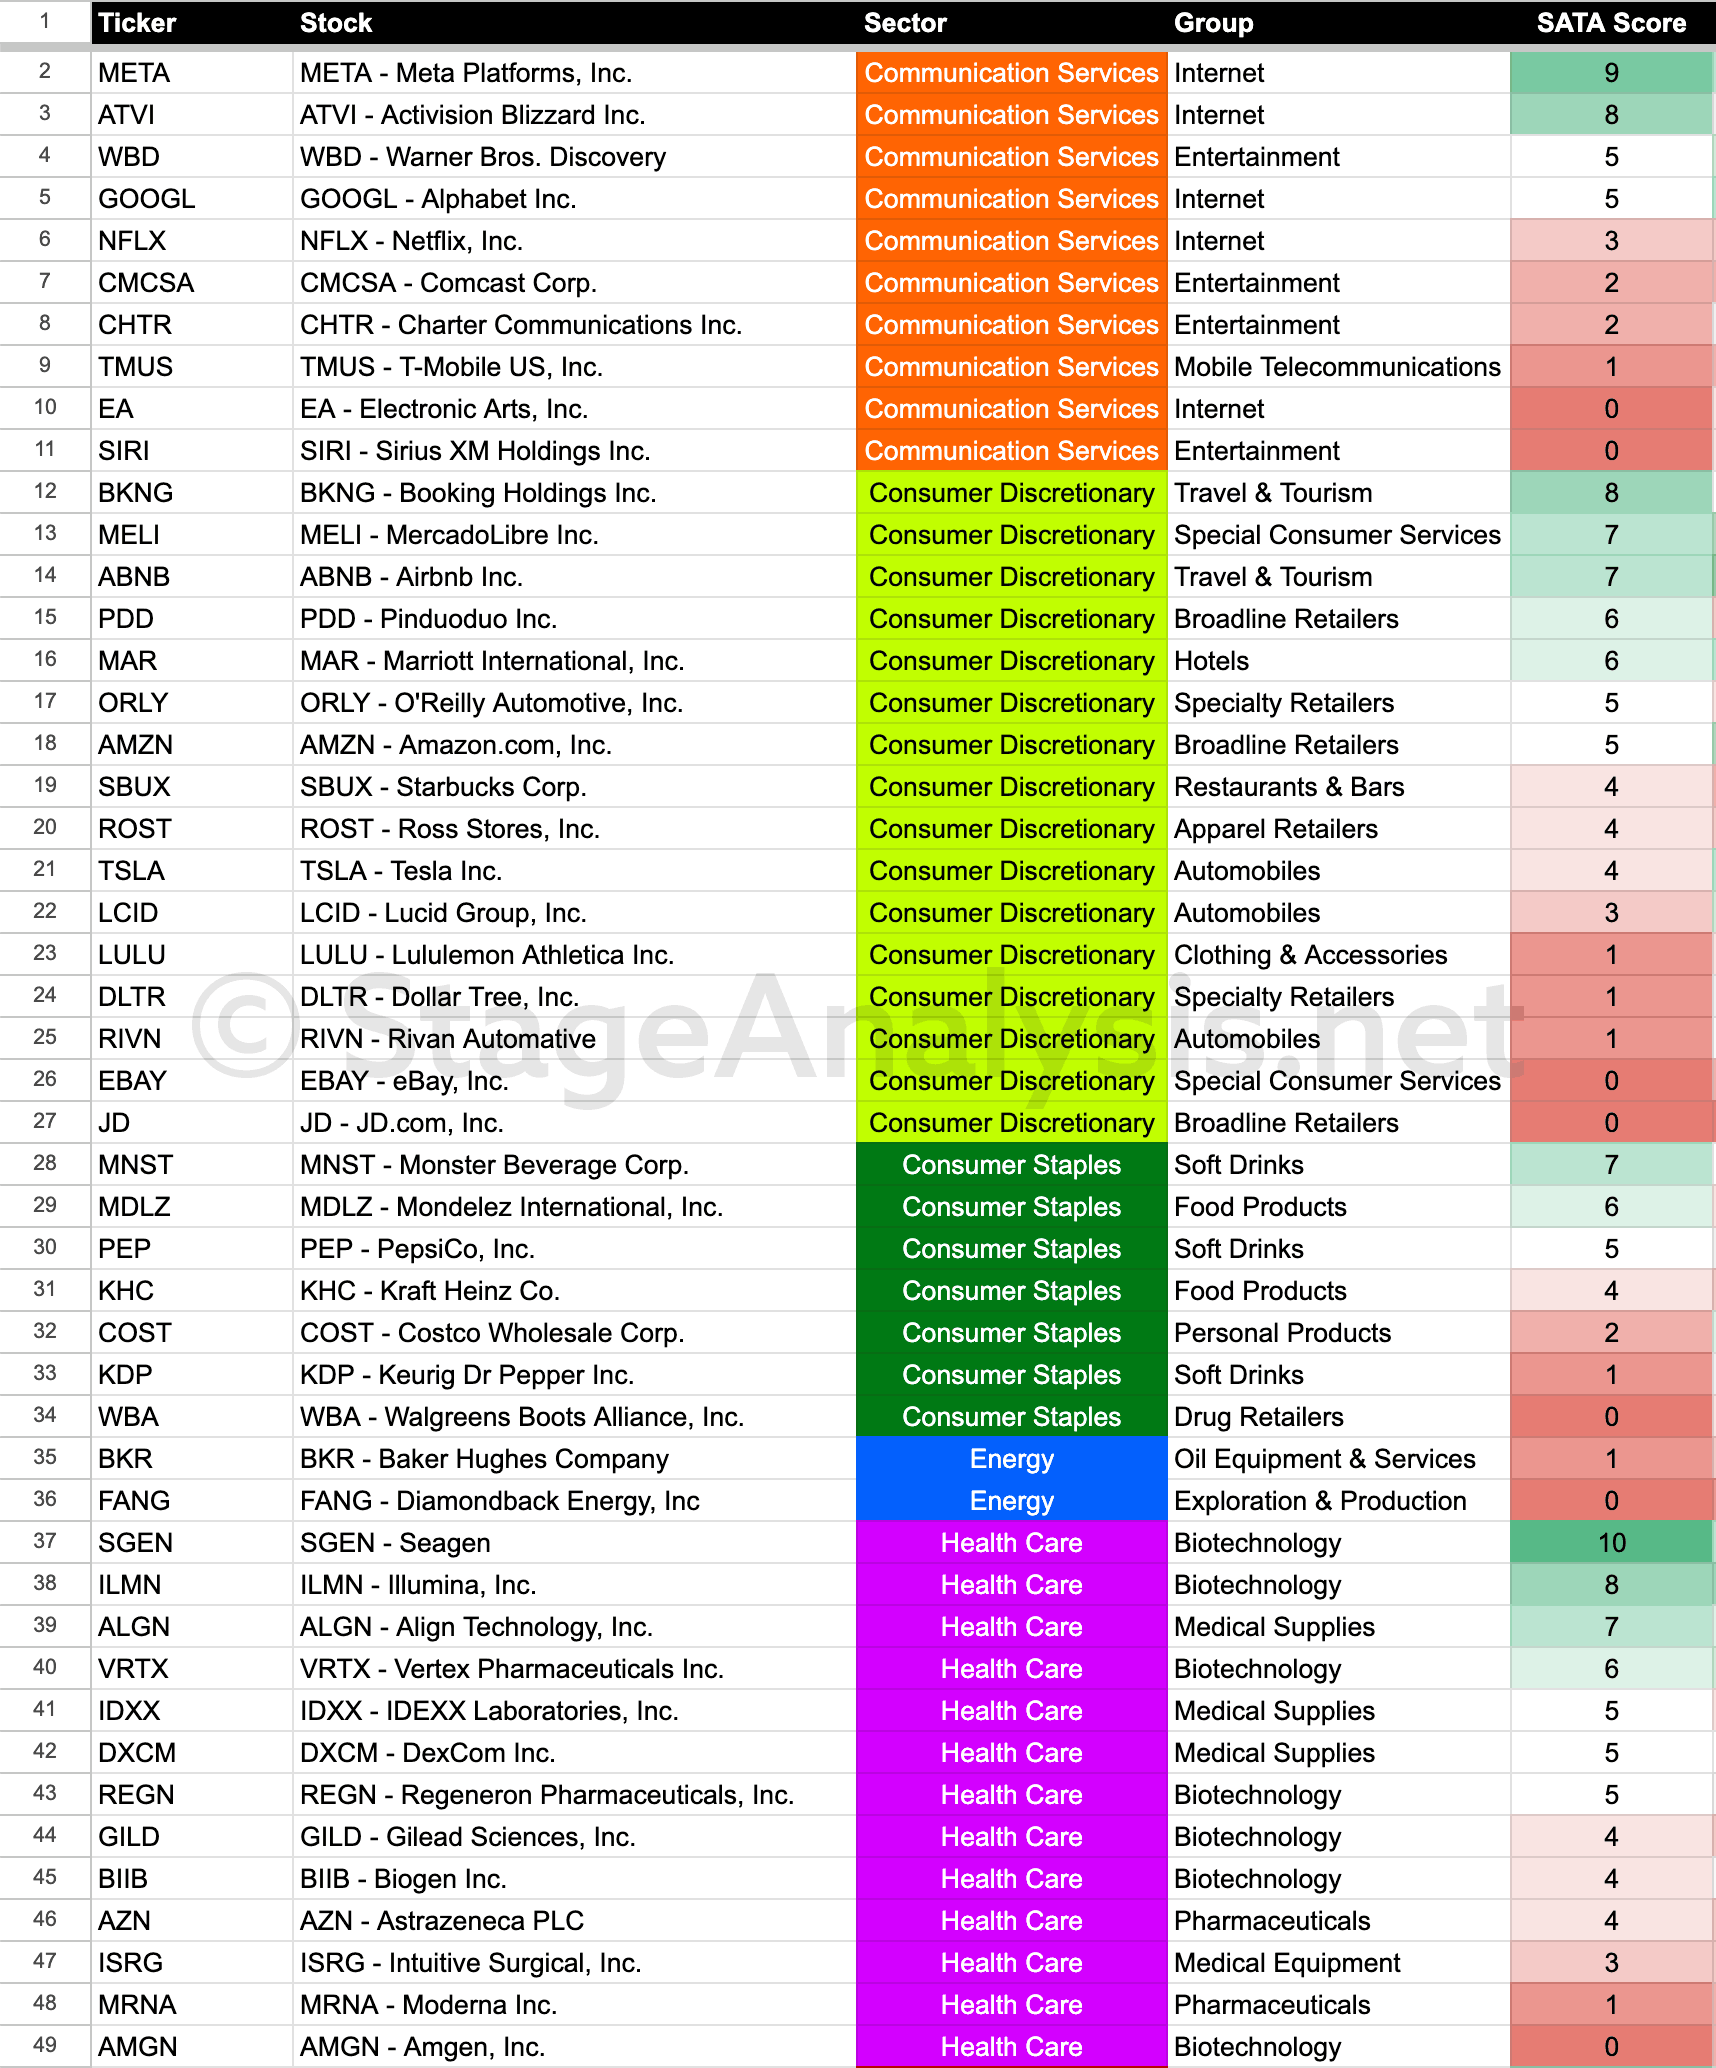
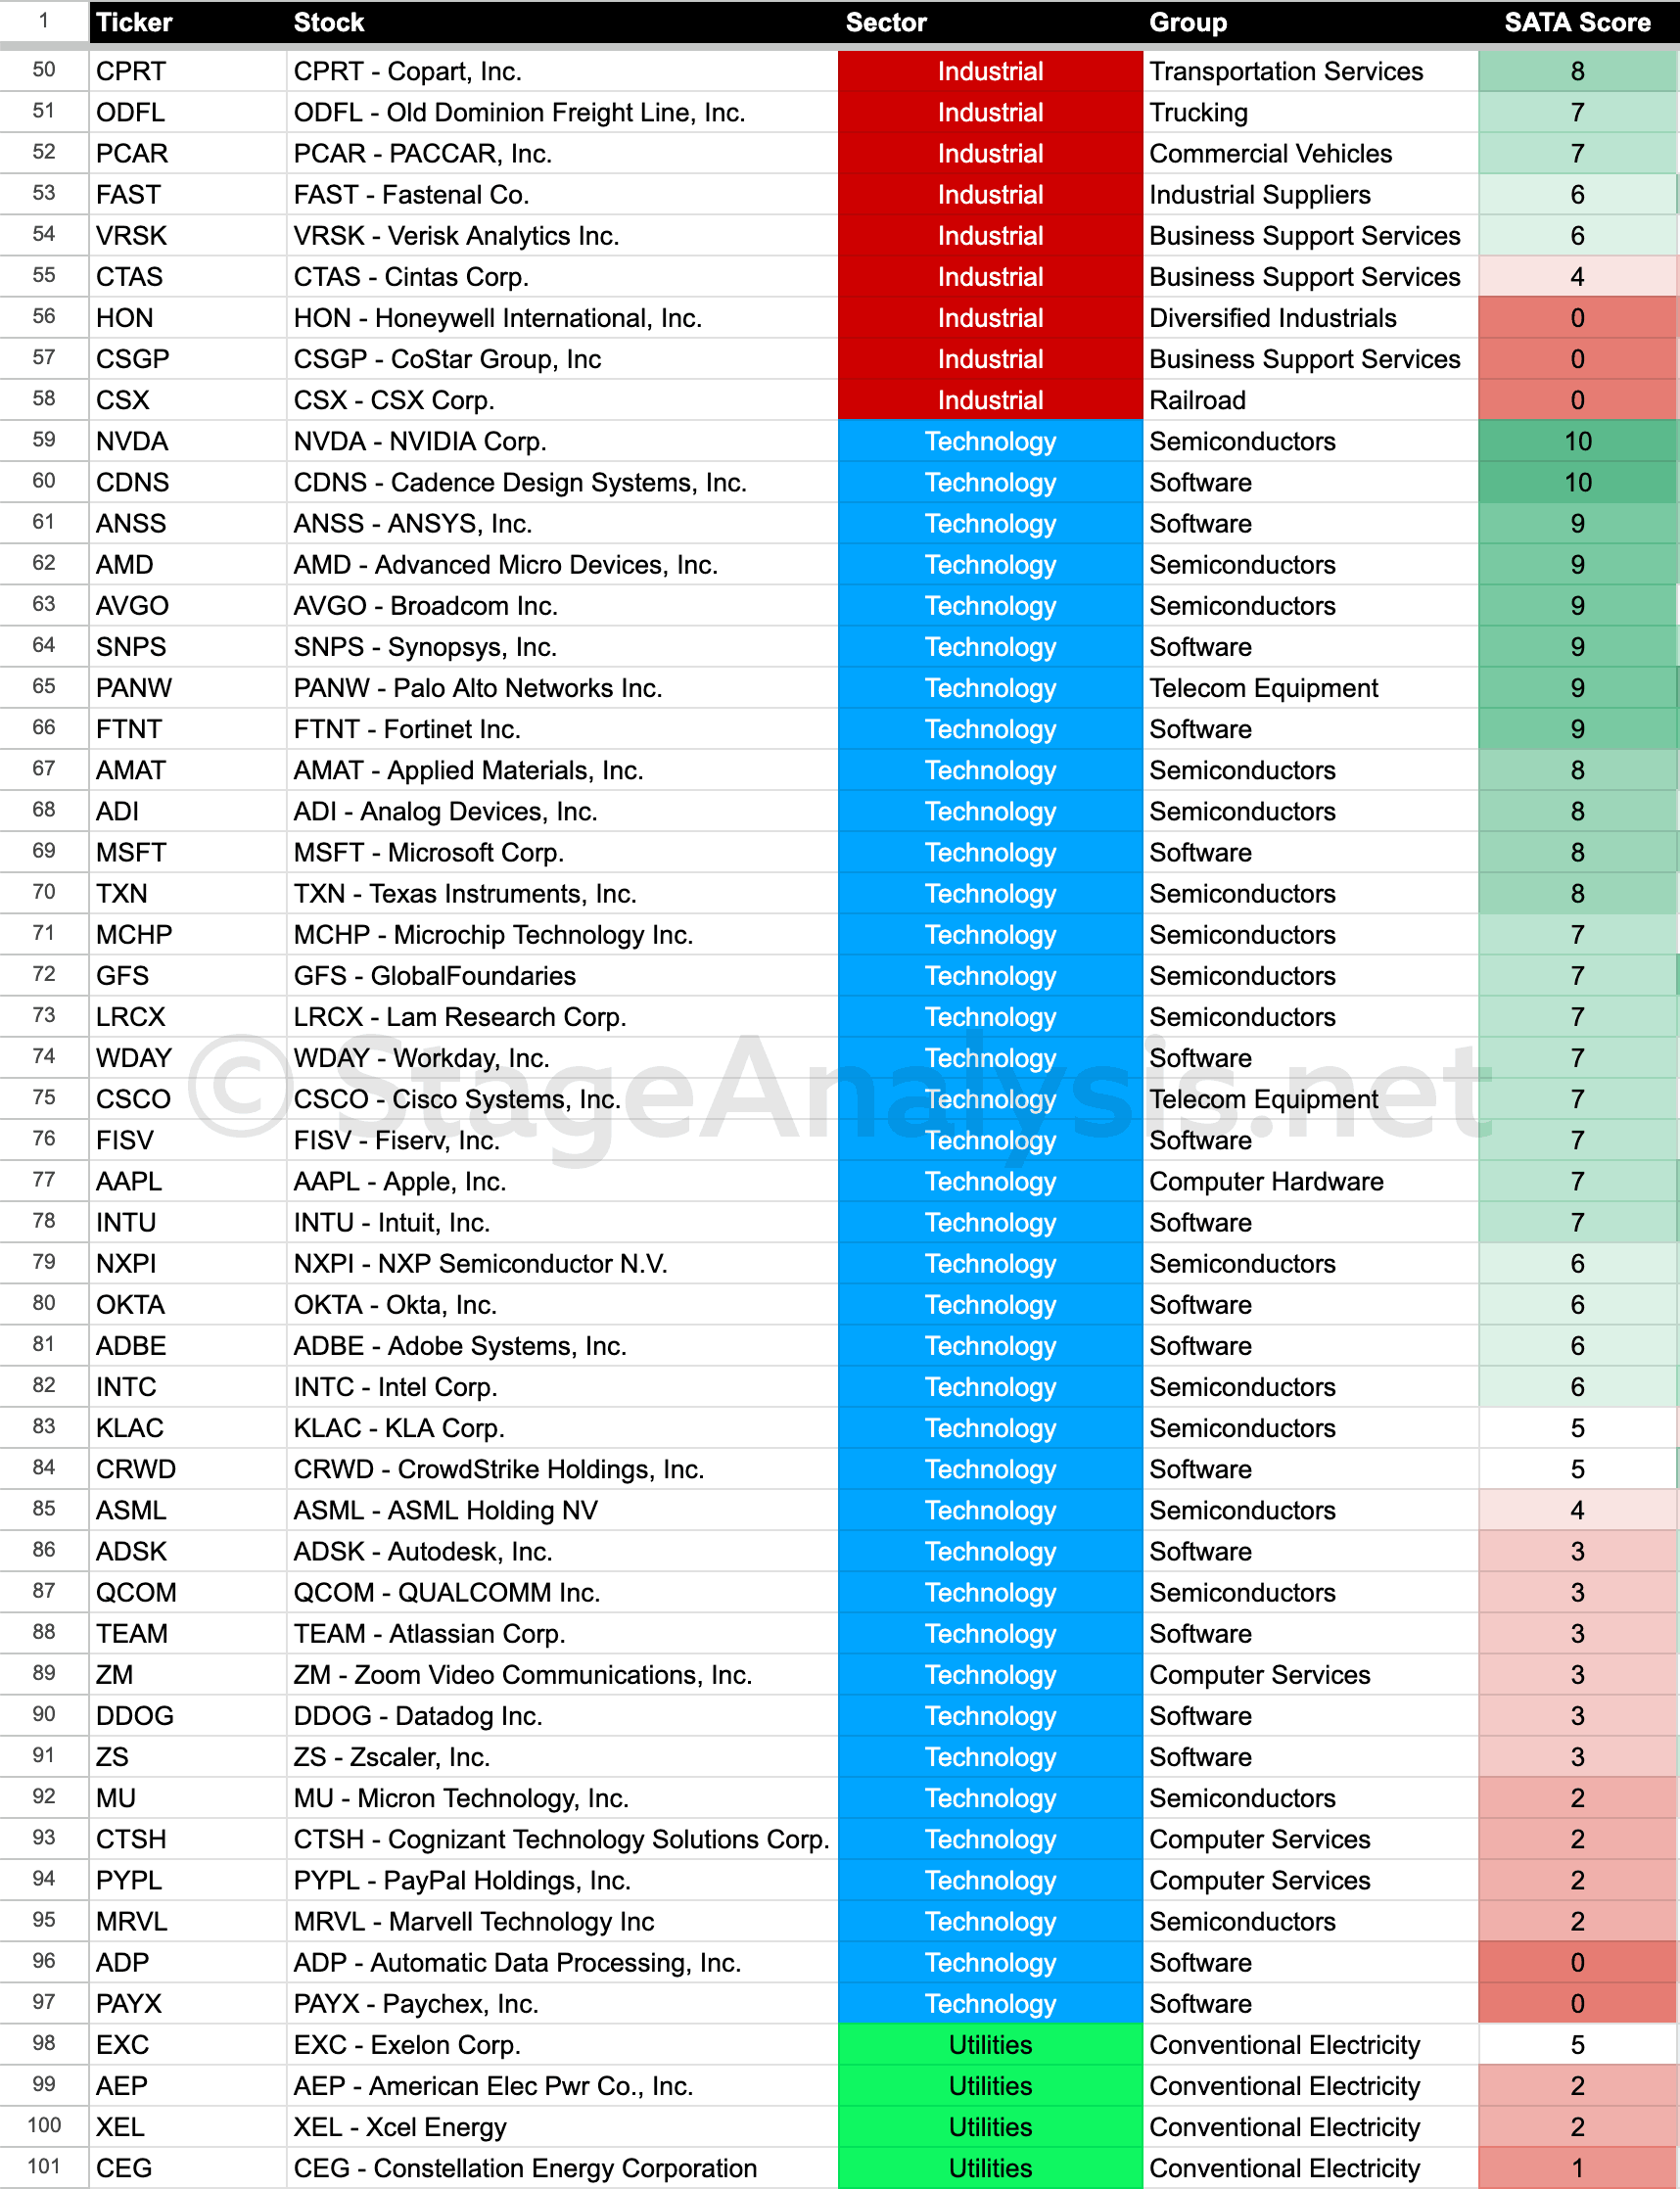
Below is the data tables of the Nasdaq 100 stocks in order of SATA Score, Mansfield Relative Strength, Sector and the position changes over the last 10 weeks.
Ordered by Highest SATA Score
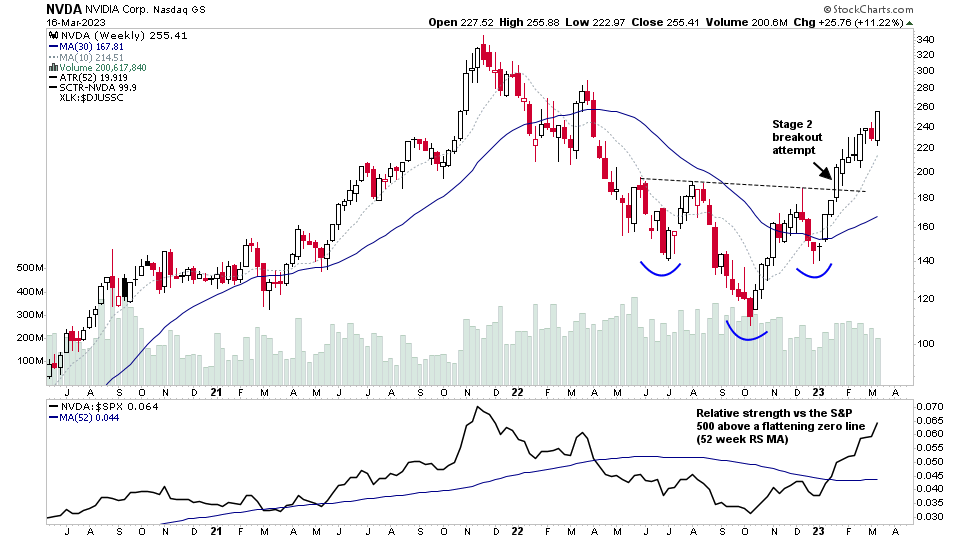
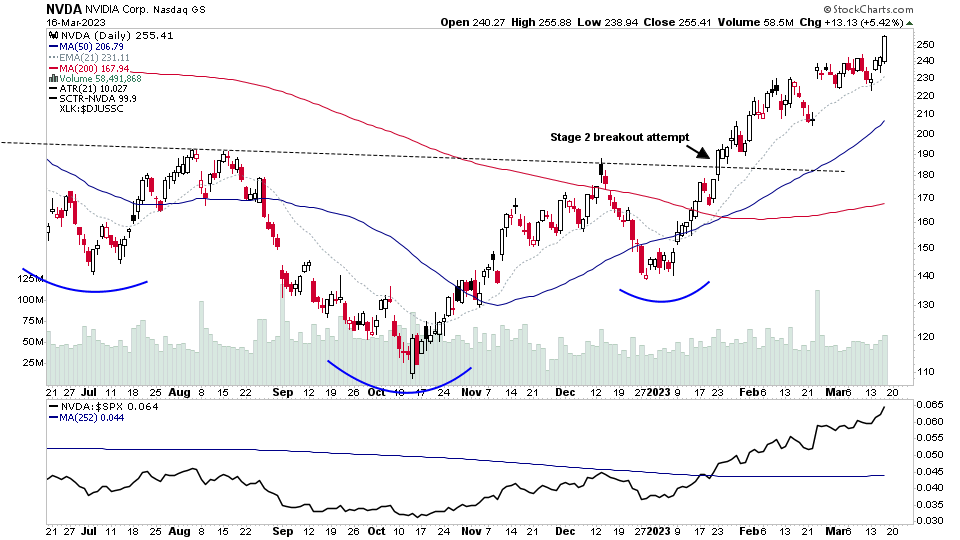
Semiconductors dominate the higher Stage 2 SATA scores with 9 of the 32 stocks with scores of 7 or higher, and has the Nasdaq 100s current leading stock by SATA score and also Mansfield RS score – NVDA, which broke out in the strong Stage 2 advance 8 weeks ago on the 23rd January with a SATA score at the time of breakout of a SATA 9.
Ordered by Mansfield Relative Strength (RS) Score
Ordered by Sectors
Coming Soon – SATA Scores on the Website
Since the start of the year we've been busy building a new tool, so that we can hopefully make the SATA scores available for the whole US market on the website, and potentially other markets too. Which will give members the ability to see the SATA score changes on a daily basis and then make use of that information.
There's multiple ways that this data could be useful on both the long and short side of the market and also as market breadth data and charts. So we are excited to get it up and running on the website soon.
Become a Stage Analysis Member:
To see more like this – US Stocks watchlist posts, detailed videos each weekend, use our unique Stage Analysis tools, such as the US Stocks & ETFs Screener, Charts, Market Breadth, Group Relative Strength and more...
Join Today
Disclaimer: For educational purpose only. Not investment advice. Seek professional advice from a financial advisor before making any investing decisions.