
$LCID - Stage 2 Breakout on Strong Relative Volume
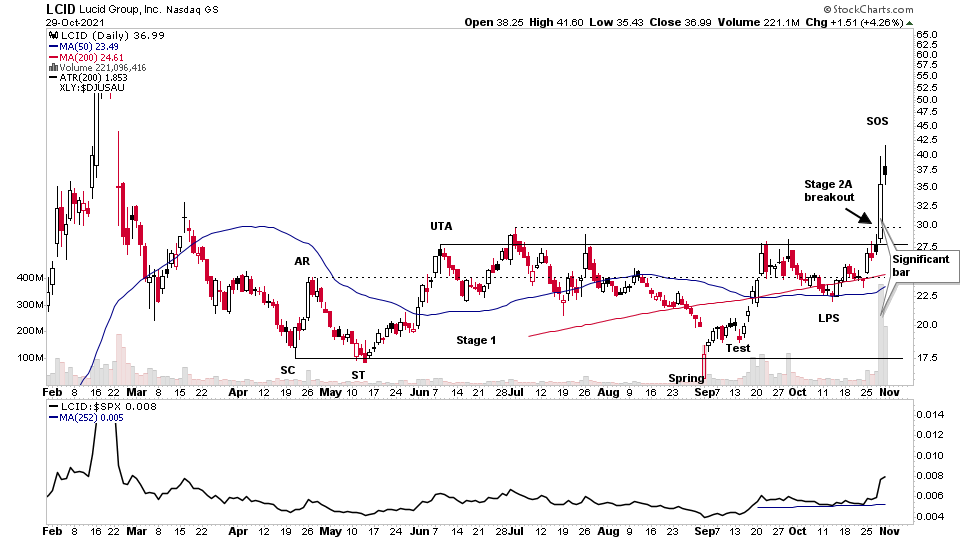
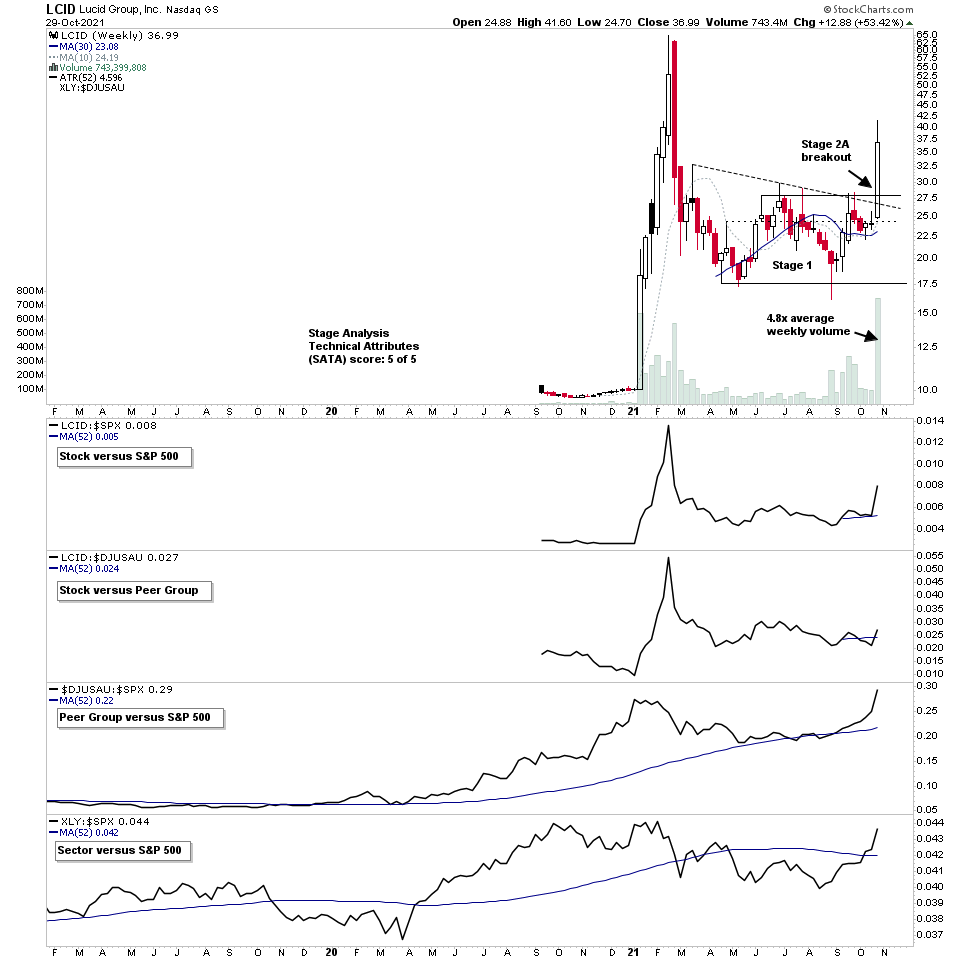
LCID has been developing a Stage 1 base for the last six months and this week broke out into early Stage 2, which is known as Stage 2A, on strong relative volume of more than 4.8x the weekly average, with relative strength versus the S&P 500 also breaking out and above a rising zero line (52 week RS MA)
The breakout also changed LCIDs Stage Analysis Technical Attributes (SATA) rating to a max of 5 out of 5, up from a score of 3 last week, as it gained a point for moving into Stage 2 and a point for the Peer Group moving above the zero line versus the S&P 500. So LCID is outperforming the market, the peer group, and its peer group and sector are both also outperforming the market.
LCID has been highlighted numerous times in the last few months in the members area, and over 10 times in the US Stocks Watchlist since the Spring and Test in September, which I identified as a potential Phase C and then a developing Phase D of the Stage 1 base structure, which are early entry zones in the Wyckoff method, and so members have had a few months to consider trading LCID before the breakout happened this week.
The peer group (Automobiles $DJUSAU) has also been rising strongly through the RS tables over the last few months, and moved to 1st place this week with strong moves in multiple Automobiles stocks led by TSLA's strength, which give added weight to the Stage 2A breakout, as group strength is a key component of the Stage Analysis and Wyckoff methods.
With the Stage 2A breakout it is now in the Sign of Strength (SOS) rally part of Phase D of the base structure, and so once the momentum from the initial rally fades, and it starts to consolidate or pullback, I'll be looking for it to hold above the Stage 1 base in what is known as the Backup (BU), which ideally shouldn't fall back below the heavy volume Significant Bar, and with such heavy volume on the breakout bar, you also ideally want to see it hold above the lower half of the body of that bar (i.e. not drop below 32 ish).
You don't always get a backup though, as if the Stage 2 breakout is very strong it may continue to grind higher in a lockout rally. But if that is the case then I'd be watching for the next constructive consolidation to form.
If the backup base does begin to form and is constructive with re-accumulation characteristics then it can present an opportunity for the Stage Analysis Investor method secondary entry point, which is lower risk than the breakout as you can judge the quality of the Stage 2A breakout and subsequent pullback and base structure to attempt to get in around an area of support or on a subsequent continuation breakout.
See below for a potential targets using the Wyckoff P&F horizontal count method.
Become a Stage Analysis Member:
To see more like this – US Stocks watchlist posts, detailed videos each weekend, use our unique Stage Analysis tools, such as the US Stocks & ETFs Screener, Charts, Market Breadth, Group Relative Strength and more...
Join Today
LCID Stock Point & Figure Horizontal Price Target (Wyckoff method)
The Wyckoff method P&F horizontal count line is 17 columns with a 1 box size by 3 reversal chart. Which added onto the Base Low at 17 and the Last Point of Support (LPS) at 23, gives a target range of 68 to 74
Hence the potential Cause from the Stage 1 base is around 83%+ from the current price level.
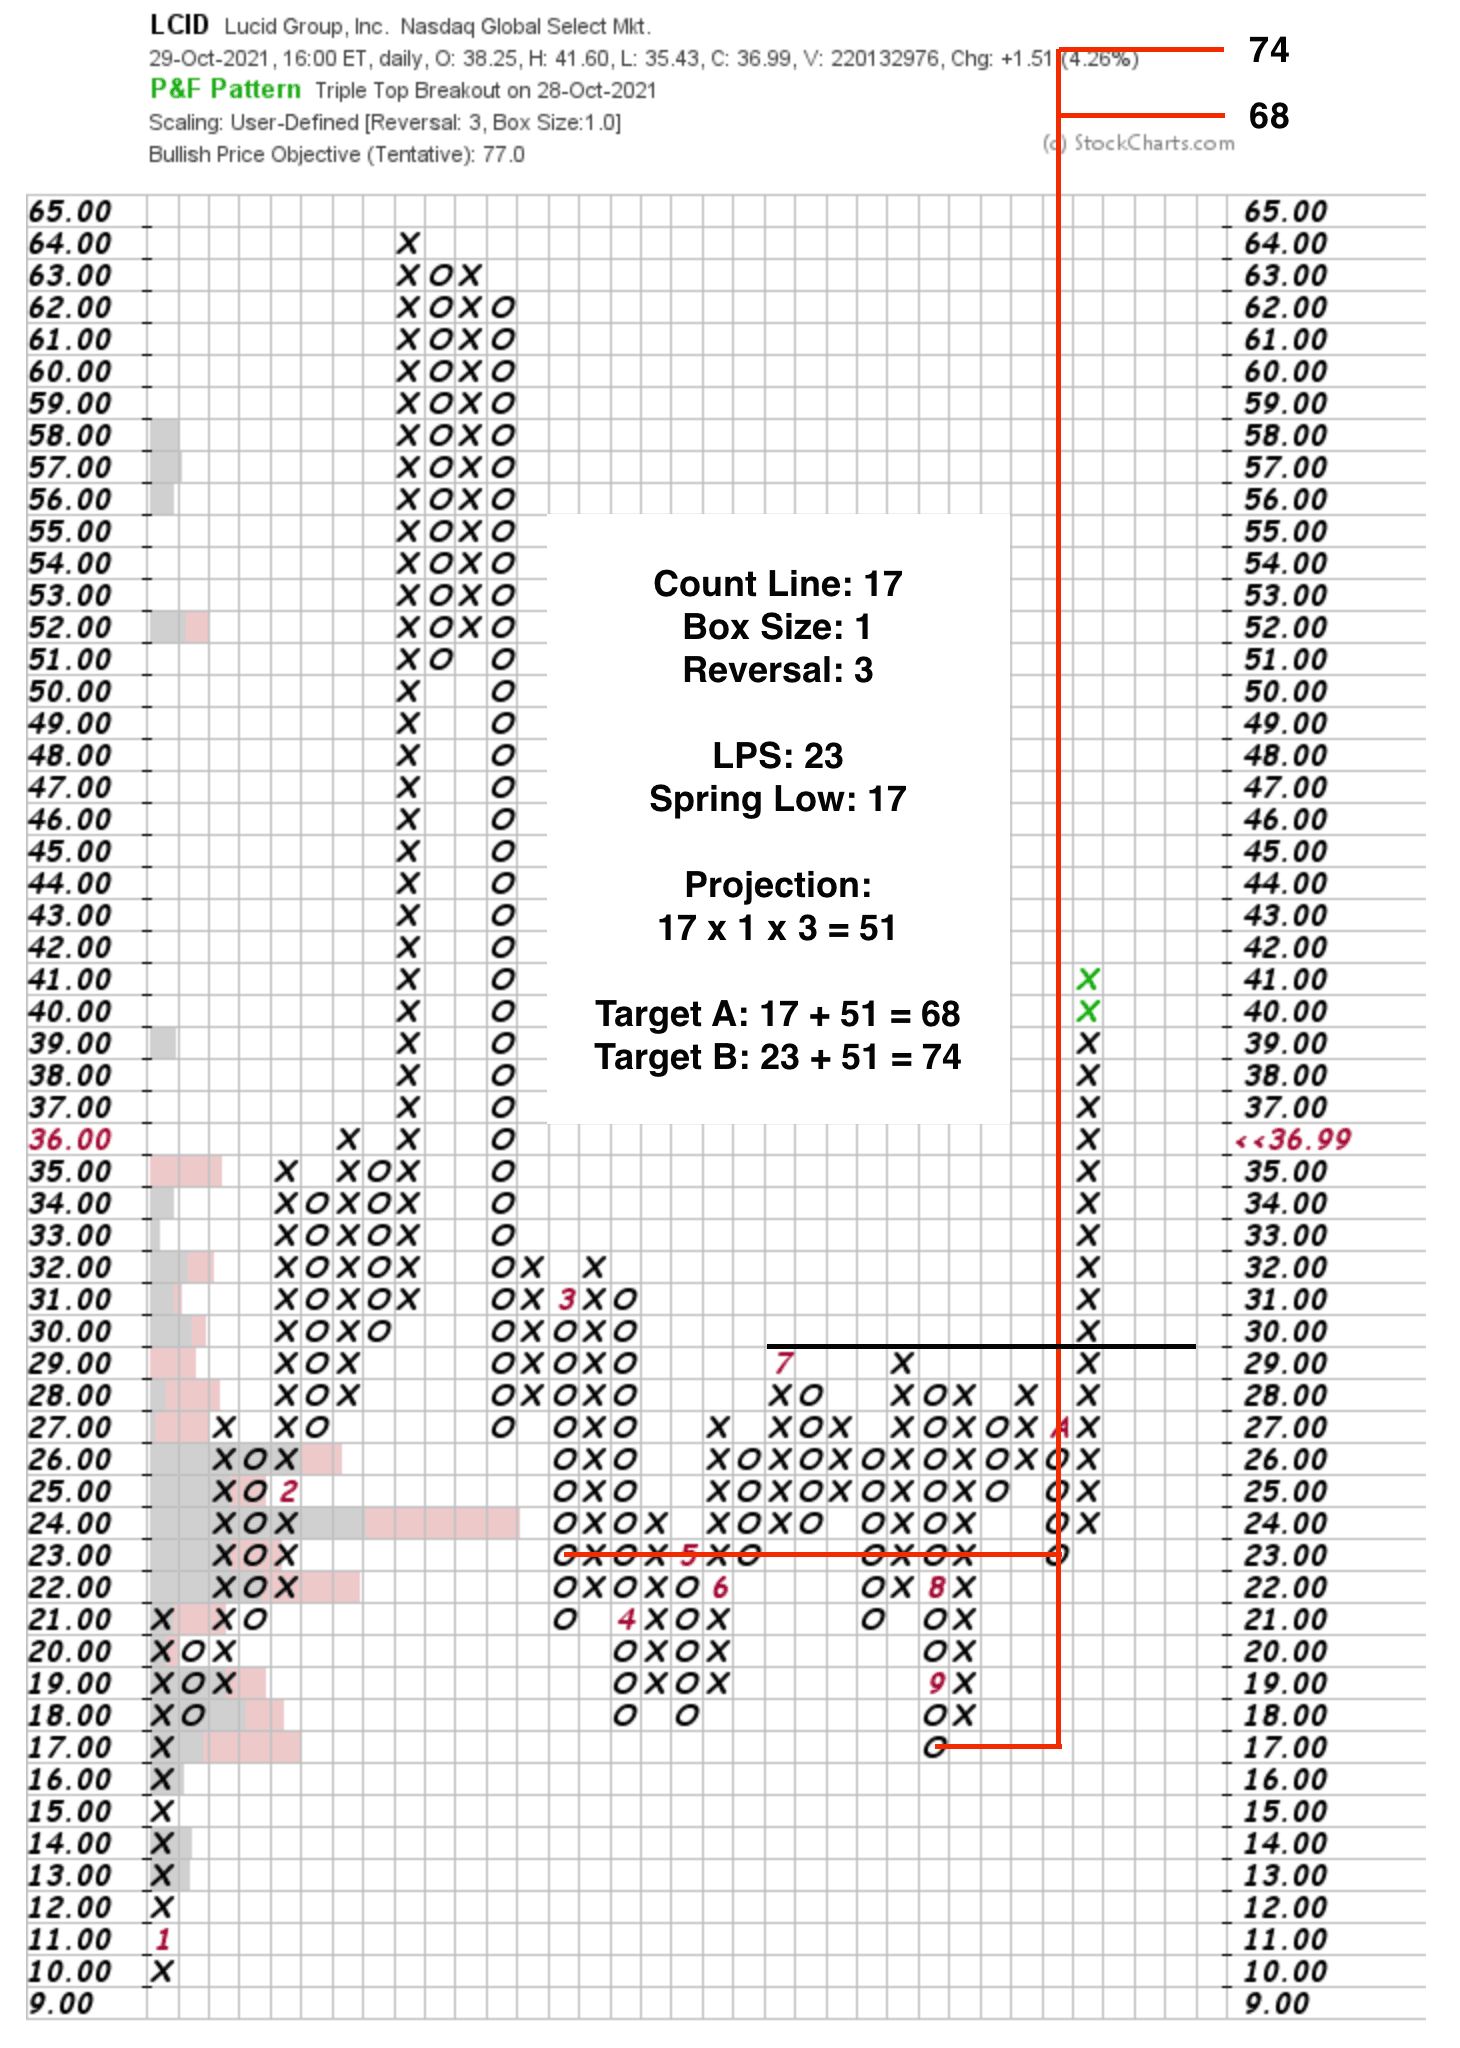
Count Line: 17
Box Size: 1
Reversal: 3
LPS: 23
Spring Low: 17
Projection: 17 x 1 x 3 = 51
Target A: 17 + 51 = 68
Target B: 23 + 51 = 74
Become a Stage Analysis Member:
To see more like this – US Stocks watchlist posts, detailed videos each weekend, use our unique Stage Analysis tools, such as the US Stocks & ETFs Screener, Charts, Market Breadth, Group Relative Strength and more...
Join Today
Disclaimer: For educational purpose only. Not investment advice. Seek professional advice from a financial advisor before making any investing decisions.