
US Stocks Industry Groups Relative Strength Rankings
The full post is available to view by members only. For immediate access:
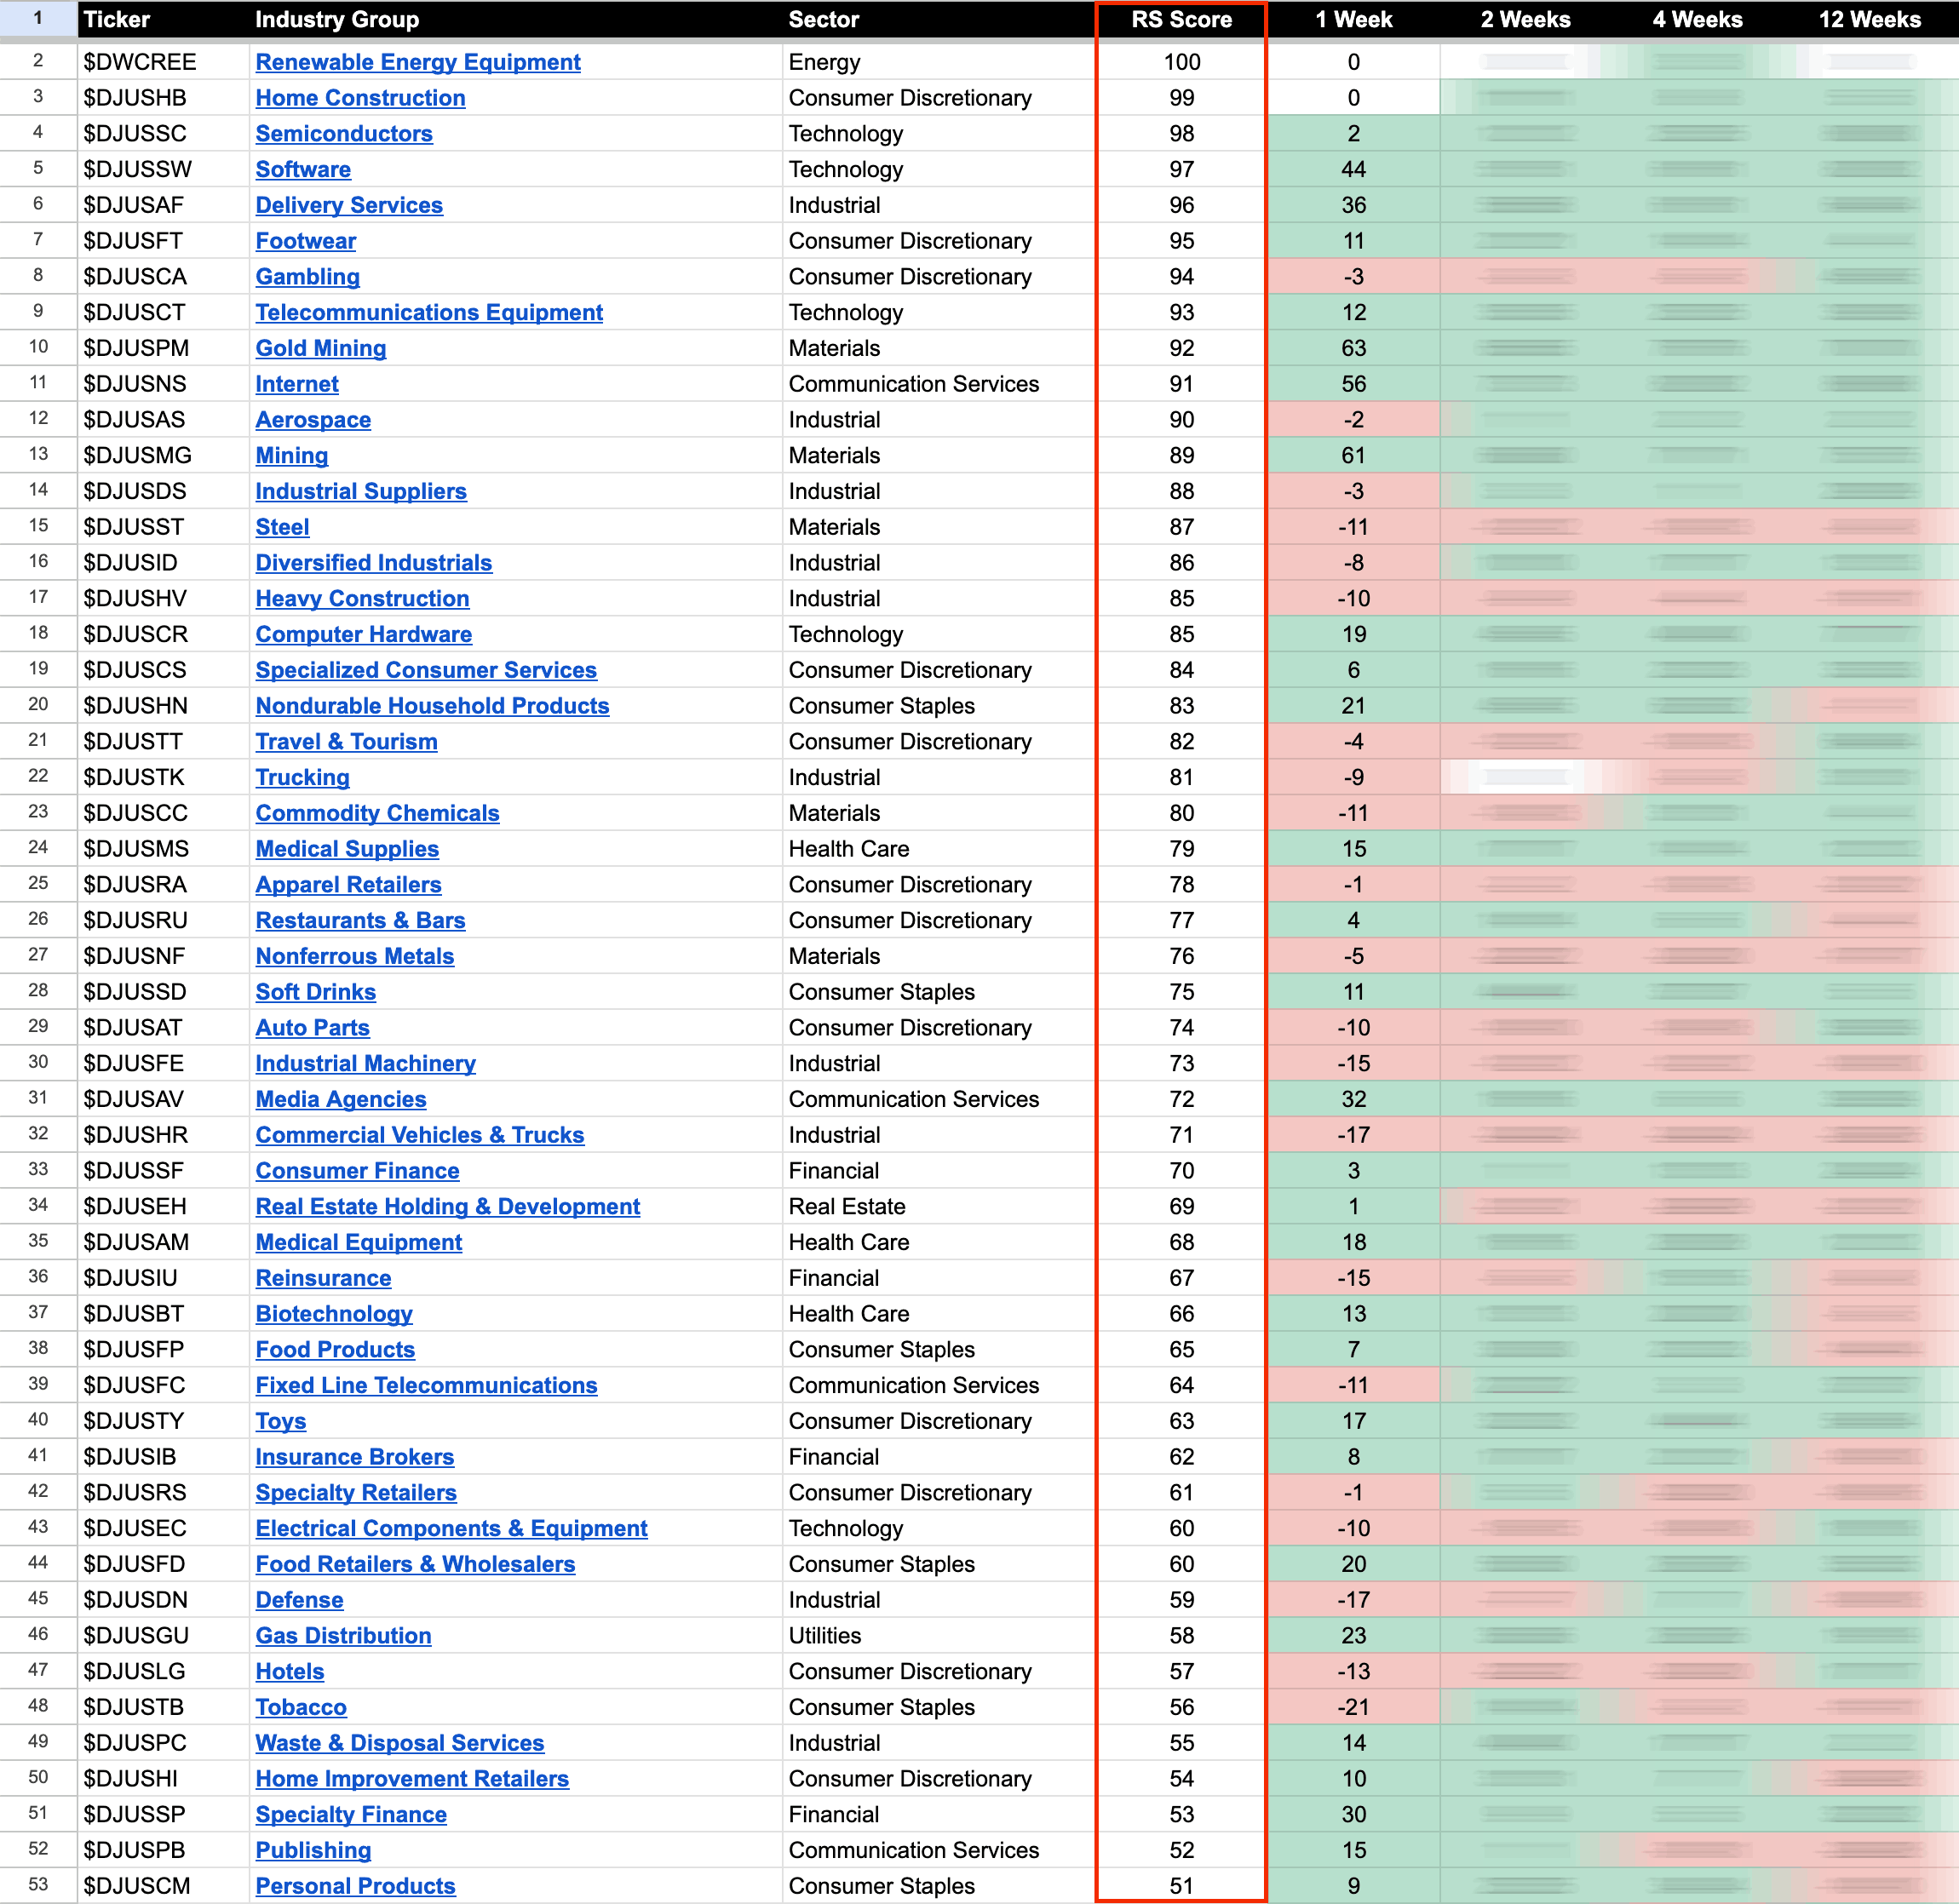
US Industry Groups by Highest RS Score
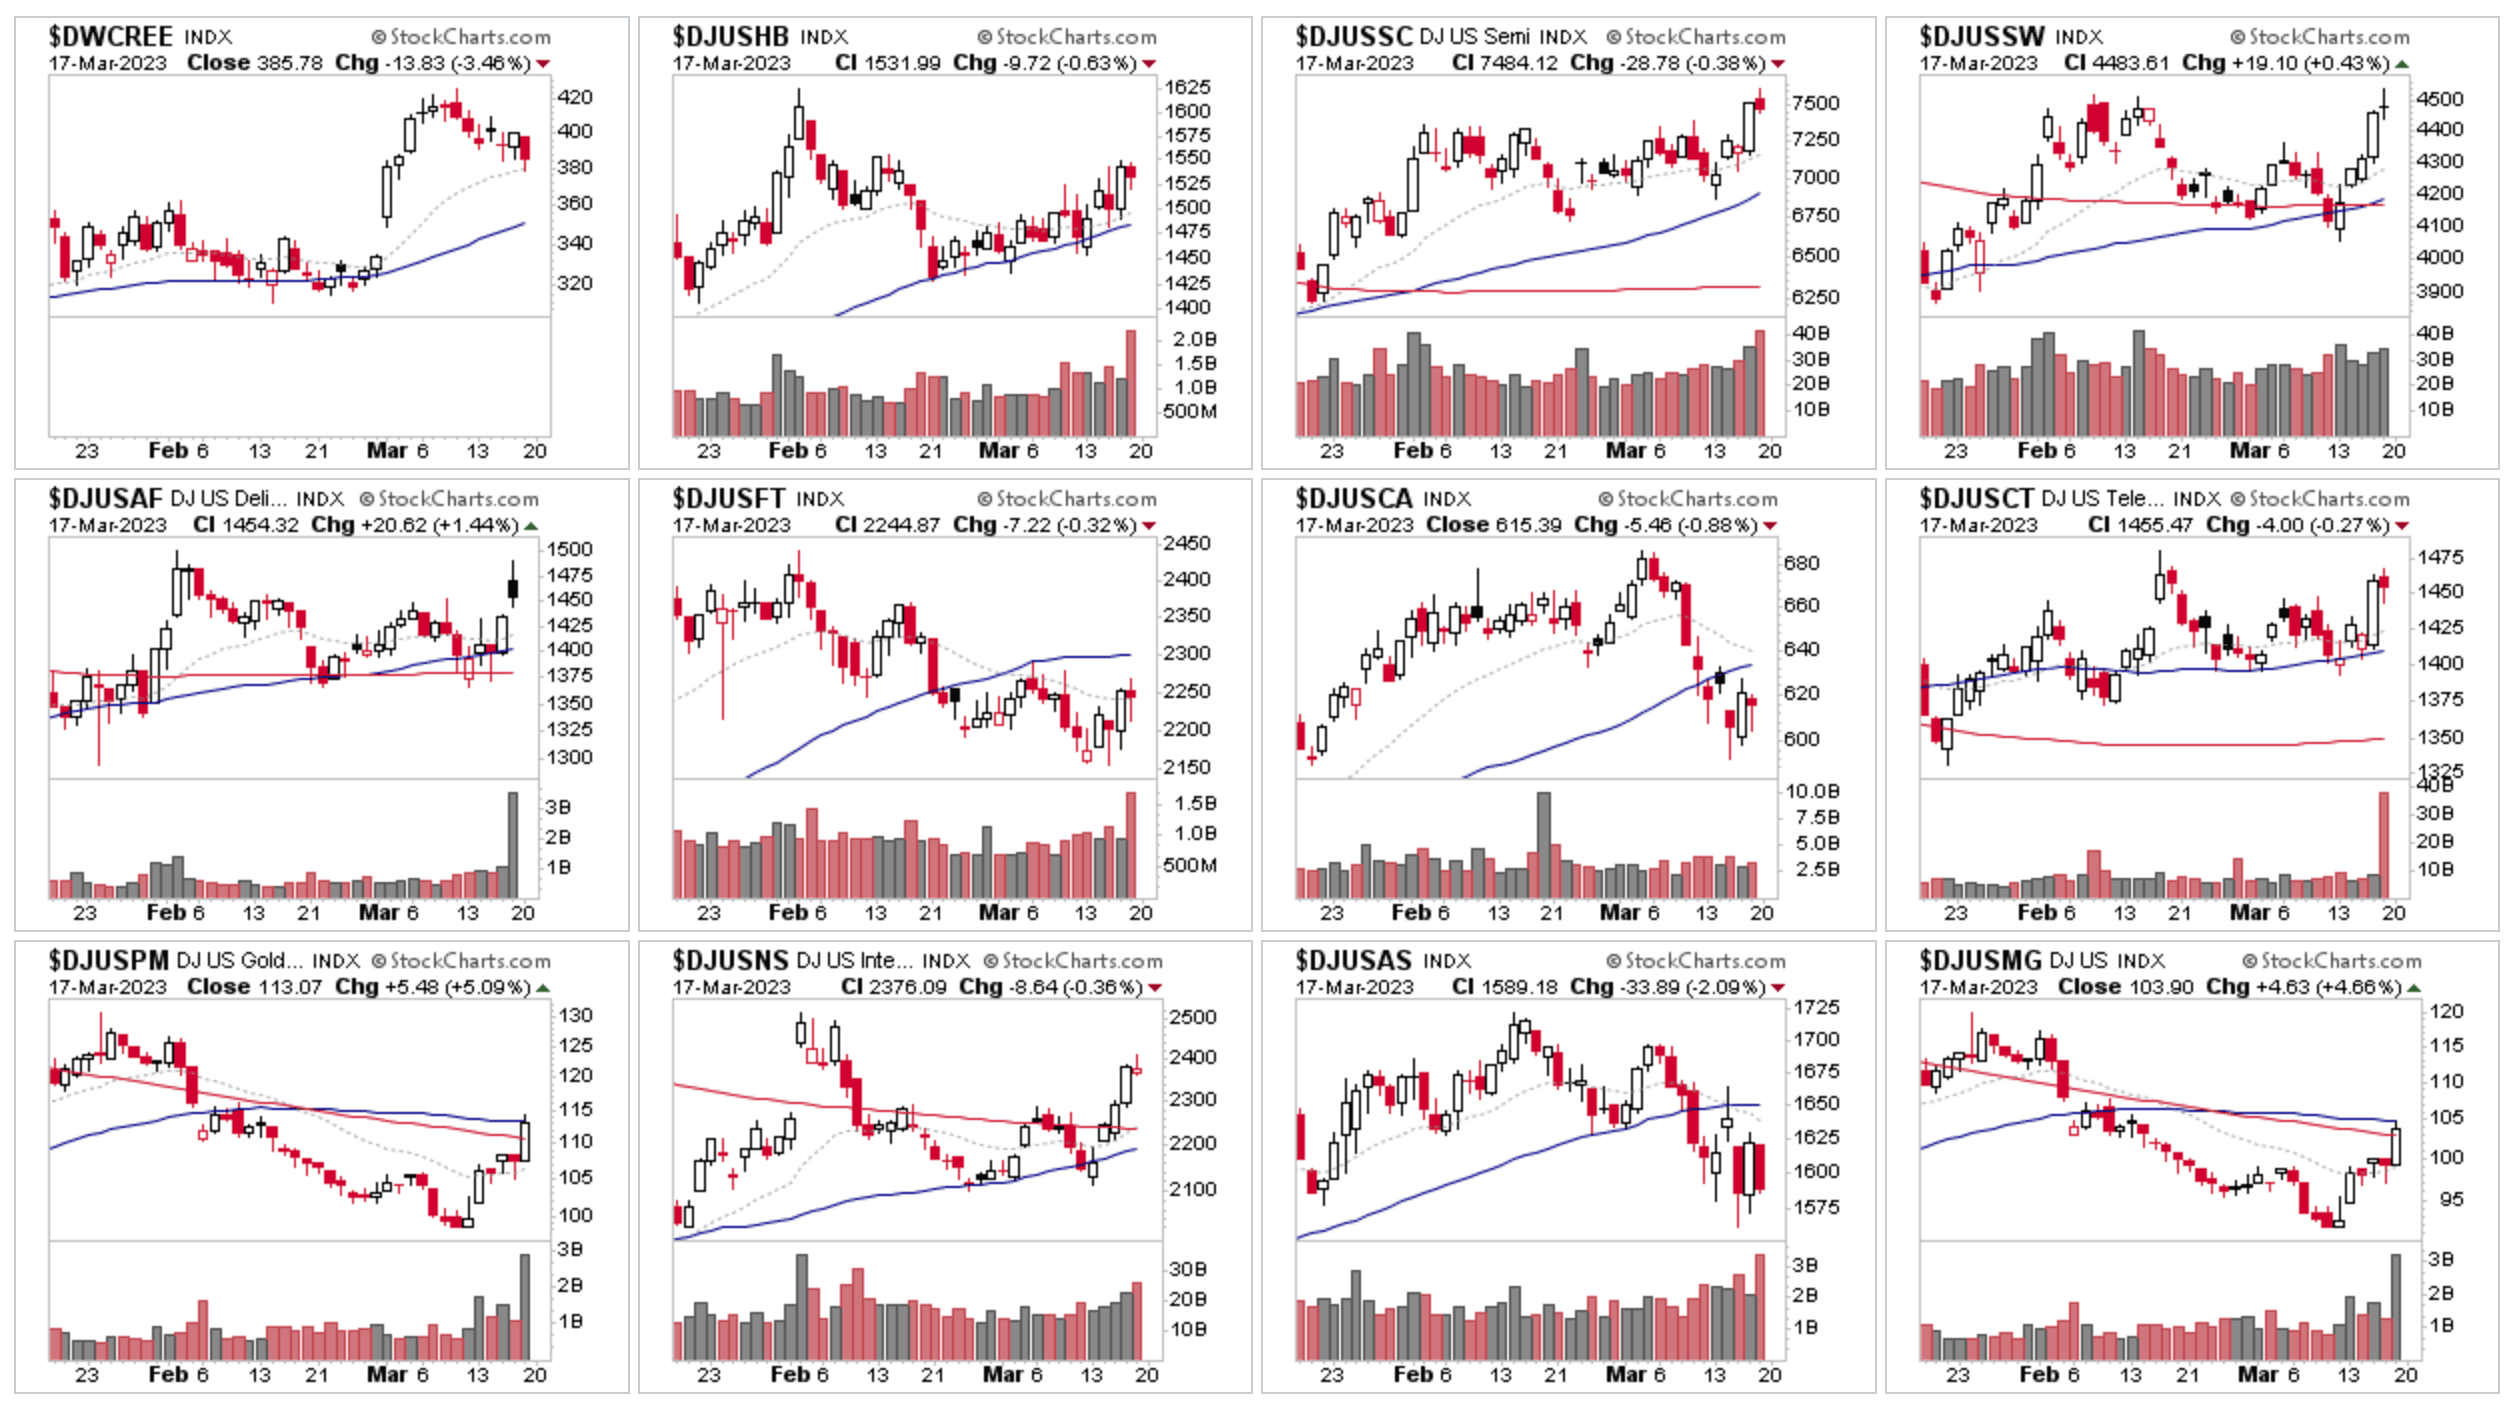
Semiconductors ($DJUSSC) rose +2 RS points to 3rd place overall in the RS rankings this week and was the first Technology sector group to move into the top 10 since early 2022 the prior week. With it making a Stage 2 continuation breakout attempt on Thursday, with one of this years leading stocks (NVDA) continuing to drive higher in its eight week old Stage 2 advancing phase, and also a strong Stage 2 breakout attempt from another large cap in the group (AMD), which had an +18.35% move over the week. There were also 6 stocks from the group that had greater than 10% moves over the week. So it continues to be one strongest areas of the market with a steady rise up the RS rankings over the last 6 months, and has potential to become the leader.
Software ($DJUSSW) also showed considerable RS this week, with a gain of +44 RS points. Moving it into 4th place overall, which is a big change for the group which has only been able to manage a few moves above the mid point of the RS rankings in the last year, and has now launched higher into the top ten for the first time since November 2021 when it topped after an 81 week Stage 2 advance.
Gold Mining ($DJUSPM) was this weeks largest RS gainer, moving up +63 RS points to 9th place overall, as physical gold rebounded strongly from the Stage 2 secondary entry zone – highlighted in last weekends Stage Analysis Members Video – 12 March 2023 (1hr 29mins) and was further discussed in Mondays blog post Group Focus: Gold, Silver and the Precious Metals Miners – 13 March 2023. Physical gold finished the week at a new near term high in Stage 2, and the Gold Mining group chart reversed strongly back through its 30 week MA in Stage 1.
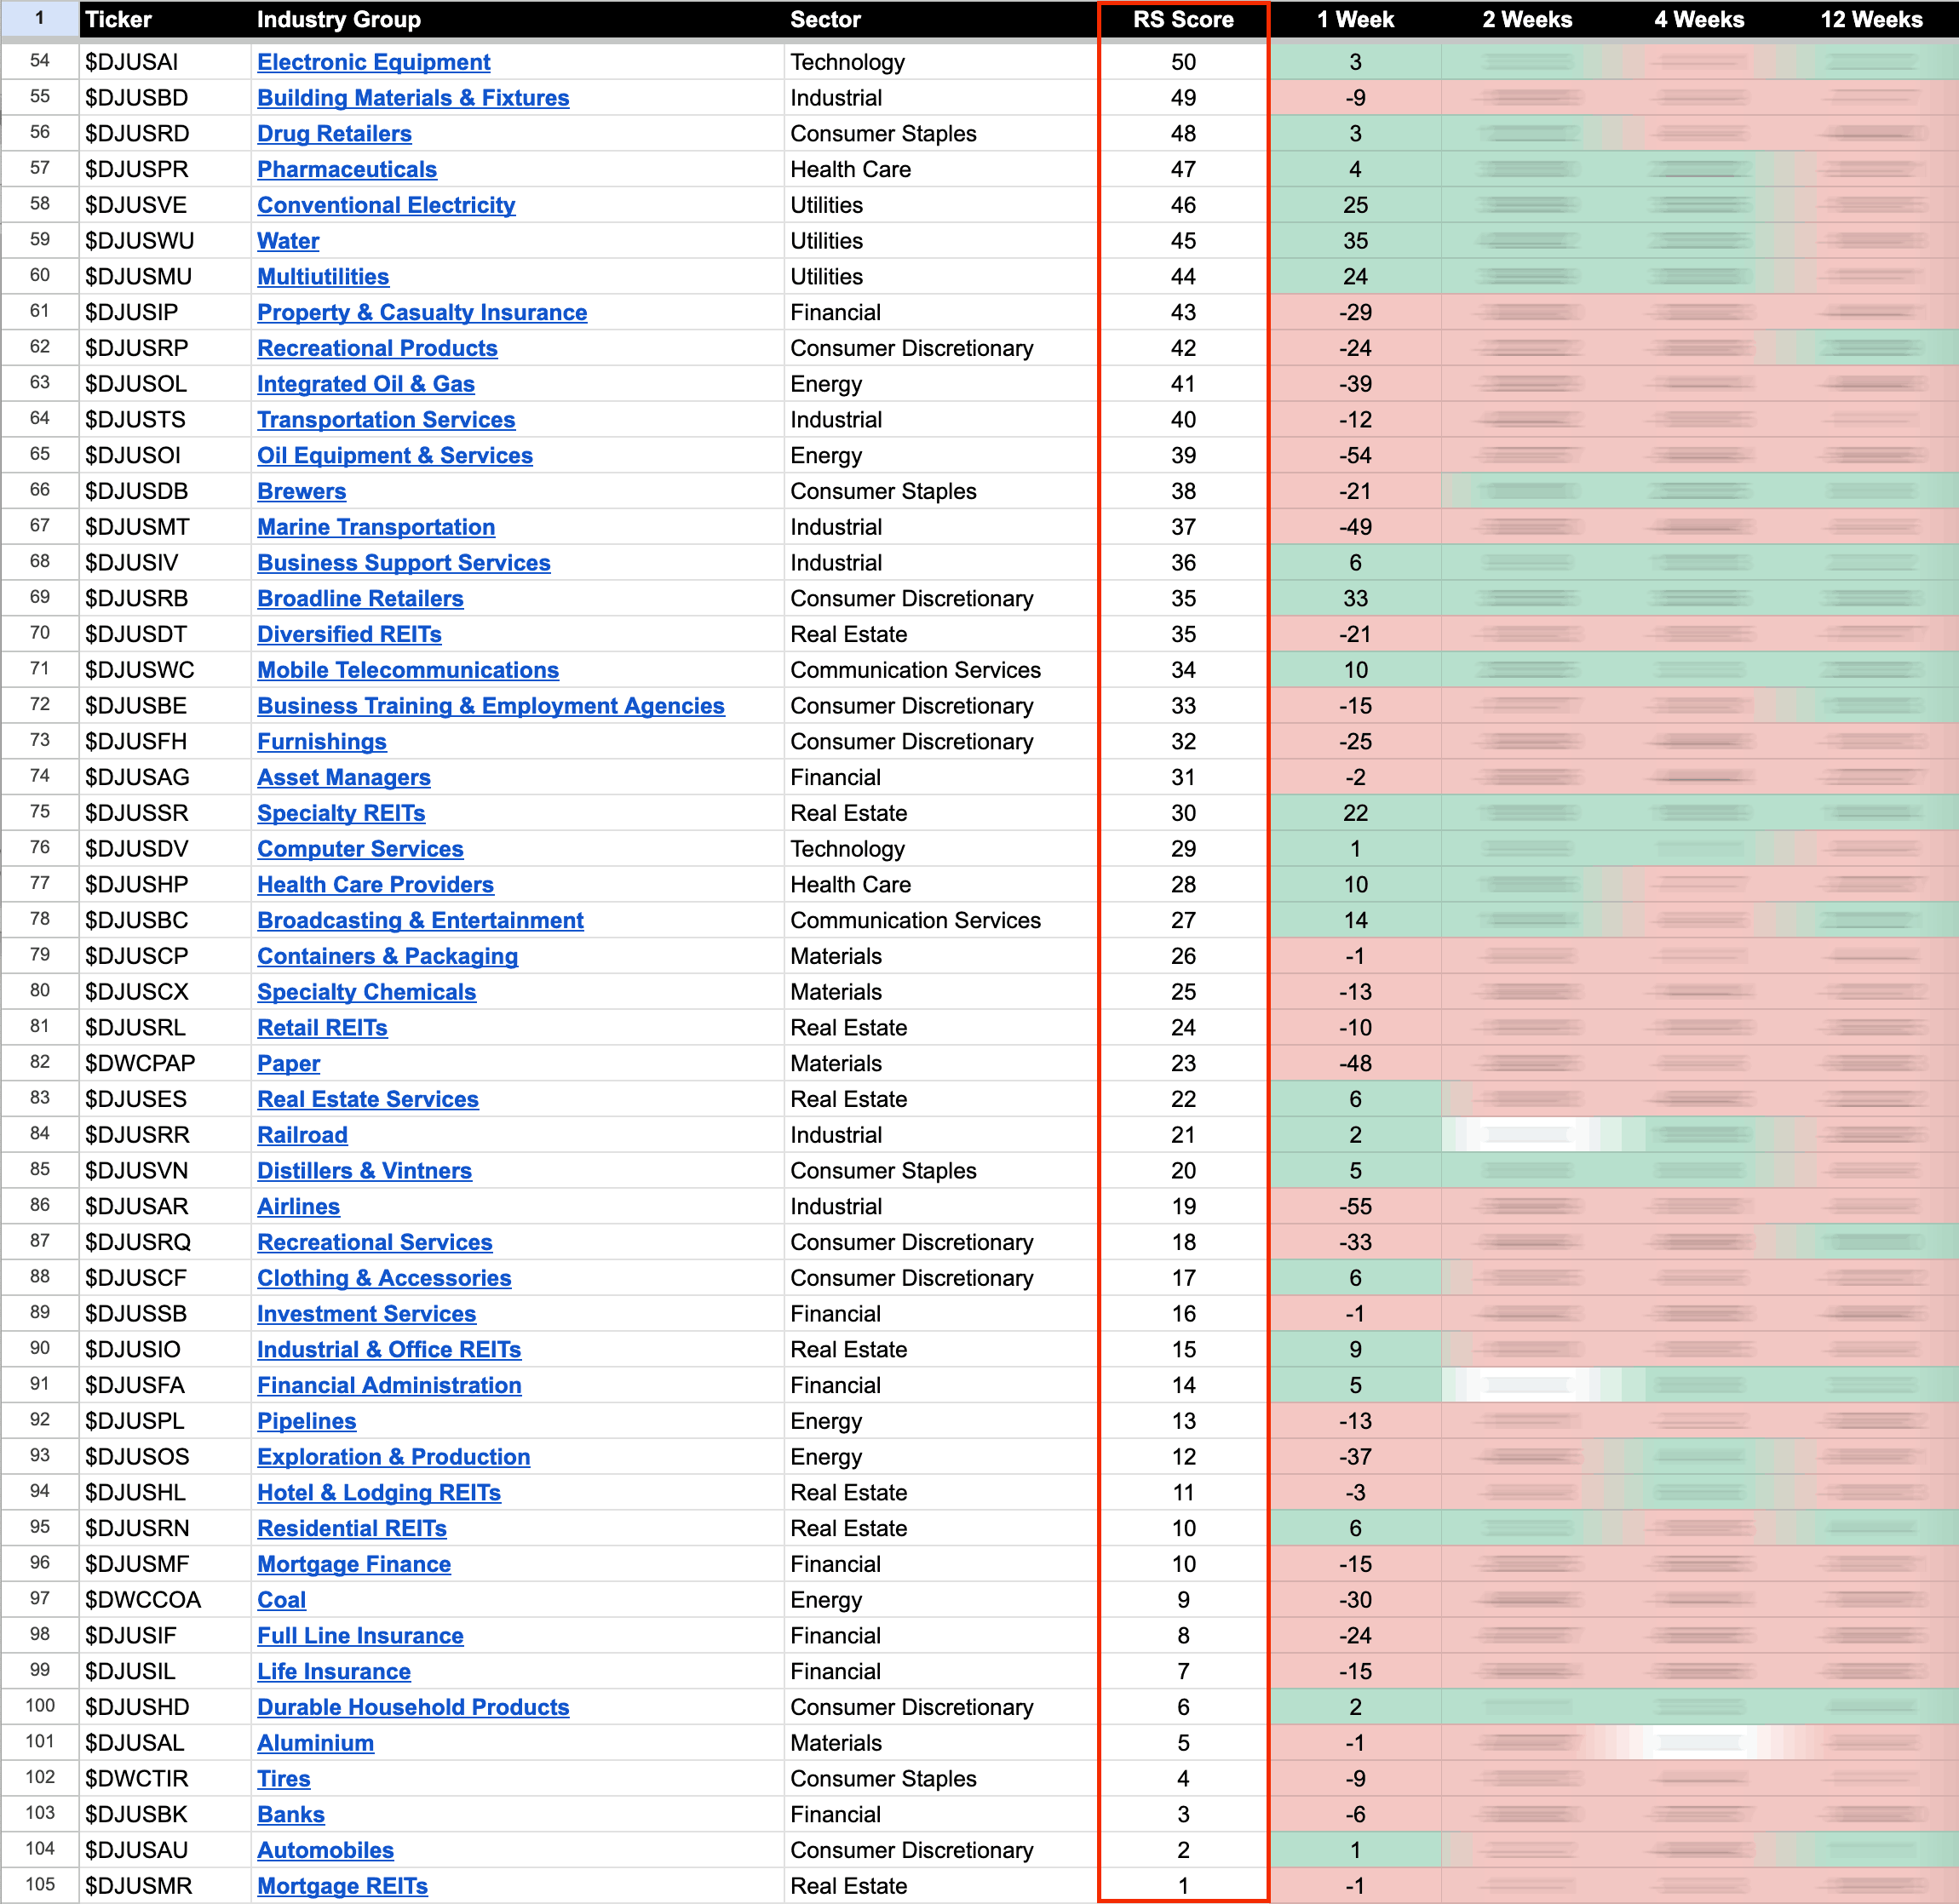
US Industry Groups by Weakest RS Score
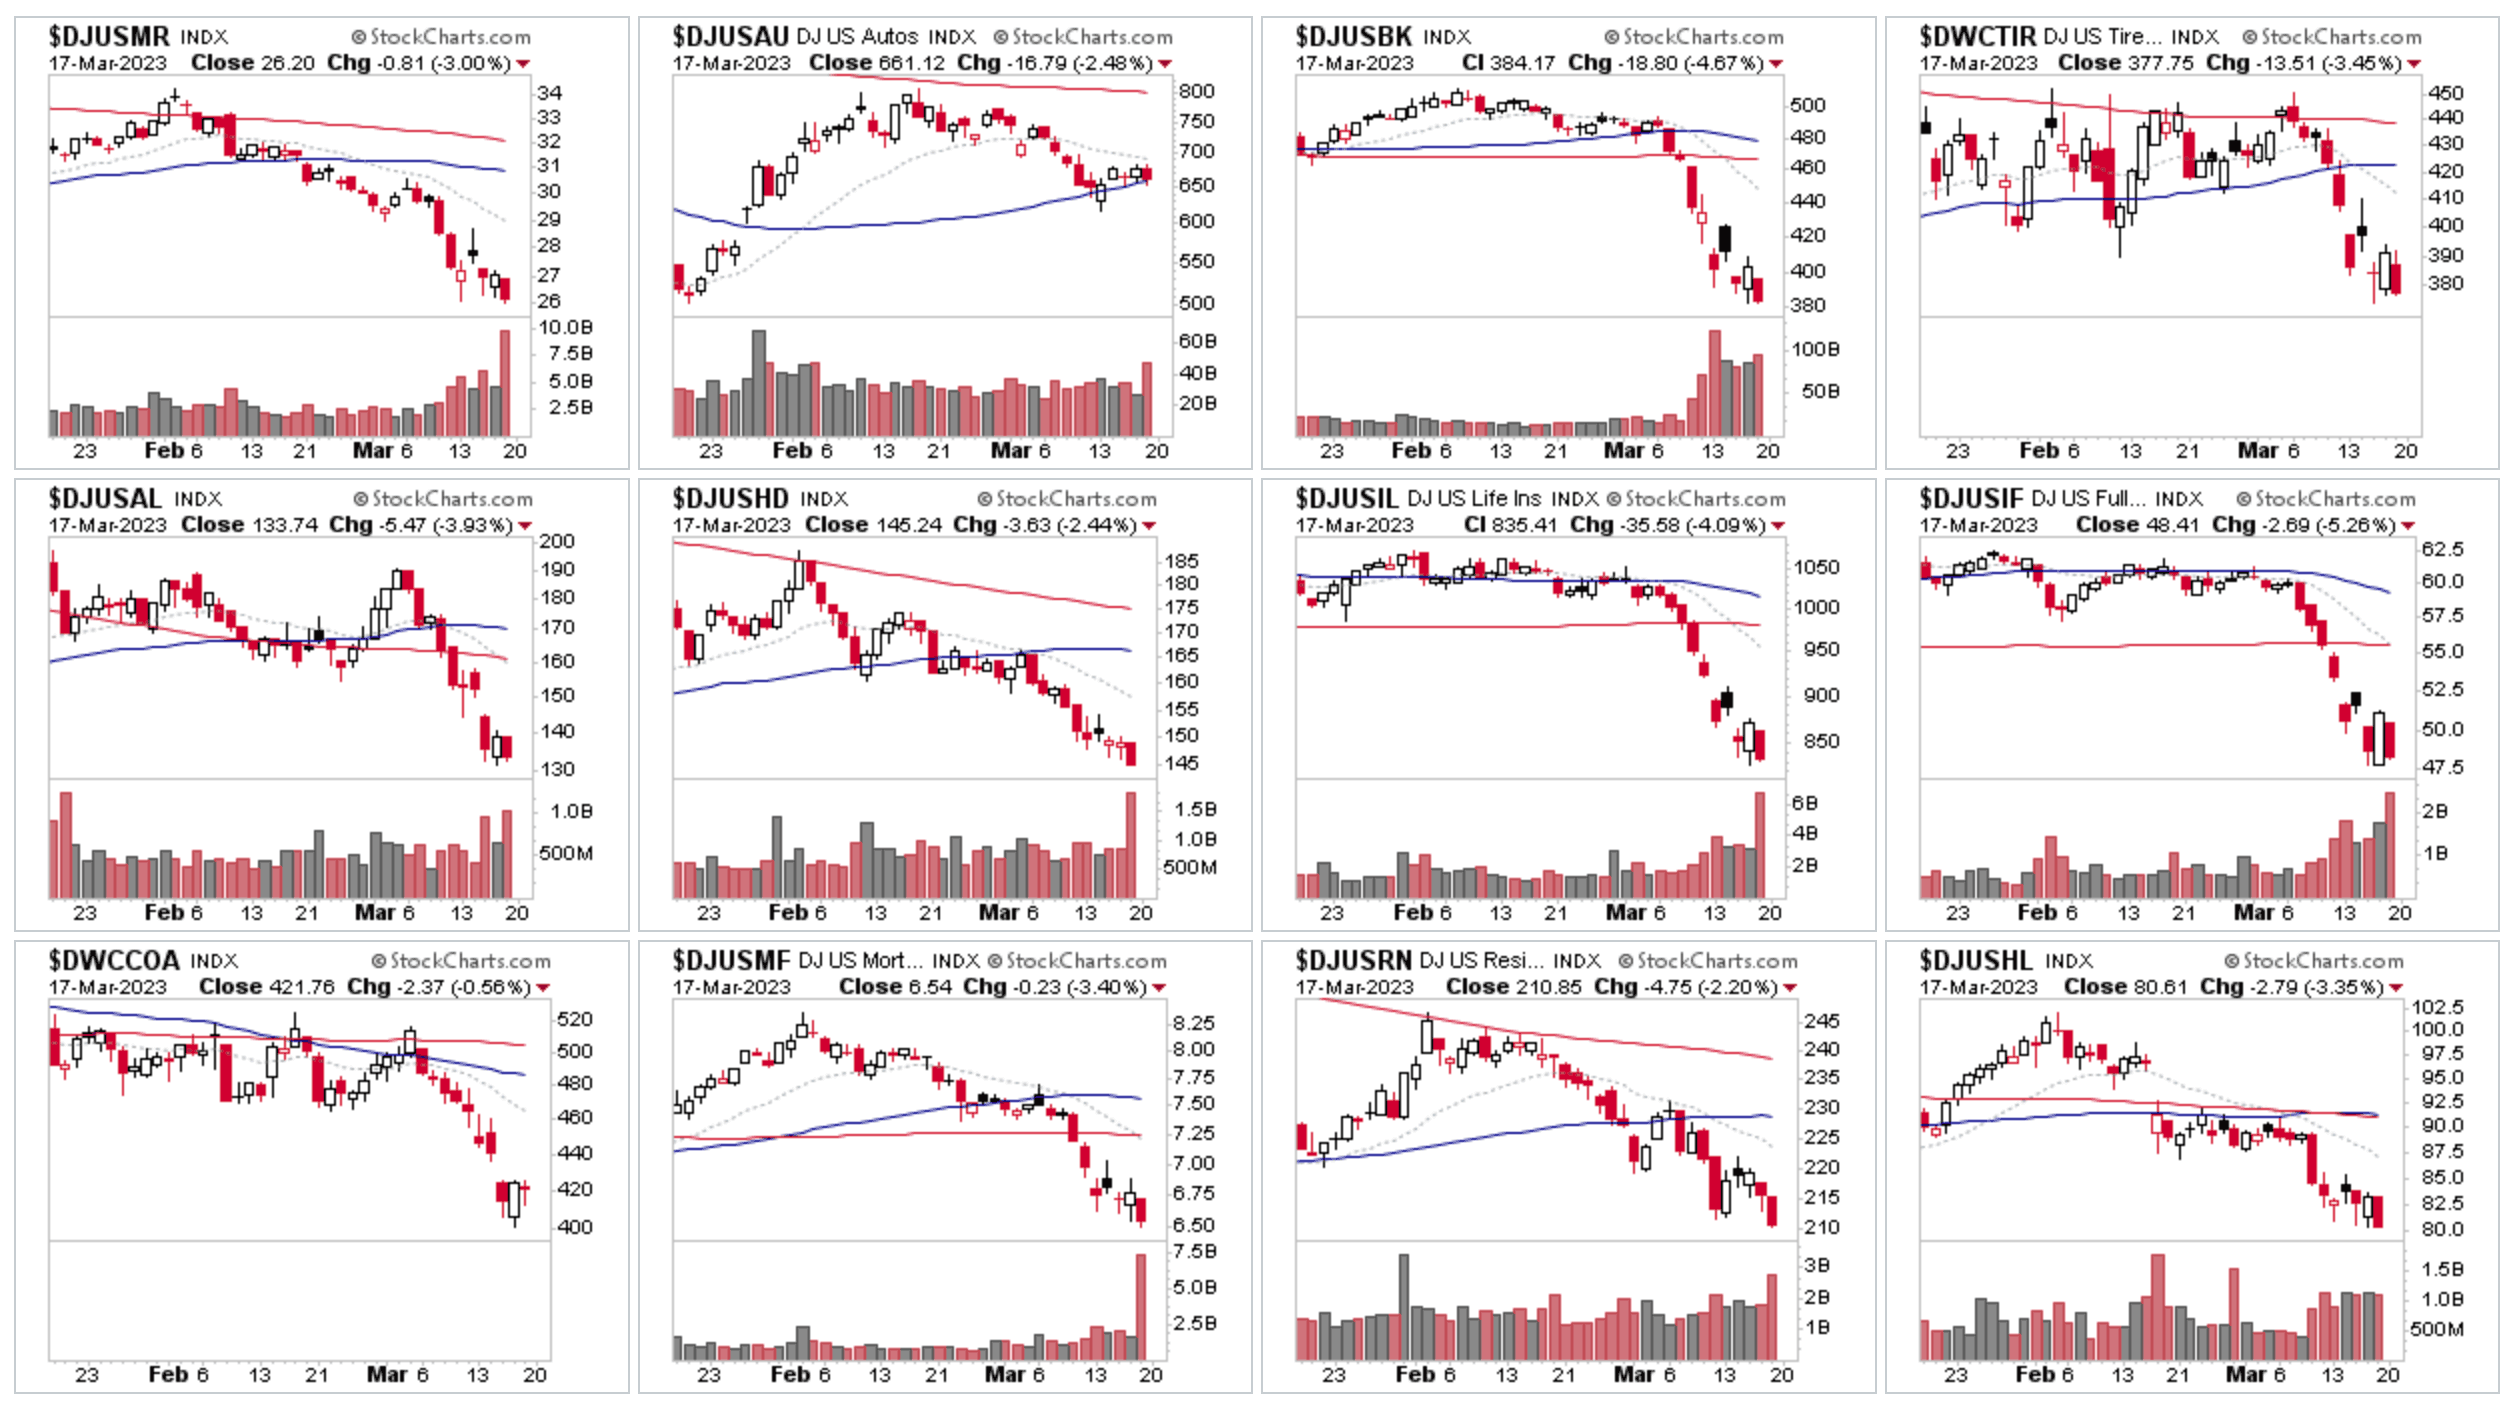
At the bottom end of the RS rankings Financial sector groups dominate to bottom 10, but there were lots of areas of relative weakness this week with 28.5% of the groups having decline of -5% or greater, and 8.6% having a decline of -9% or greater, which is a significant divergence with the gains that the S&P 500 and Nasdaq made.
There was also multiple Stage 4 breakdowns this week in the Energy sector due to Crude Oil Attempting a Stage 4 Continuation Breakdown, which discussed in the blog post on Tuesday 14th. Which led to Stage 4 breakdowns in Exploration & Production ($DJUSOS) and Coal ($DWCCOA) groups for example.
104 Dow Jones Industry Groups sorted by Relative Strength
The purpose of the Relative Strength (RS) tables is to track the short, medium and long-term RS changes of the individual groups to find the new leadership earlier than the crowd.
RS Score of 100 is the strongest, and 0 is the weakest.
In the Stage Analysis method we are looking to focus on the strongest groups, as what is strong, tends to stay strong for a long time. But we also want to find the improving / up and coming groups that are starting to rise up strongly through the RS table from the lower zone, in order to find the future leading stocks before they break out from a Stage 1 base and move into a Stage 2 advancing phase.
Each week I go through the most interesting groups on the move in more detail during the Stage Analysis Members weekend video – as Industry Group analysis is a key part of Stan Weinstein's Stage Analysis method.
Become a Stage Analysis Member:
To see more like this – US Stocks watchlist posts, detailed videos each weekend, use our unique Stage Analysis tools, such as the US Stocks & ETFs Screener, Charts, Market Breadth, Group Relative Strength and more...
Join Today
Disclaimer: For educational purpose only. Not investment advice. Seek professional advice from a financial advisor before making any investing decisions.