
Market Breadth: Percentage of Stocks Above their 50 Day, 150 Day & 200 Day Moving Averages Combined
The full post is available to view by members only. For immediate access:
51.35% (+2.59% 1wk)
Status: Difficult Environment
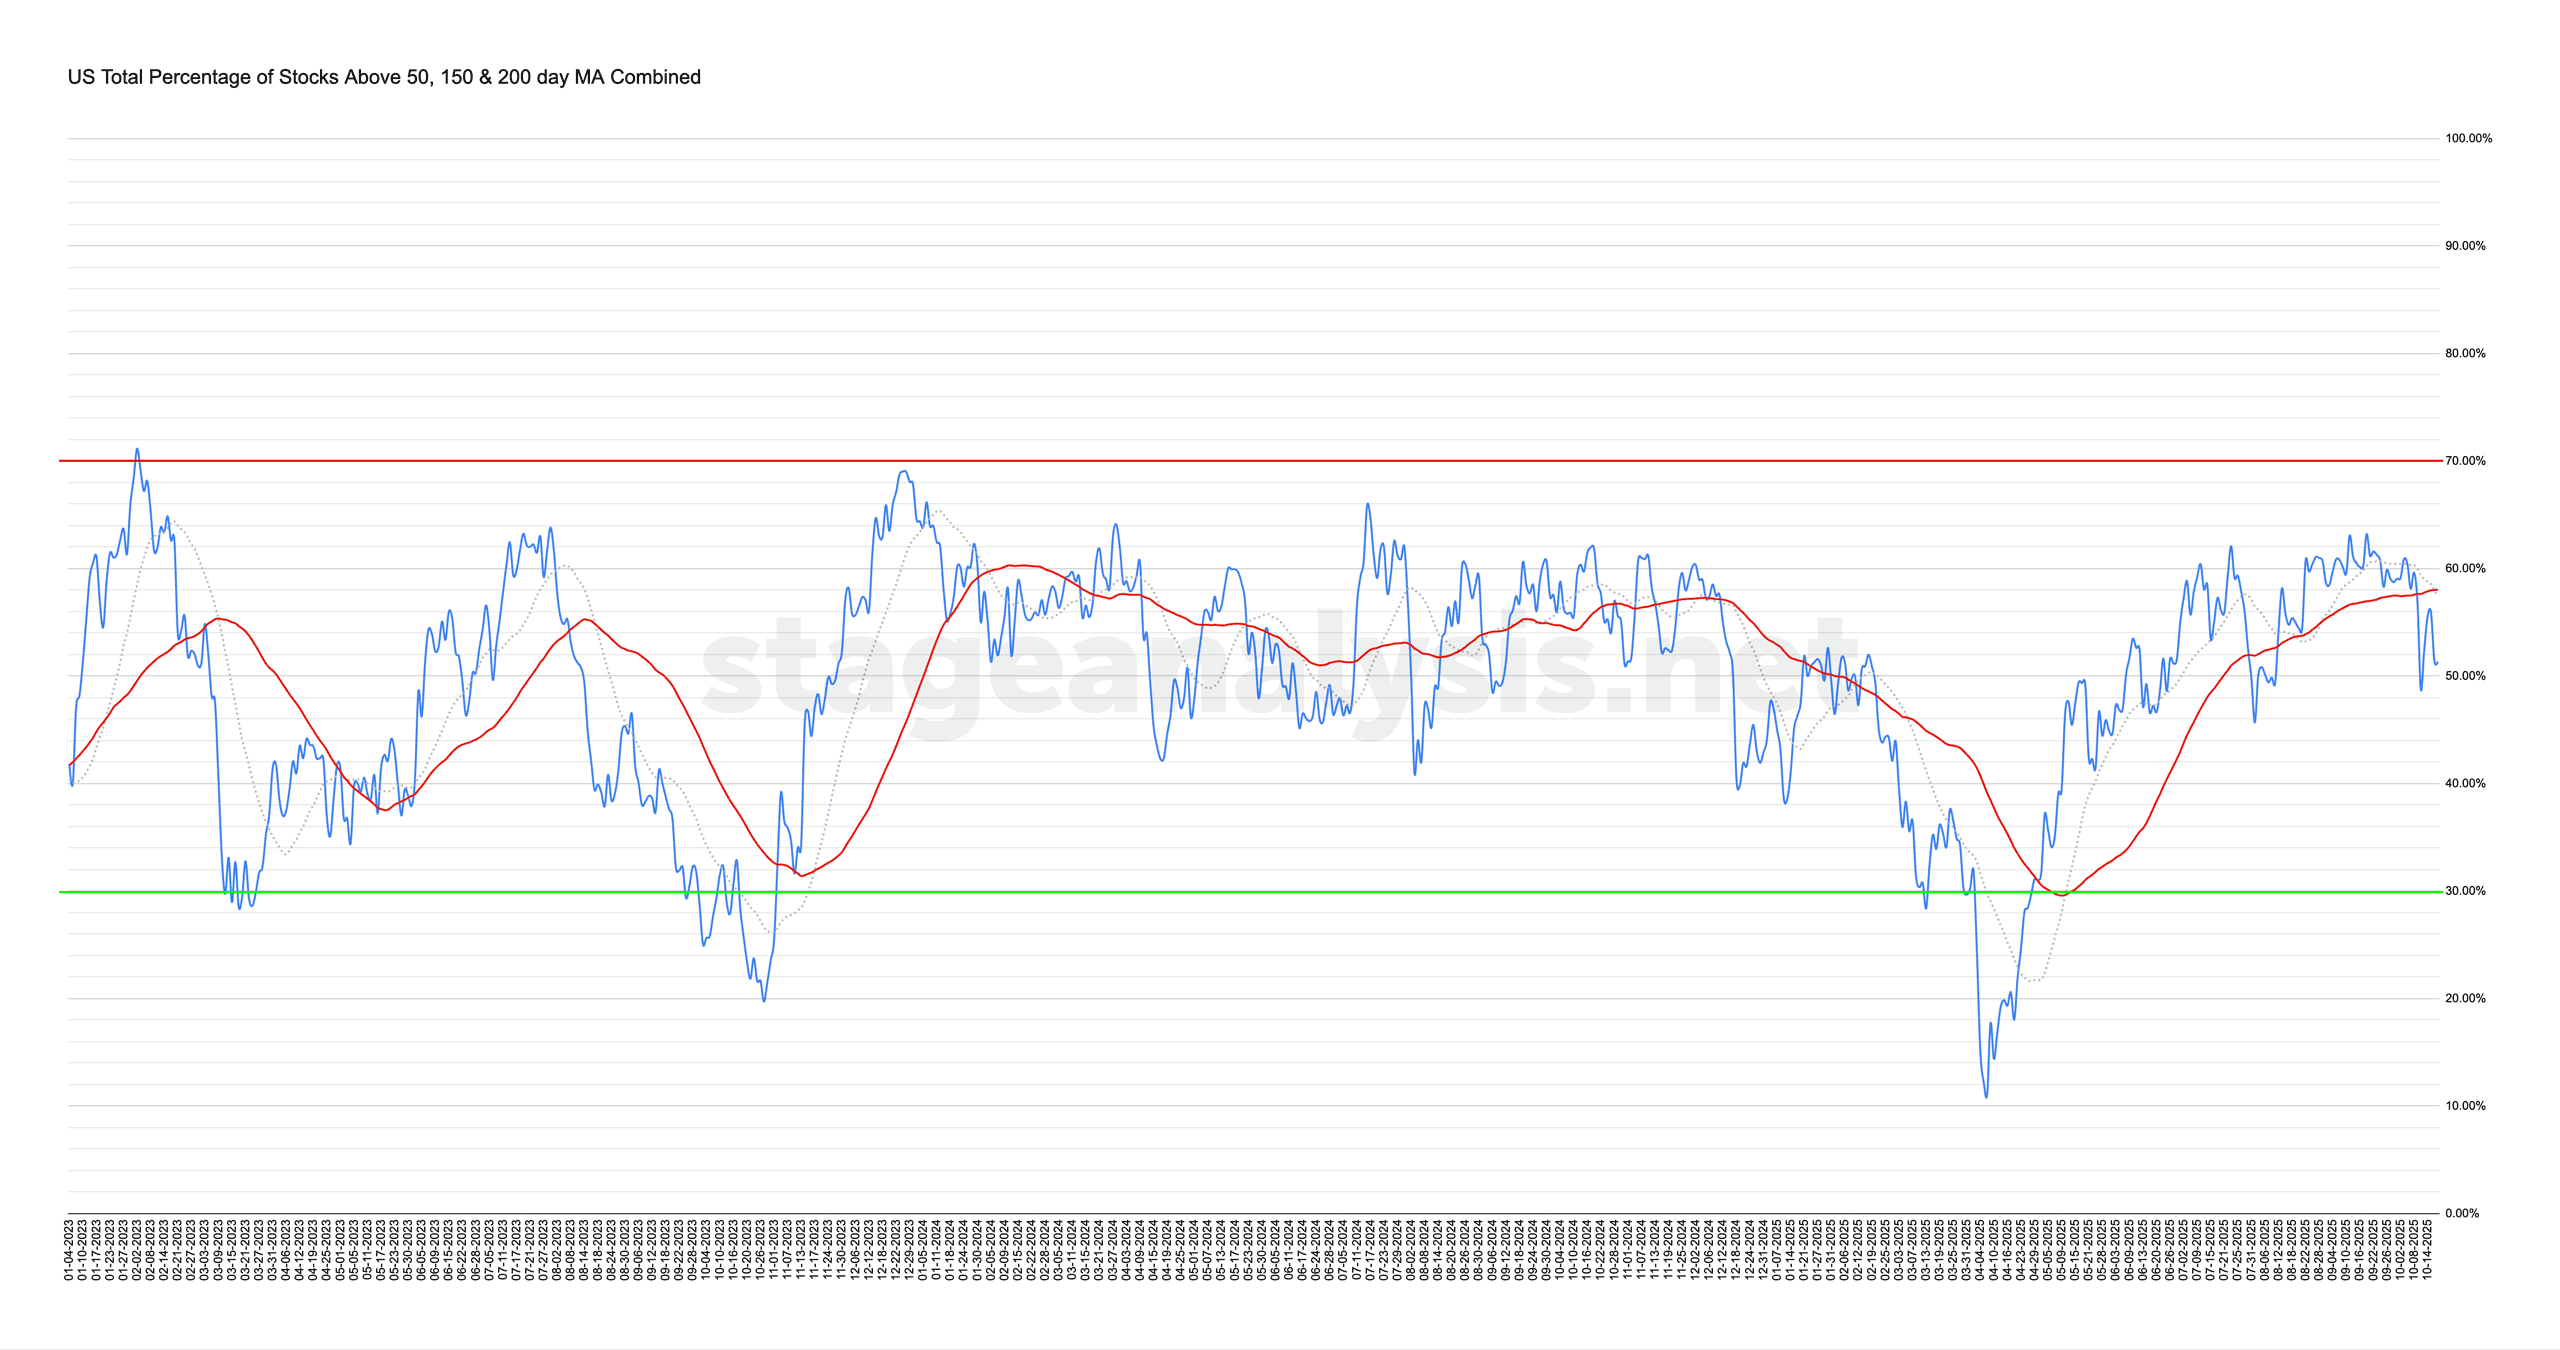
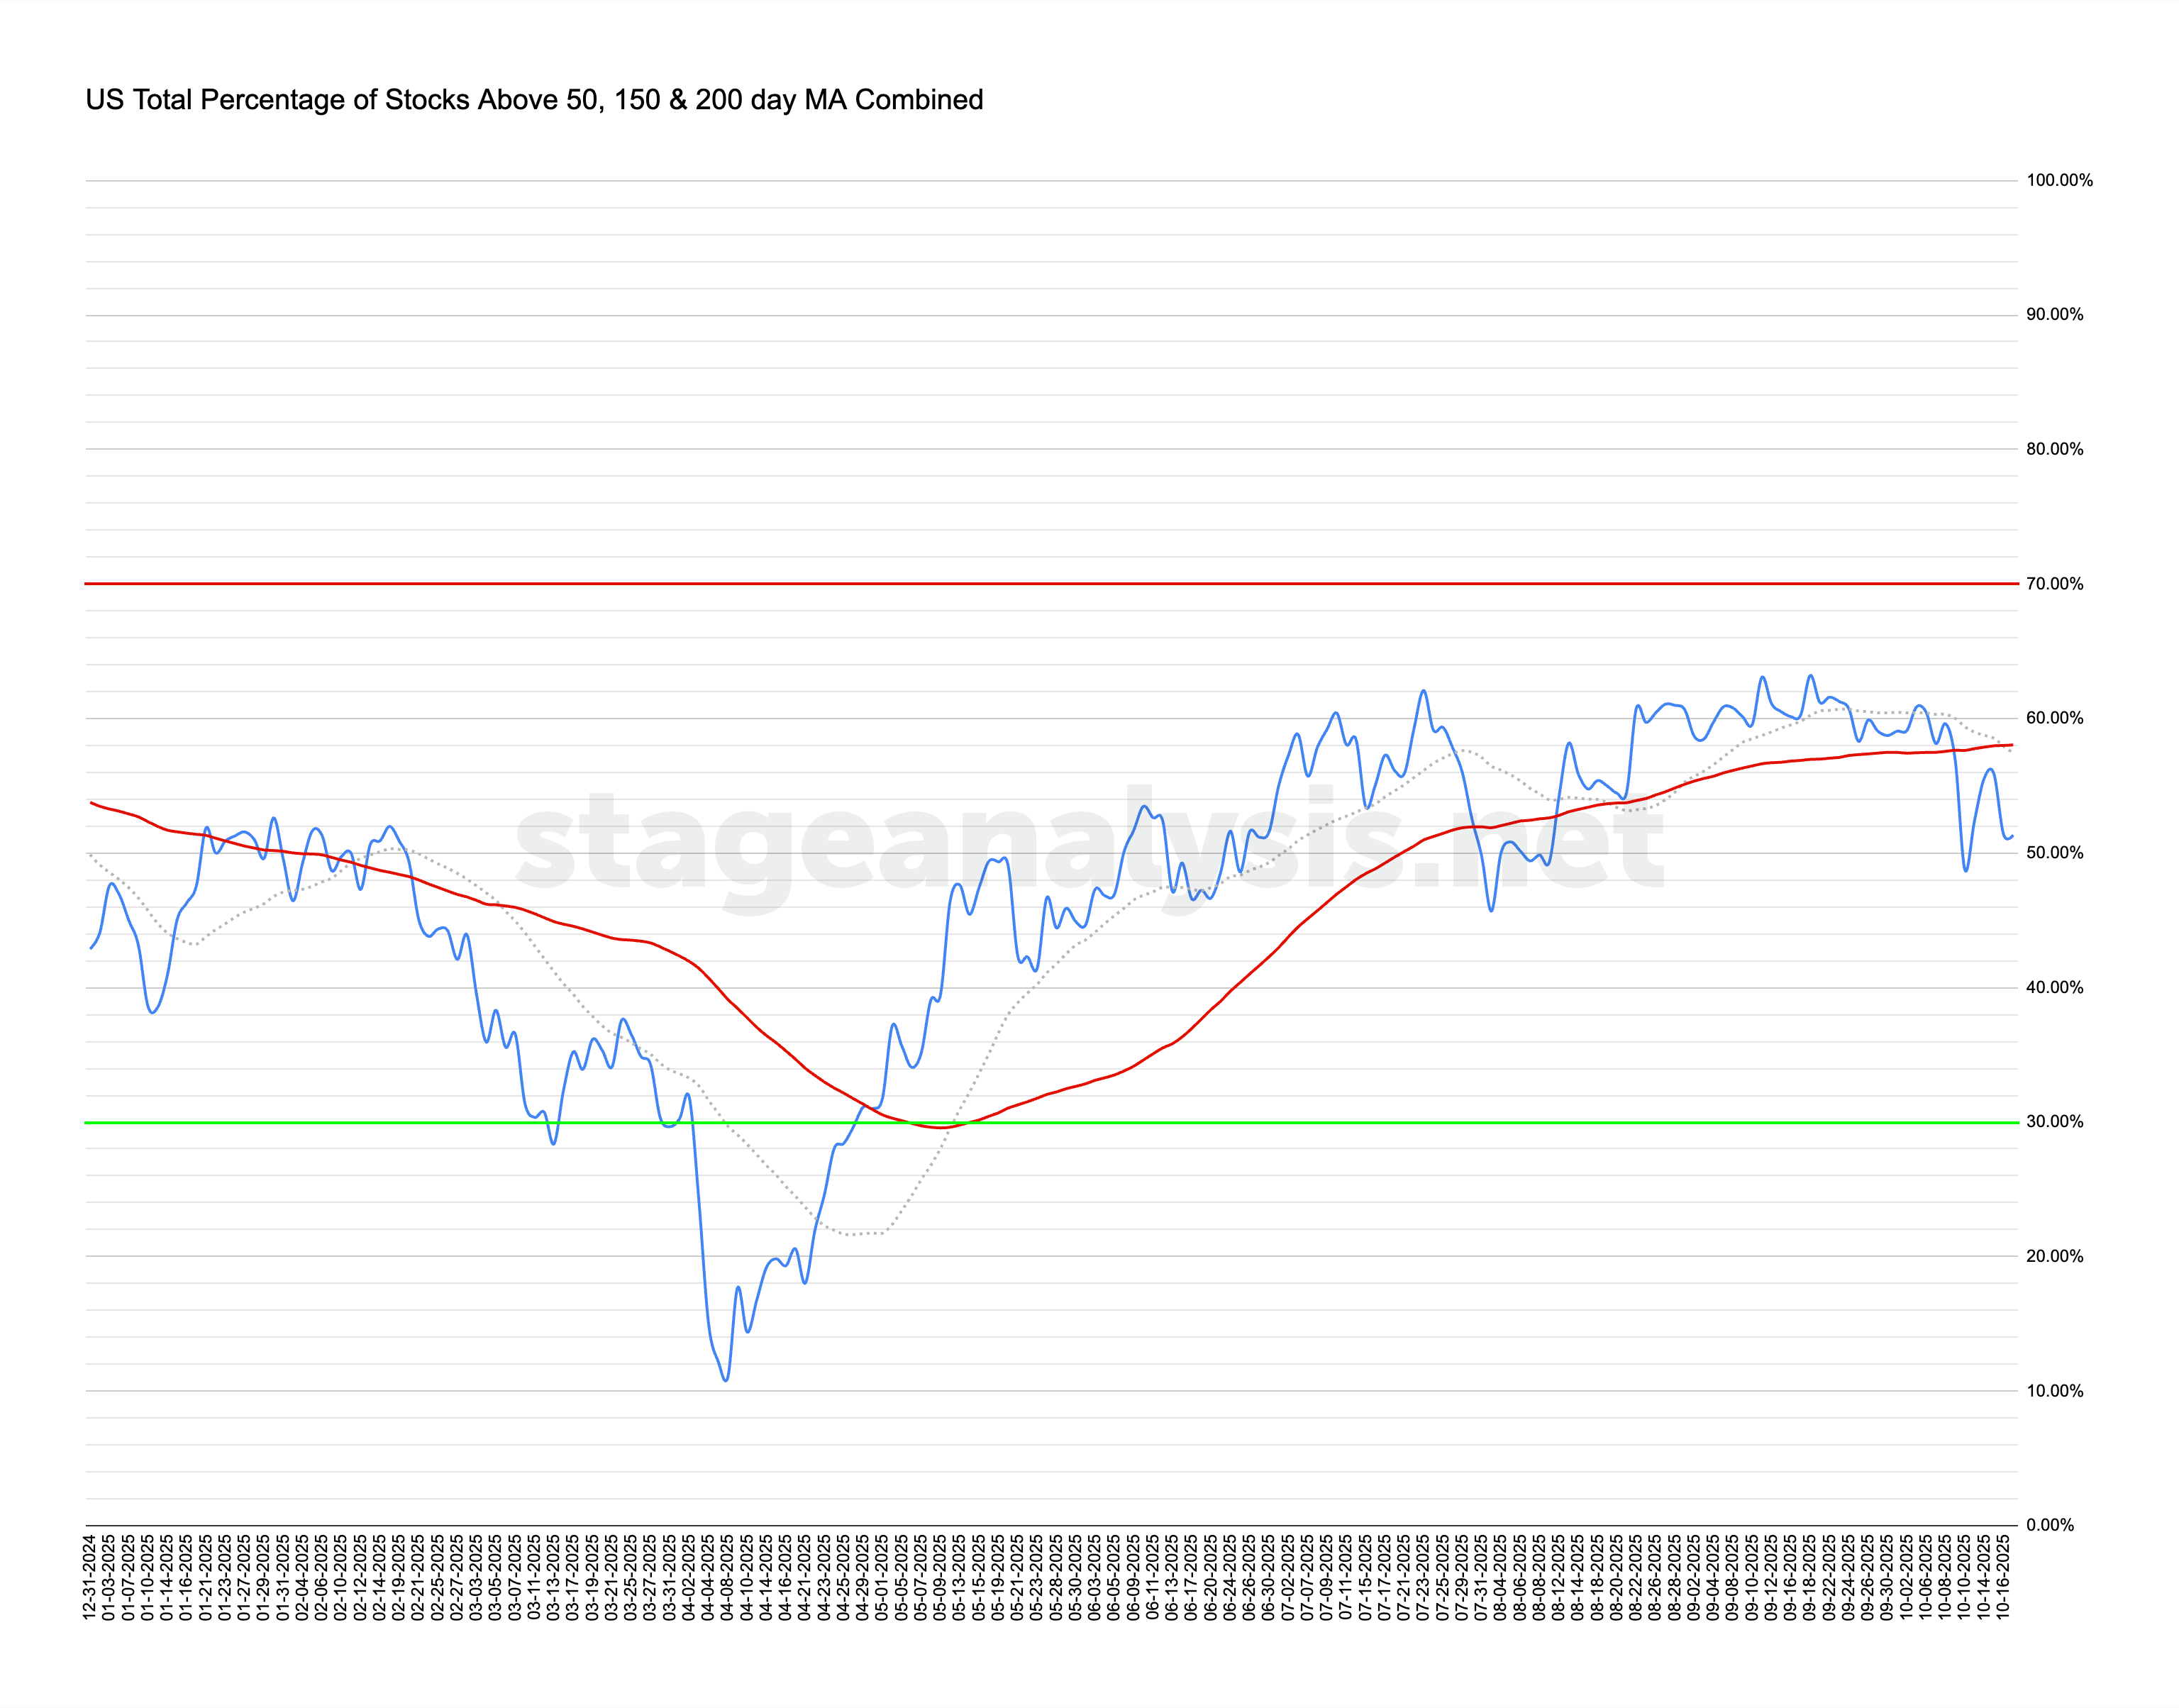
The US Total Percentage of Stocks above their 50 Day, 150 Day & 200 Day Moving Averages (shown above) increased by +2.59% this week.
Therefore, the overall combined average is at 51.35% in the US market (NYSE and Nasdaq markets combined) above their short, medium and long term moving averages.
The combined average rebounded during the middle of the week, regaining around 7% of last weeks -12% drop, but then dropped off again on Thursday. Ending the week +2.59% higher, which is still over -9% lower than where it was two weeks ago, and remains below both of the short-term moving averages by over -6%.
Therefore, it remains on a Difficult Environment status to start the new week with a defensive posture.
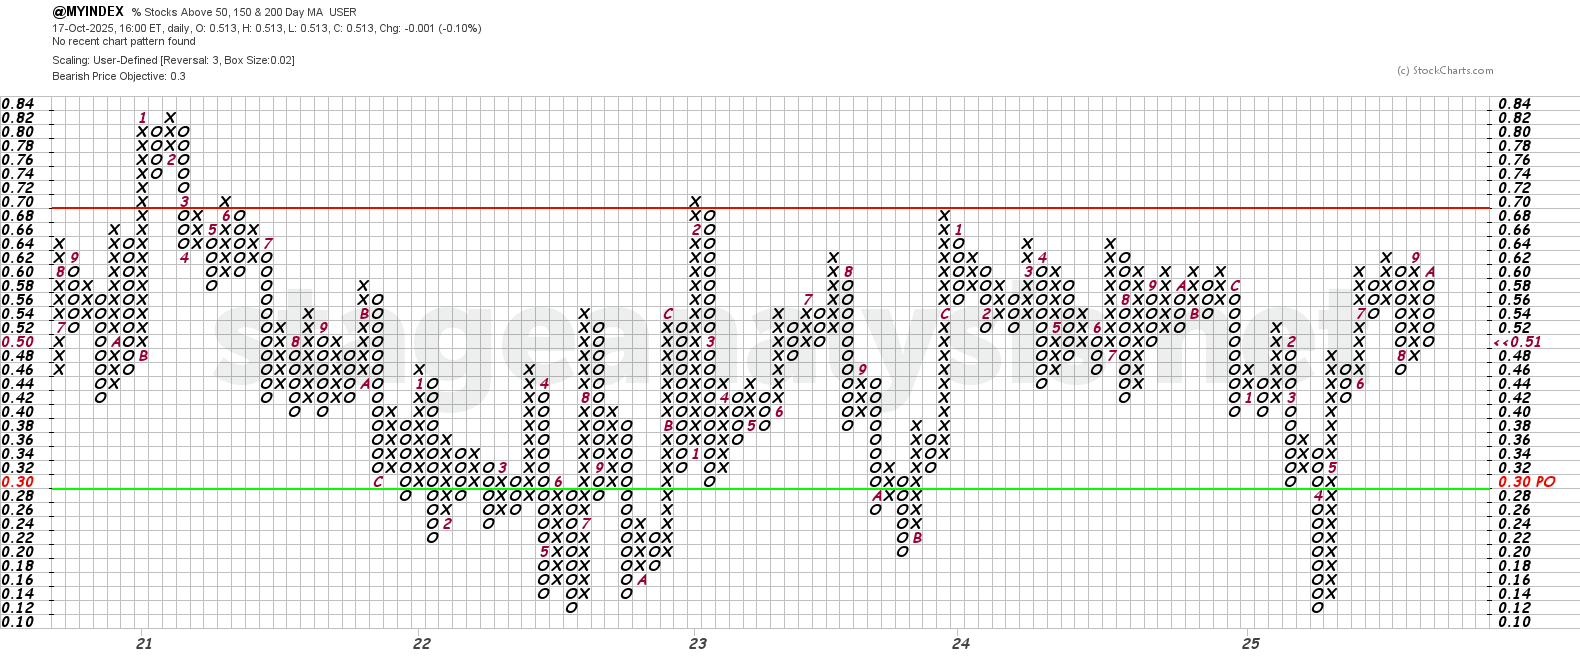
The Point and Figure (P&F) chart (shown above) was unchanged this week, and remains in a column of Os. So the P&F strategy remains on Defense (as it is in a column of Os), and P&F Bear Confirmed status in the middle of the field.
To reverse to Xs from the current position, it would need to close above the 56% level.
See the Bullish Percent article for more information on the P&F statuses.
Become a Stage Analysis Member:
To see more like this – US Stocks watchlist posts, detailed videos each weekend, use our unique Stage Analysis tools, such as the US Stocks & ETFs Screener, Charts, Market Breadth, Group Relative Strength and more...
Join Today
Disclaimer: For educational purpose only. Not investment advice. Seek professional advice from a financial advisor before making any investing decisions.